
A note on lower timeframe confirming price action…
Waiting for lower timeframe confirmation is our main tool to confirm strength within higher timeframe zones, and has really been the key to our trading success. It takes a little time to understand the subtle nuances, however, as each trade is never the same, but once you master the rhythm so to speak, you will be saved from countless unnecessary losing trades. The following is a list of what we look for:
- A break/retest of supply or demand dependent on which way you’re trading.
- A trendline break/retest.
- Buying/selling tails – essentially we look for a cluster of very obvious spikes off of lower timeframe support and resistance levels within the higher timeframe zone.
- Candlestick patterns. We tend to only stick with pin bars and engulfing bars as these have proven to be the most effective.
For us, lower timeframe confirmation starts on the M15 and finishes up on the H1, since most of our higher timeframe areas begin with the H4.
EUR/USD:
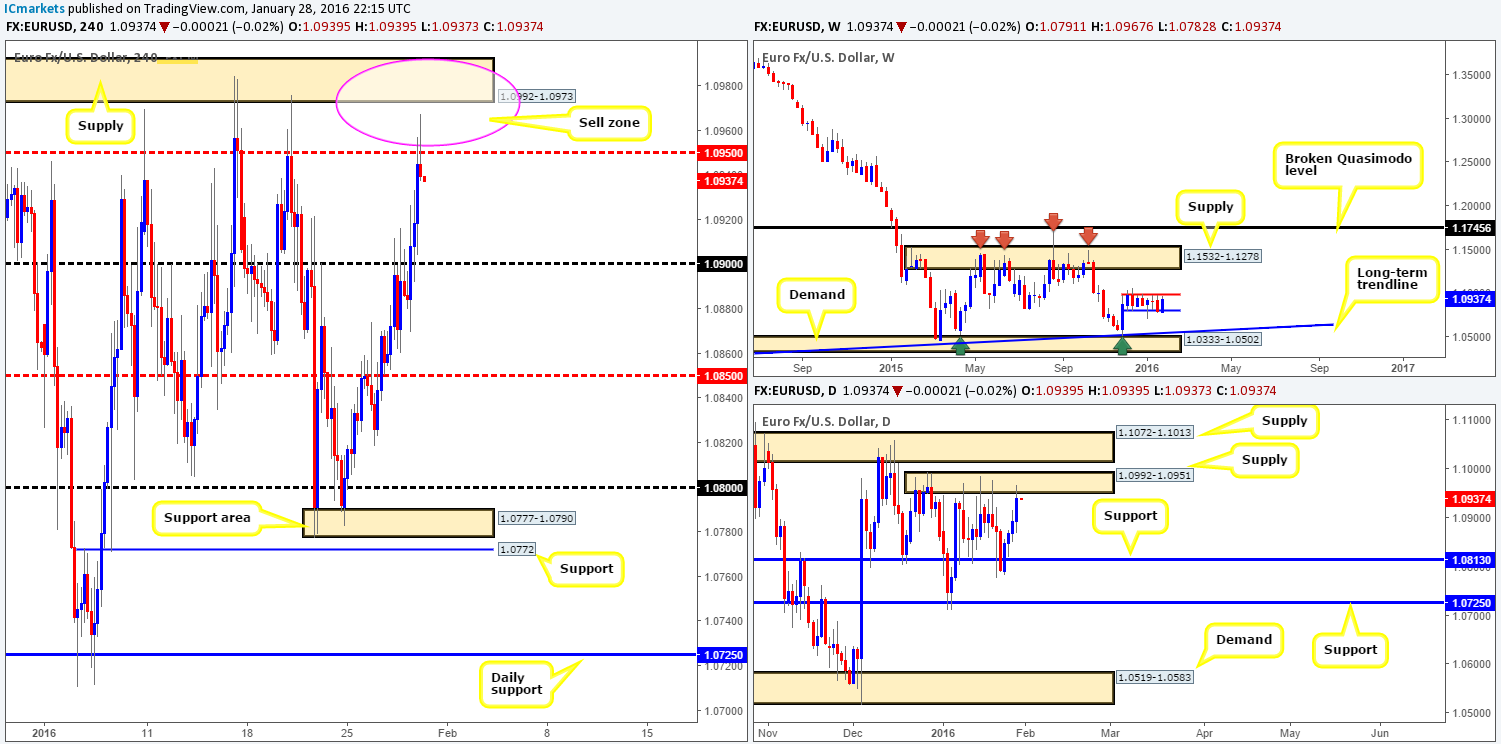
For those read our previous report (http://www.icmarkets.com/blog/thursday-28th-january-daily-technical-outlook-and-review/) you may recall us mentioning to watch for a close above and retest of the psychological number 1.0900. As shown on the H4 chart, this took place during the early hours of London. Unfortunately, we could not find any lower timeframe price action to validate buying from this level. Well done to any of our readers who did though since price hit take-profit (mid-level resistance 1.0950) with relative ease.
What we also spoke about in yesterday’s analysis was the mid-level number 1.1950 coupled with the H4 supply above at 1.0992-1.0973 was an area we’d consider shorting from. Reason being is that not only does it fuse beautifully with daily supply at 1.0992-1.0951, but the upper H4 supply also encapsulates the 1.0983 weekly level which has capped upside since early December 2015.
As you can see, price has already begun to sell-off from 1.0950 and could very well continue doing so down to at least 1.0900. If one were to short from here, the safest place for stops in our opinion would be above the H4 supply. Therefore, by shorting at current prices we’d be limiting ourselves to a risk/reward of 1:1. Ideally we would like to achieve higher than this so no sells will be initiated, at least on our account, at current prices. Instead what we’re looking for is a bounce higher into the pink circle – a short at the H4 supply would be perfect since the risk/reward from this barrier increases dramatically, if targeting 1.0900.
Levels to watch/live orders:
- Buys: Flat (Stop loss: N/A).
- Sells: 1.0971 [Pending order] (Stop loss: 1.0996).
GBP/USD:
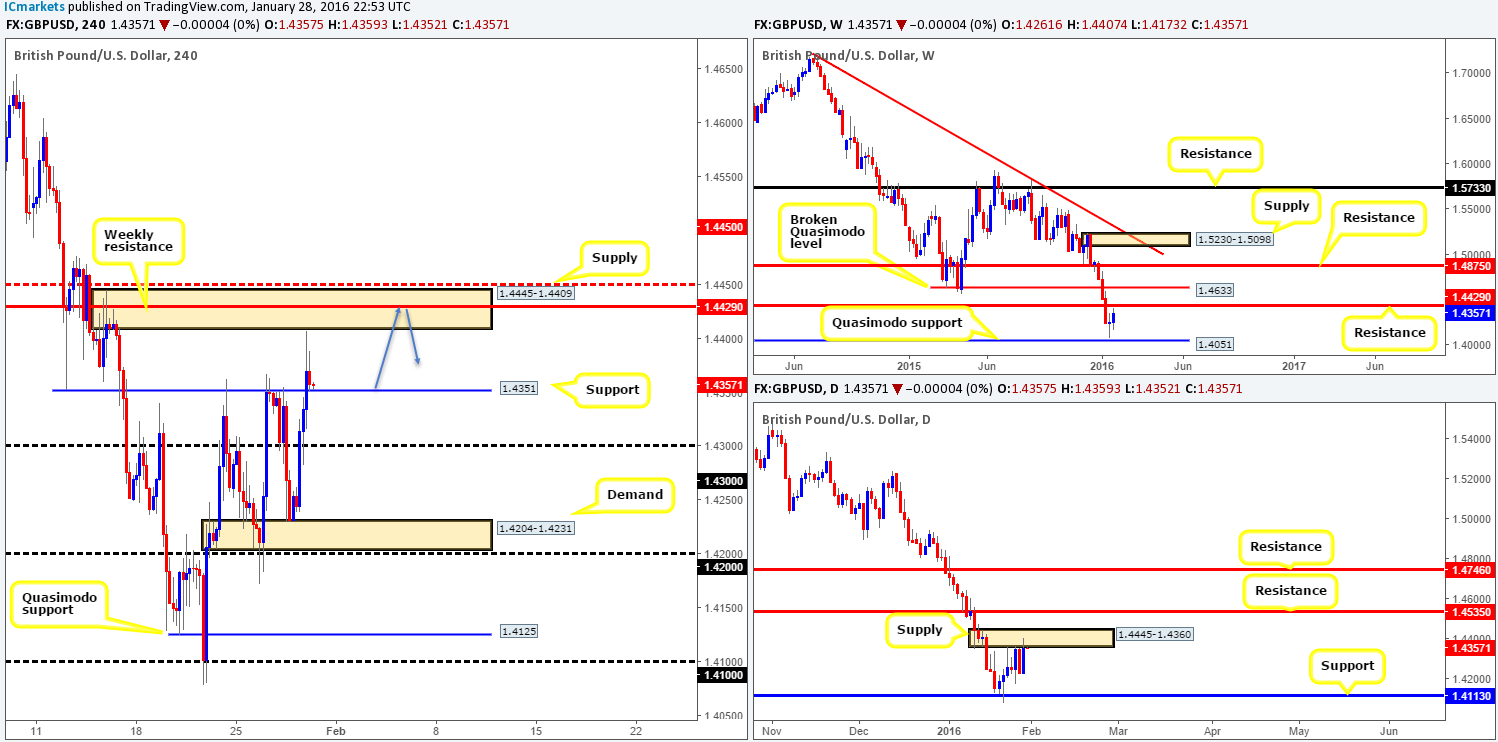
Following the release of the UK’s prelim GDP data at 9.30am GMT yesterday, Cable aggressively advanced north from the top-side of H4 demand coming in at 1.4204-1.4231. This clearly set the tone for the remainder of the day with price breaking above both psychological resistance 1.4300 and H4 resistance at 1.4351, ending the day just skimming the underside of H4 supply at 1.4445-1.4409.
In view of current price trading from 1.4351, now acting support, where do we go from here? Well, the small sell-off going into yesterday’s close should not really come as much of a surprise, since Cable is also trading from daily supply seen at 1.4445-1.4360. However, not only is the current H4 supply area surrounded by a larger daily supply, it also houses a weekly resistance level drawn from 1.4429, which could act as a magnet for price today and bounce this pair from support at 1.4351 as per the blue arrows. Should this occur, we’d be looking for sells just below the weekly barrier, around 1.4427. Targets would be dependent on the H4 approach.
In the event that support at 1.4351 caves in, however, the next objective to reach would be 1.4300. This could make for a nice intraday short should price retest the underside of this barrier together with a lower timeframe confirming signal such as a break of demand, a trendline break or even a collection of selling wicks at lower timeframe resistance.
Levels to watch/live orders:
- Buys: Flat (Stop loss: N/A).
- Sells: 1.4427 [Possible short here at market] (Stop loss: 1.4455). Watch for bids to be consumed around 1.4351 and look to trade any retest of this level seen thereafter (lower timeframe confirmation required).
AUD/USD:
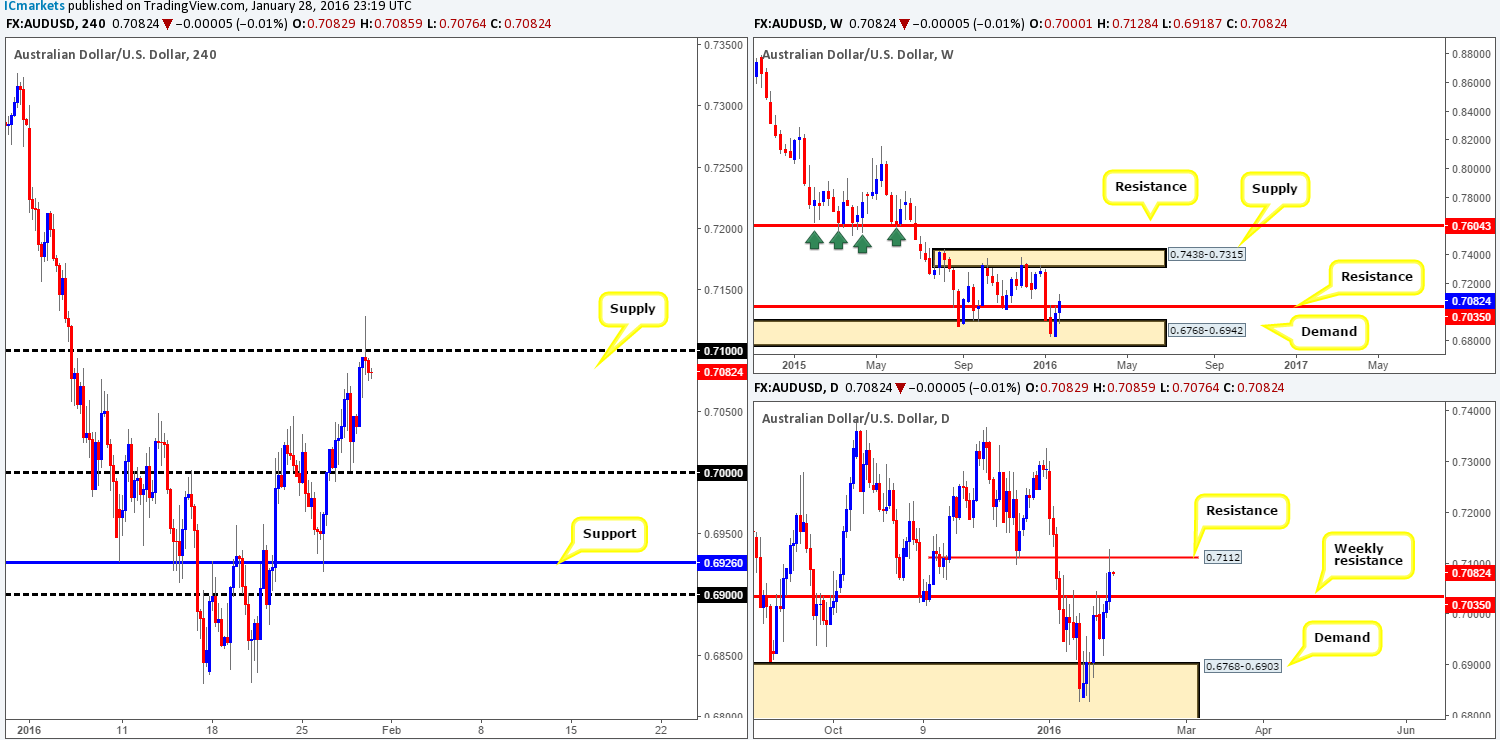
Beginning with a look at the weekly chart this morning, we can see that price recently poked its head above resistance penciled in at 0.7035. Nevertheless, before we all begin buying it may be worth waiting for the weekly candle to close shop before presuming that this resistance is consumed.
Zooming in and looking at the daily chart, the close above weekly resistance is clear for everyone to see, but what is rather concerning is the fact that this bullish advance traded directly into the hands of resistance drawn from 0.7112.
Moving down into the pits of the H4 chart, the recent buying on this pair saw market action whipsaw through psychological resistance 0.7100 by the day’s end. One can only imagine the pain caused at this level, a truckload of stops was very likely taken out here! With this potential run on stops, lots of traders would naturally think to short especially seeing as how the daily is also at resistance. However, the drawback to this is the weekly push above resistance we discussed above. Usually higher timeframes overrule the lower and selling following a break of a weekly level would not likely do your account any favors if the break higher turns out to be to be a continuation move rather than a fakeout to drive lower.
Considering that it’s the last trading day of the week today, we’re personally going to pass on this one. If you still believe there is enough reason to short from 0.7100, we would strongly advise only doing so with lower timeframe confirming price action, preferably from the M30/M60 timeframes.
Levels to watch/live orders:
- Buys: Flat (Stop loss: N/A).
- Sells: Flat (Stop loss: N/A).
USD/JPY:
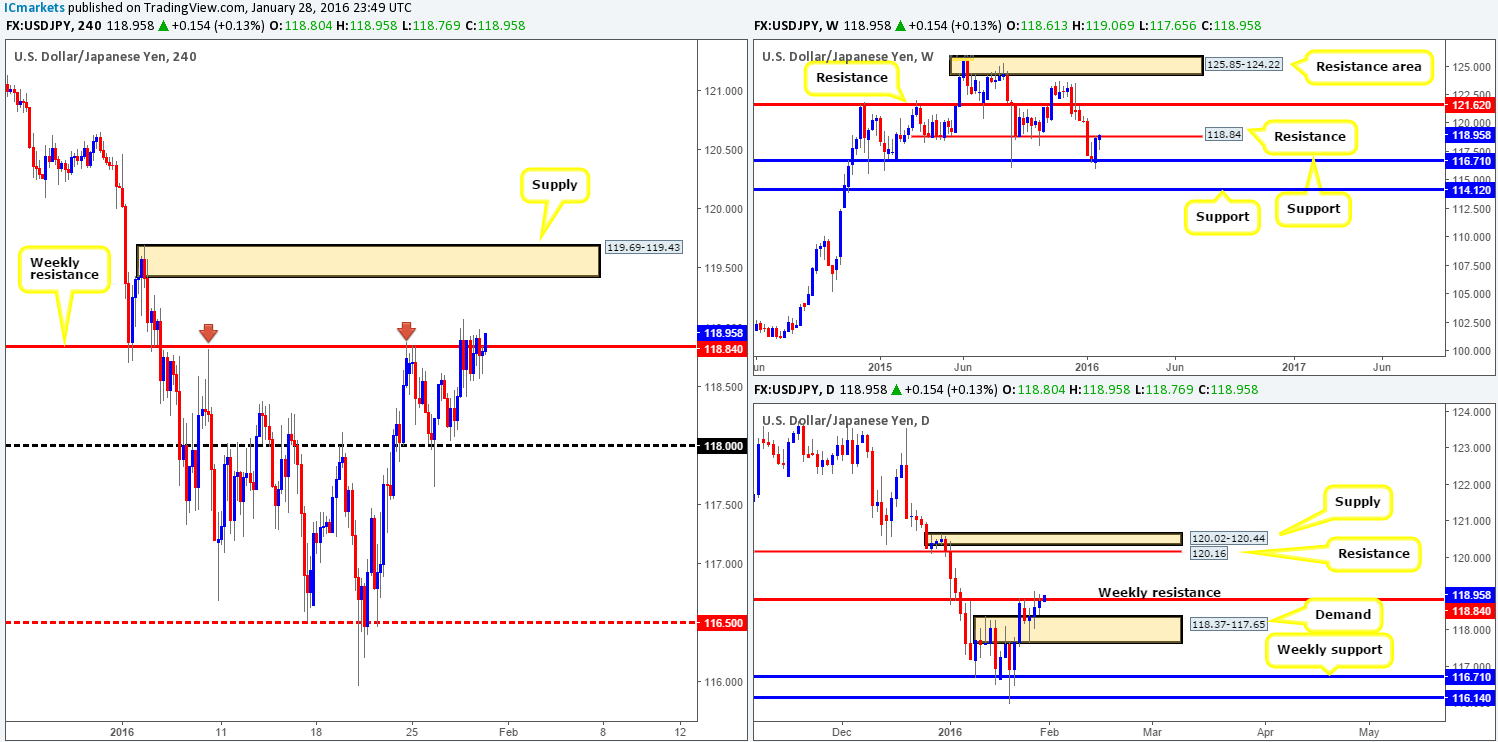
Amid yesterday’s sessions, the USD/JPY traded within a tight range of sixty pips around the weekly resistance level painted at 118.84. Purely from a price-action perspective, offers appear to be drying up around this hurdle indicating a push higher could be on the cards. Be that as it may, with the BoJ set to take center stage 5am GMT this morning, technicals could fly out the window! As such, we’re not going to be executing any trades before this time.
On the technical side of things, a sustained move above 118.84 could, if the level is retested as support, be a nice platform in which to look for confirmed buys from. The first take-profit target from here can be seen at the H4 supply coming in at 119.69-119.43. Nevertheless, price could trade much higher than this area given the room seen above the weekly resistance on both the weekly and daily charts – the closest structure comes in at 120.16 (a daily resistance).
To the downside, a sell-off from 118.84 could bring prices back into the jaws of 118.00 which is bolstered by daily demand at 118.37-117.65, thus forming a potential reversal zone to keep an eye on today. Beyond this barrier, we have our eye on the weekly support at 116.71/H4 mid-level support 116.50. Therefore, a sustained move below and confirmed retest of 118.00 could be an opportunity to short this market down to the 116.50 region.
Levels to watch/live orders:
- Buys: 118.00 [Tentative – confirmation required] (Stop loss: dependent on where one confirms this level). Watch for offers to be consumed around 118.84 and look to trade the any retest seen thereafter (lower timeframe confirmation required).
- Sells: Watch for bids to be consumed around 118.00 and look to trade the any retest seen thereafter (lower timeframe confirmation required).
USD/CAD:
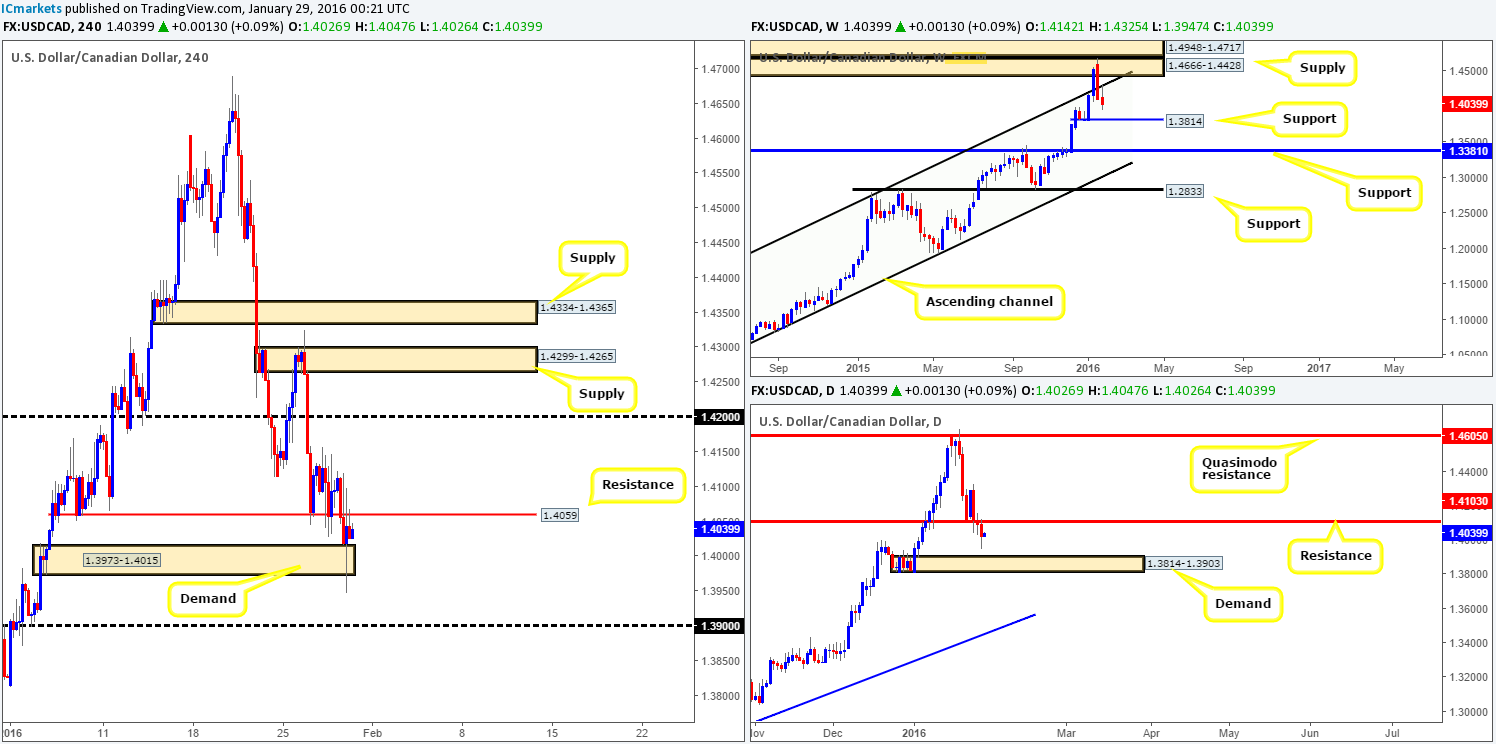
Starting from the top this morning, weekly flow shows that following the rebound from the underside of the weekly channel resistance (1.1173), further selling is currently being seen. In the event that this momentum continues, price could visit support coming in at 1.3814. Scrolling down a page to the daily chart reveals that after Wednesday’s close below support at 1.4103, sellers continued to drive this pair lower. If our analysis is correct, the Loonie has little to stop it from colliding with demand penciled in at 1.3812-1.3903 which encapsulates weekly support at 1.3814.
Turning our attention to the H4 chart, support at 1.4059 did indeed give way as mentioned it likely would in our previous report. Price then went on to aggressively whipsaw through H4 demand at 1.3973-1.4015 into the close 1.4026. With stops likely removed from H4 demand, the path south is potentially free down to psychological support 1.3900. Now, we’re not really interested in shorting this market, what we are interested in however is 1.3900 for confirmed longs. The reason being is simply due to the fact that 1.3900 represents the top-side of daily demand drawn from 1.3812-1.3903, which as we mentioned above surrounds the weekly support at 1.3814 as well! Why we require lower timeframe confirmation at 1.3900 comes down to the simple fact that psychological levels are prone to some very nasty fakeouts. The best, or should we say, safest place to have your stops would likely be beyond the daily demand zone itself should you wish to enter at market here.
Levels to watch/live orders:
- Buys: 1.3900 [Tentative – confirmation required] (Stop loss: dependent on where one confirms this level).
- Sells: Flat (Stop loss: N/A).
USD/CHF:
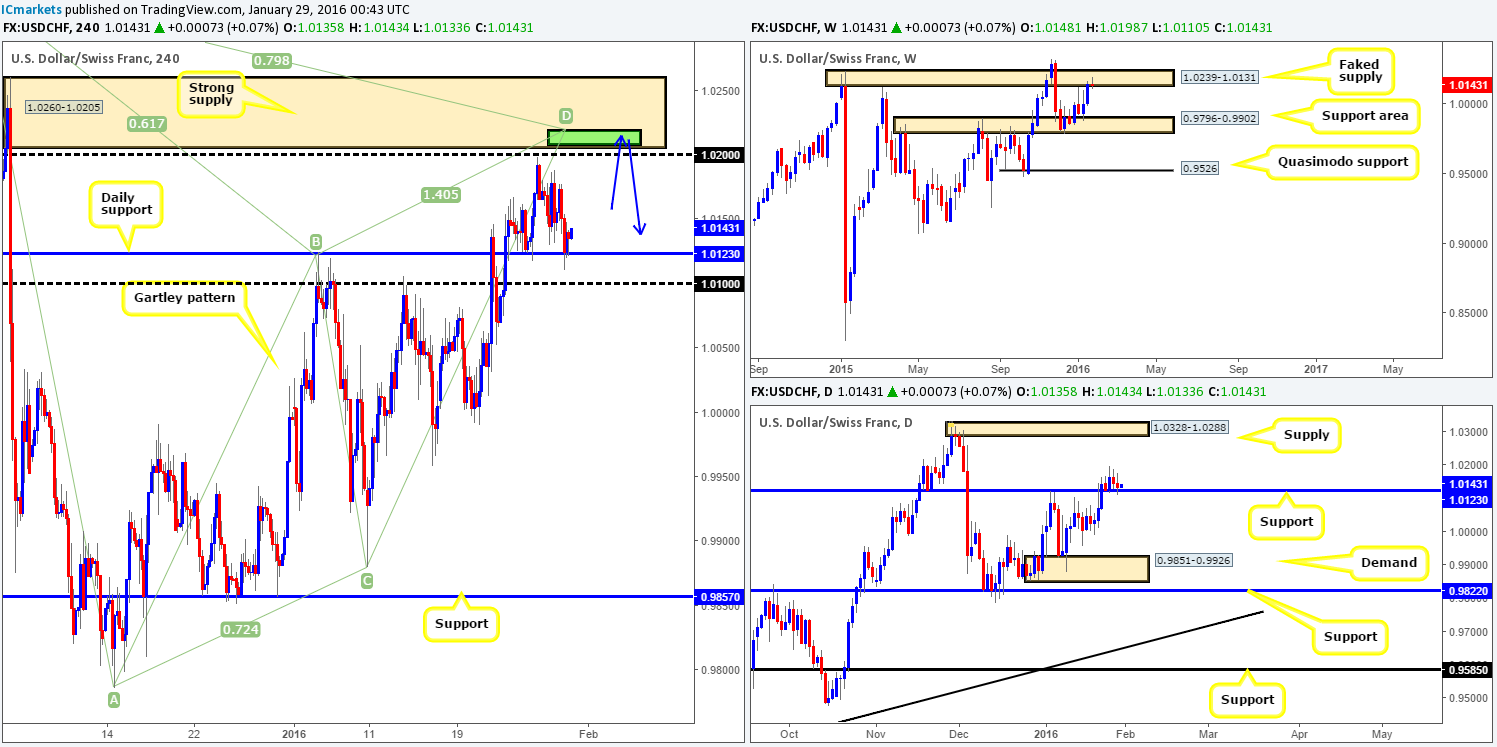
The USD/CHF is really, really beginning to test our patience! For the last few days we have had a pending sell order set at 1.0203 on the basis of the following converging structures:
- Weekly trading at a faked supply area coming in at 1.0239-1.0131.
- A mouthwatering H4 supply sits at 1.0260-1.0205.
- Psychological resistance 1.0200.
- H4 Harmonic Gartley pattern completion point between 1.0207/1.0218 (green area).
The only drawback to this trade is the current support being seen on the daily chart at 1.0123. As can be seen, this level has held relatively well this week and certainly casts doubt over the above said sell zone. Nevertheless, we’d much prefer to trade in-line with the weekly timeframe rather than the daily, so our pending order remains in place for now.
In light of us also looking to short the EUR/USD, we would advise traders not to take both trades! For those who are not aware, the EUR/USD and USD/CHF has a strong inverse correlation. Therefore, pick the best trade from the two and stick with that!
Levels to watch/live orders:
- Buys: Flat (Stop loss: N/A).
- Sells: 1.0203 [Pending order] (Stop loss: 1.0264).
DOW 30:
Once again we begin our analysis of the DOW on the weekly timeframe. The stock index has, for nearly three weeks now, been finding support around the 15978 mark, but has yet to register any meaning. By contrast, resistance at 16083 on the daily timeframe has been able to hold this market lower since the 18th January. In our opinion there is a clear tug-of-war taking place between these two higher timeframe structures at the moment, and when the rope breaks you may not want to be in the way!
Looking down to the H4 timeframe, however, it is clear to see that price is not only hugging the underside of the above said daily resistance, but is also encased within a H4 ascending channel (15698/16119). Given this, there is not much room seen for prices to move. A push lower lands one in the hands of the channel support and a break higher has a few steps to climb before reaching H4 supply coming in at 16277-16217.
In view of the above points in bold, our team will remain flat until more favorable price action is presented.

Levels to watch/live orders:
- Buys: Flat (Stop loss: N/A).
- Sells: Flat (Stop loss: N/A).
XAU/USD: (Gold)
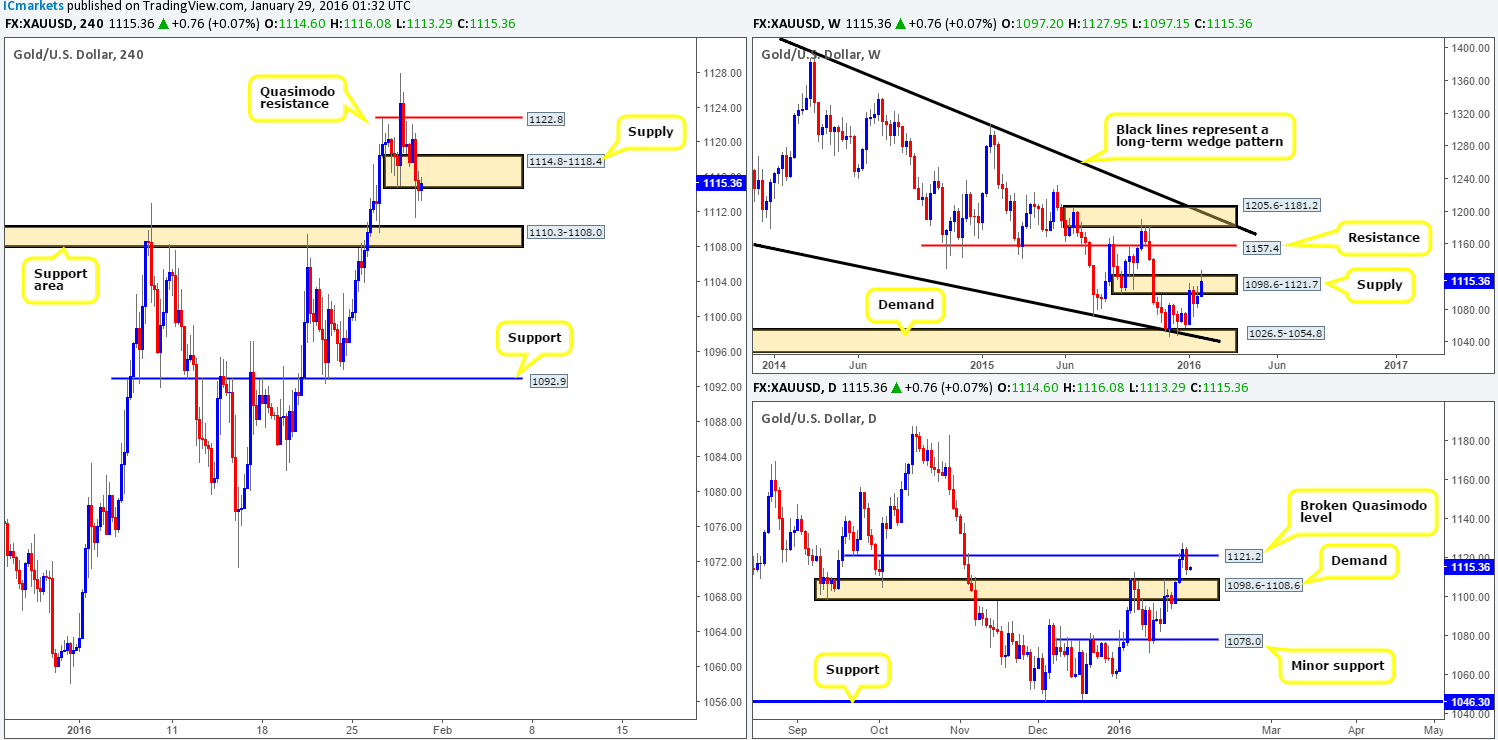
In our previous report on Gold (http://www.icmarkets.com/blog/thursday-28th-january-daily-technical-outlook-and-review/), we spoke about looking for lower timeframe buy entries within the H4 demand at 1114.8-1118.4. A bounce was seen from this area but price failed to break above M15 supply at 1122.4-1121.7, so we passed on trading this zone. Not too long after this, the U.S. session opened for business forcing the yellow metal to tumble lower. In one fell swoop price thrashed below the current H4 demand and then remained relatively stable for the remainder of the day.
Along with price trading within weekly supply at 1098.6-1121.7 and from a broken daily Quasimodo line at 1121.2, there is scope (at least as far as we see) for further selling today towards the H4 support area at 1110.3-1108.0 (sits just within daily demand at 1098.6-1108.6). Personally, however, the only places we’d be comfortable shorting from (with lower timeframe confirmation) is within the recently broken H4 demand now acting supply and the H4 Quasimodo resistance up at 1122.8. A trade from either area would have the same target – the top-side of the H4 support base at 1110.3.
Levels to watch/live orders:
- Buys: Flat (Stop loss: N/A
- Sells: 1114.1118.4 [Tentative – confirmation required] (Stop loss: dependent on where one confirms this area). 1122.8 [Tentative – confirmation required] (Stop loss: dependent on where one confirms this level).


