
EUR/USD:
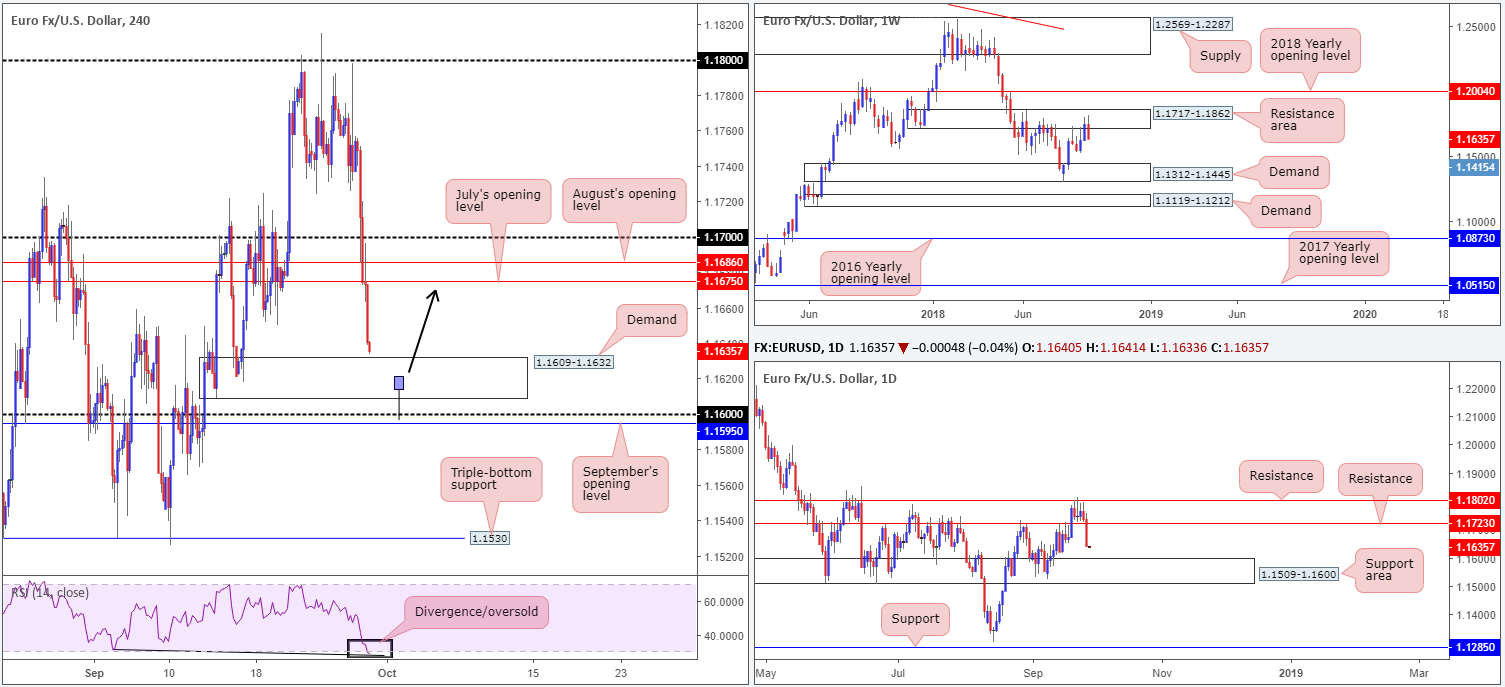
From an open of 1.1736 to a close of 1.1640, the single currency concluded Thursday’s sessions down 0.8%. USD bulls were firmly on the offensive in recent trade thanks to robust US data and a recovery in yields. According to the latest GDP report, the US economy expanded at its fastest pace in nearly 4 years, confirmed at an annual rate of 4.2%. US Durable goods also doubled expectations, though the increase was largely due to Boeing orders.
H4 movement, as can be seen from the chart, ended the day closing within striking distance of demand plotted at 1.1609-1.1632, after a number of key tech supports were engulfed. Positioned just north of the 1.16 handle and September’s opening level at 1.1595, this demand area is likely to enter the fray today. It may also be worth noting the RSI indicator is displaying a firm oversold/divergence reading at the moment.
On a wider perspective, weekly sellers spun off into a phase of selling from its resistance area drawn from 1.1717-1.1862. Further downside is possible according to this timeframe, as the next obvious support target does not enter the fight until demand penciled in at 1.1312-1.1445. Daily support at 1.1723 (now acting resistance) was obliterated in the shape of a near-full-bodied bearish candle yesterday, leaving price action free to drop down towards the 1.1509-1.1600 support area.
Areas of consideration:
On account of the above, weekly price suggests we may be heading for further selling, while daily movement indicates potential support may be seen off of 1.1509-1.1600. Note the top edge of this area represents the 1.16 handle on the H4 scale.
Should the market observe a H4 bullish pin-bar formation that pierces the current H4 demand and taps the 1.16 handle (effectively bringing in daily buyers), a long on the close of this candle could be an option, targeting July’s opening level at 1.1675.
Today’s data points: Spanish Flash CPI y/y; EUR CPI Flash Estimate y/y; US Core PCE Price Index m/m; Chicago PMI; US Revised UoM Consumer Sentiment.
GBP/USD:
The GBP/USD held its weaker tone on Thursday, giving way to USD strength. In the shape of a near-full-bodied daily bearish candle, H4 movement consumed August’s opening level at 1.3117 and its 1.31 handle, potentially setting the stage for a move south towards support emerging at 1.3043.
Against the backdrop of Wednesday’s hawkish Fed assessment, USD momentum gathered speed following Thursday’s robust US data. According to the latest GDP report, the US economy expanded at its fastest pace in nearly 4 years, confirmed at an annual rate of 4.2%. US Durable goods also doubled expectations, though the increase was largely due to Boeing orders.
In terms of where we stand on the higher timeframes, weekly flow is seen hovering nearby its support level at 1.3047 after failing to sustain gains beyond weekly highs of 1.3217. The daily timeframe, however, exhibits potential to press as far south as trend line support (etched from the low 1.2661).
Areas of consideration:
Intraday sellers may find a retest to the underside of 1.31/August’s opening level at 1.3117 of interest this morning (pink arrows), targeting the H4 support mentioned above at 1.3043. Technically speaking, expecting price to extend beyond 1.3043 may be ambitious, due to the level congregating with weekly support highlighted above at 1.3047.
Aggressive traders will likely look to enter at 1.31, with stop-loss orders tucked a couple of pips beyond August’s opening level, whereas conservative traders may opt to drill down to the lower timeframes and attempt to pin down a bearish candlestick signal before pulling the trigger.
Today’s data points: UK Current Account and Final GDP q/q; MPC Member Ramsden Speaks; US Core PCE Price Index m/m; Chicago PMI; US Revised UoM Consumer Sentiment.

AUD/USD:
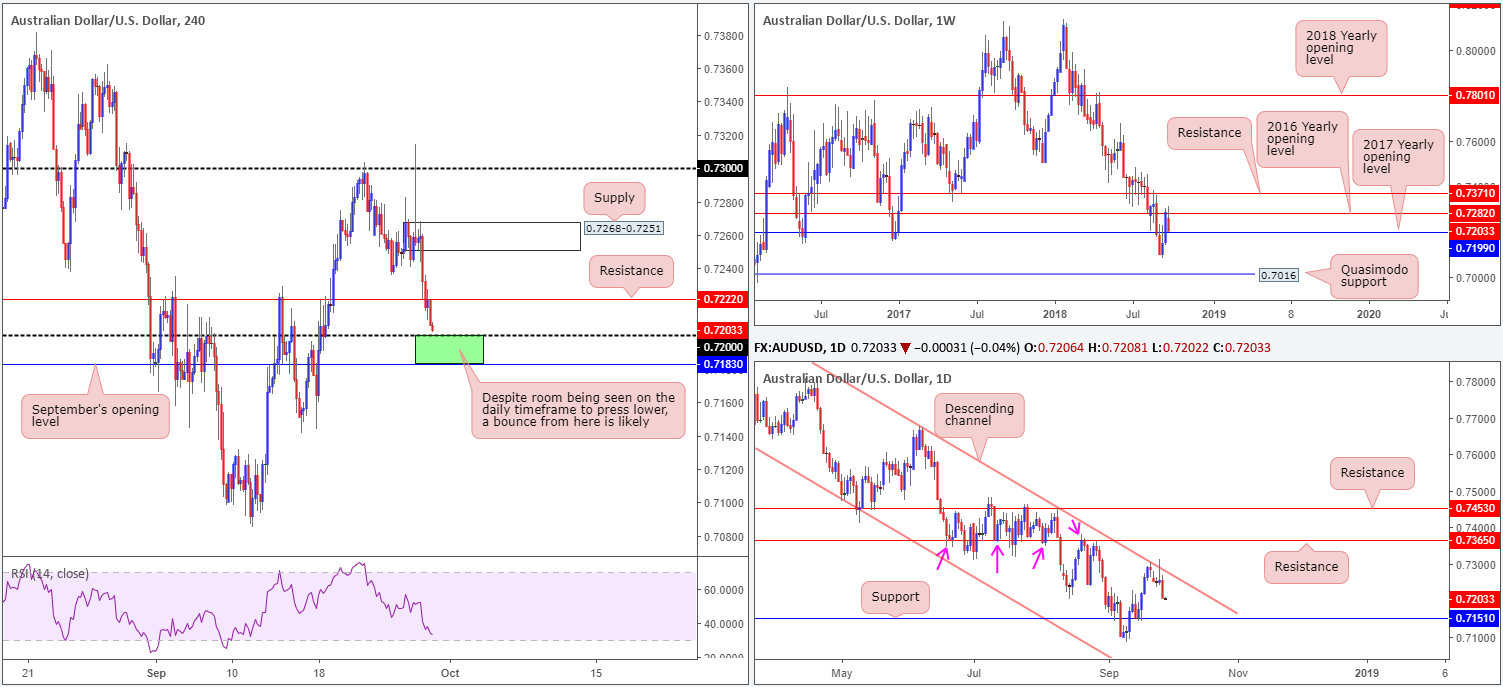
Broad-based US dollar strength weighed on the Australian dollar in recent sessions, pulling the H4 candles beyond support at 0.7222 and into striking distance of its 0.72 handle.
0.72 is an interesting number this morning. Not only because its likely watched by many in the market, it also draws attention to itself due to fusing beautifully with the 2017 yearly opening level at 0.7199 seen plotted on the weekly timeframe. Also worth noting on the H4 scale is September’s opening level plotted nearby at 0.7183, along with the RSI indicator seen fast approaching oversold territory.
While the above is likely sufficient evidence to approve 0.72 as a platform for longs today, traders still need to take into account where we are situated on the daily timeframe, which happens to communicate a bearish tone right now. Fading a long-term channel resistance (penciled in from the high of 0.8135) in the shape of a bearish pin-bar formation on Wednesday, along with yesterday’s precipitous decline, the daily chart suggests we have room to continue pressing lower until reaching support priced in at 0.7151.
Areas of consideration:
Although daily price emphasizes a southerly tone right now, the odds of the H4 candles responding from the 0.7183/0.72 (green) zone today are high, in our humble view. Conservative traders may wish to wait and see if H4 price can chalk up a bullish candlestick formation before pulling trigger. The initial upside target from here falls in around 0.7222: the H4 support-turned resistance, followed by H4 supply at 0.7268-0.7251.
Today’s data points: US Core PCE Price Index m/m; Chicago PMI; US Revised UoM Consumer Sentiment.
USD/JPY:
Across the board, the market observed a healthy USD bid enter the fray, lifting the USD/JPY to a fresh multi-month high of 113.46. Trading within a cat’s whisker of yearly highs, weekly movement is also seen making a run for supply at 115.50-113.85. Note this area boasts notable history, capping upside on a number occasions throughout 2017.
A closer look at price action brings us to the daily timeframe, which, as you can see, remains trading within the walls of supply fixed at 113.91-113.09 (glued to the underside of the aforementioned weekly supply zone). In terms of H4 price action, however, traders witnessed the 113 handle and nearby resistance at 113.14 (now acting support) suffer a blow to the mid-section. This brought in a double-top resistance at 113.38, which, for the time being, is holding firm. Should the market push for higher ground today, it may be worth penciling in 113.69 (a Quasimodo resistance not visible on the screen) as the next upside target on this scale.
Areas of consideration:
Given we’re trading within daily supply at the moment, this may be enough force to drag H4 price lower from the double-top resistance at 113.38 to support at 113.14 today. Although this may interest some intraday traders this morning, do bear in mind weekly price still shows room to advance until 113.85: the underside of supply.
Until we connect with weekly supply, neither a long nor short seems attractive at the moment.
Today’s data points: US Core PCE Price Index m/m; Chicago PMI; US Revised UoM Consumer Sentiment.

USD/CAD:
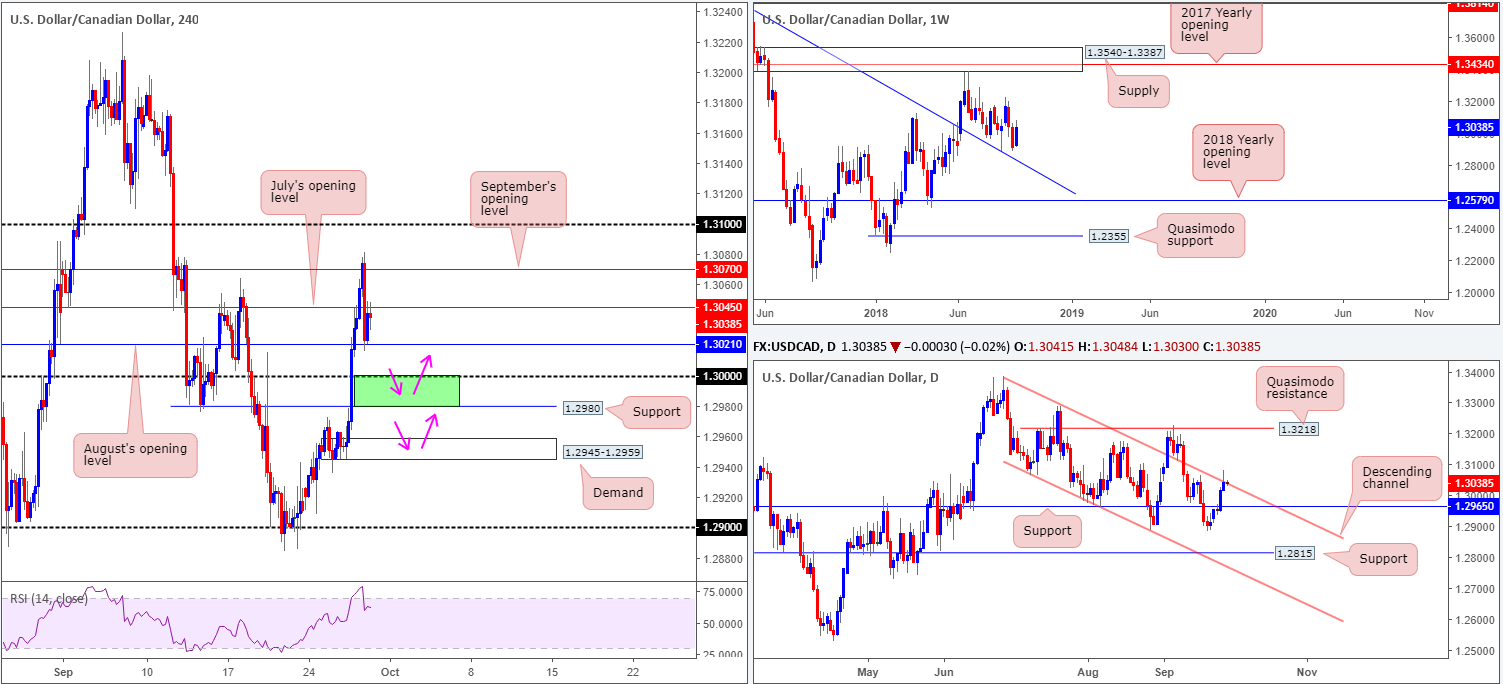
During the course of yesterday’s movement, the USD/CAD rose to a two-week high of 1.3081 – touching gloves with September’s opening level at 1.3070 – going into US hours. Unfortunately, the buyers were unable to maintain this upside presence, pulling back to August’s opening level at 1.3021 into the close.
Downside pressure was likely influenced by the fact daily price is seen engaging with a notable channel resistance (extended from the high 1.3386). In the event further selling takes place on this scale, keep eyeballs on support drawn from 1.2965.
Areas of consideration:
- The H4 area marked in green at 1.2980/1.30 is stand out for potential longs today. A H4 bullish pin-bar formation that pierces through 1.30 and enters the green zone would likely drawn in intraday buyers towards 1.3021 (the underside of August’s opening level).
- Another area worthy of consideration for longs is the H4 demand at 1.2945-1.2959, due to the fact it merges closely with daily support notched in at 1.2965.
Today’s data points: US Core PCE Price Index m/m; Chicago PMI; US Revised UoM Consumer Sentiment; CAD GDP m/m; CAD RMPI m/m.
USD/CHF:
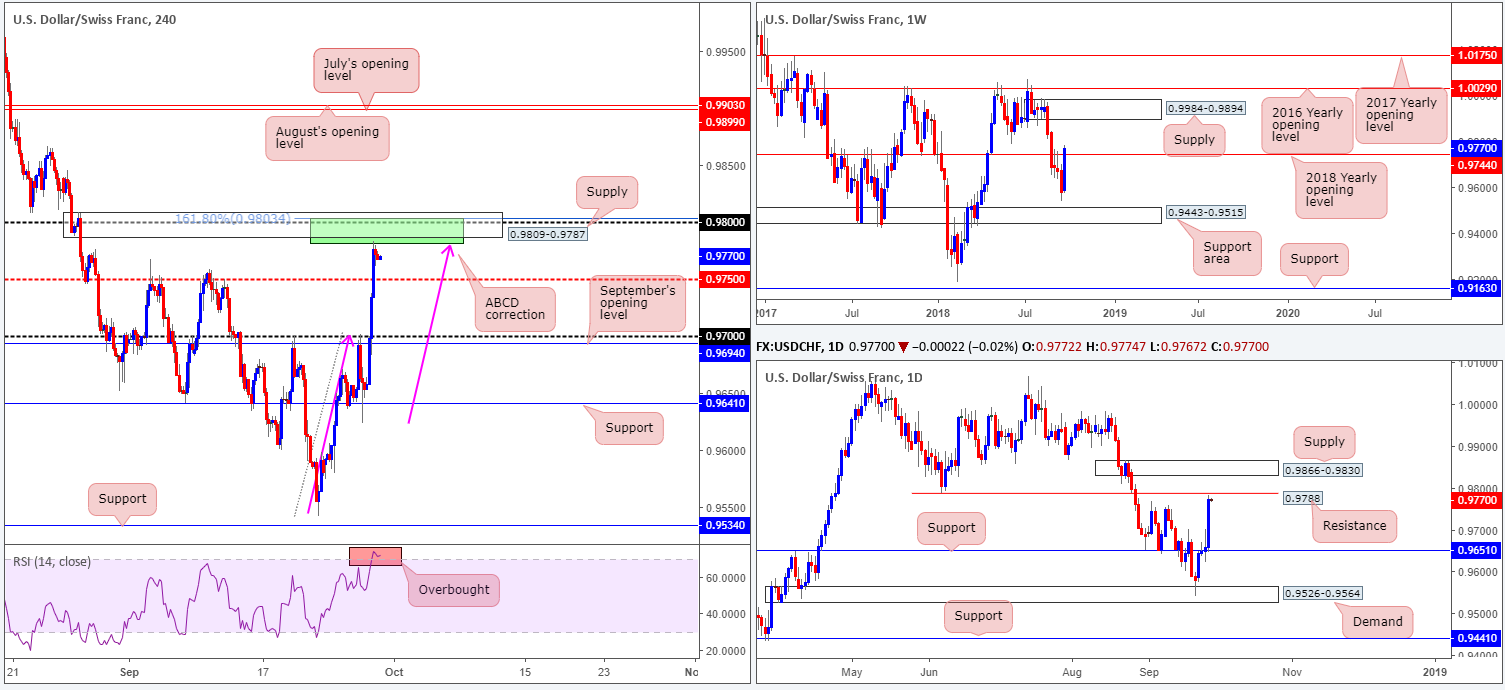
The greenback found broad support on Thursday as the US economy expanded at its fastest pace in nearly 4 years, confirmed at an annual rate of 4.2%. US Durable goods also doubled expectations, though the increase was largely due to Boeing orders.
Registering its fourth consecutive daily gain, weekly price finally conquered its 2018 yearly opening level at 0.9744 yesterday. In the event of a weekly close forming above this barrier, traders could witness a surge towards supply drawn from 0.9984-0.9894.
Before weekly buyers can reach the noted supply, however, a daily swing resistance positioned at 0.9788 will need to be overthrown, as will the nearby daily supply plotted at 0.9866-0.9830. A closer look at price action brings forth a notable H4 supply coming in at 0.9809-0.9787. What’s appealing about this zone is its local confluence: a H4 ABCD correction that terminates between 0.9803 (161.8% Fib ext. point) and 0.9779, along with the round number 0.98. As you can see, the H4 candles have already began showing signs of weakening off this area, so a retest of 0.9750 is certainly not out of the question this morning.
Areas of consideration:
Ultimately, we’d like to witness the daily swing resistance at 0.9788 enter the play before drawing attention to possible shorts from the H4 supply region at 0.9809-0.9787. Once, or indeed if, the daily resistance enters the fight, a sell, with stop-loss orders tucked a couple of pips above the H4 supply, could be an option, targeting 0.9750 as the initial take-profit target.
Today’s data points: US Core PCE Price Index m/m; Chicago PMI; US Revised UoM Consumer Sentiment; KOF Economic Barometer.
Dow Jones Industrial Average:
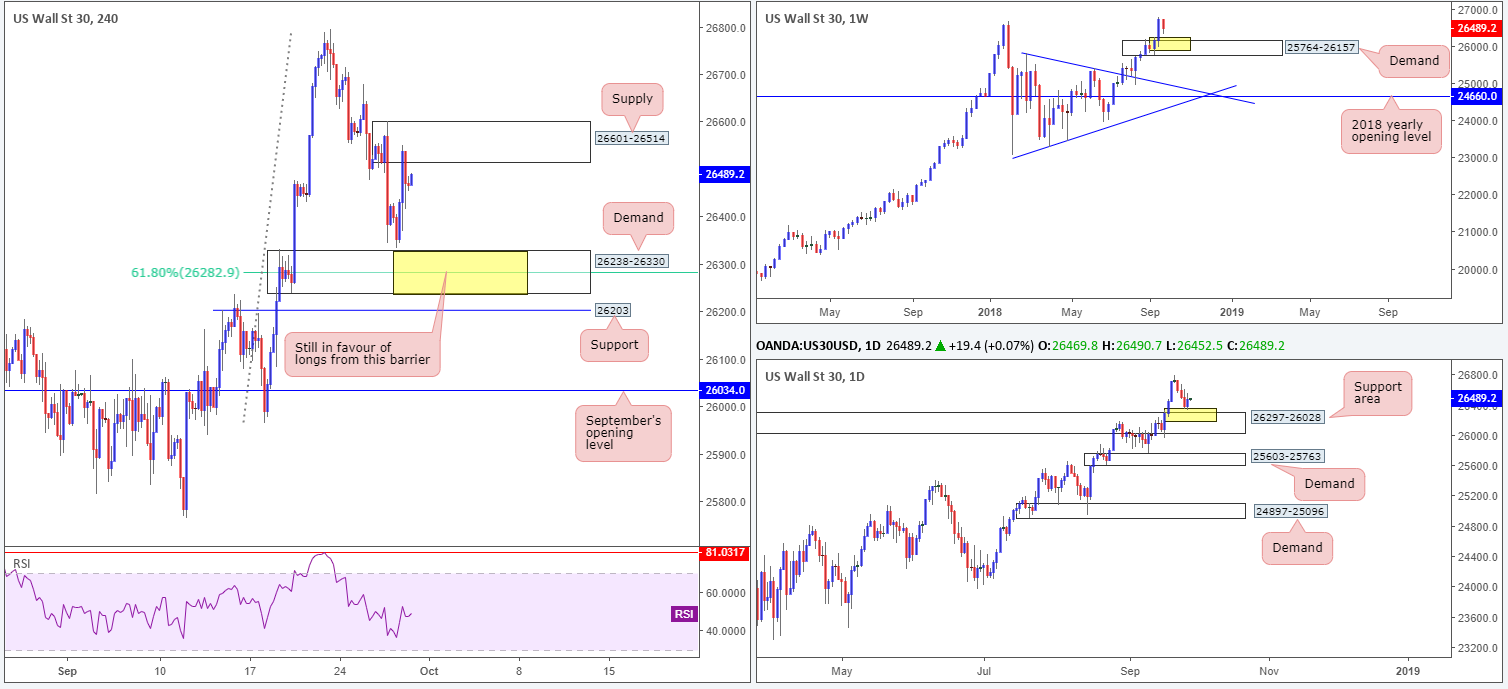
On the back of improved market sentiment amid upbeat US macroeconomic data, US equities advanced higher and broke a three-day bearish phase.
H4 price concluded Thursday’s session touching gloves with a H4 supply zone at 26601-26514, after coming within a stone’s throw away from demand priced in at 26238-26330 (merges with 61.8% H4 Fib support at 26282). Between the two zones, the noted demand carries extra weight, in our humble view. Aside from housing a Fibonacci support level, the area is positioned around the top edge of a daily support area marked at 26297-26028, which itself is reinforced by a weekly demand area visible from 25764-26157.
Therefore, the fact H4 price is seen engaging with supply right now should not deter traders from considering a long from the current H4 demand base. In fact, the only caveat we see to buying this zone is the H4 support seen below it at 26203 may prompt a fakeout play.
Areas of consideration:
Keeping it simple this morning, we are still in favour of longs from the H4 demand mentioned above at 26238-26294. Backed by higher-timeframe demands, along with housing a Fib support, this area is likely to produce something to the upside. Due to the threat of a potential fakeout to H4 support at 26203, stop-loss orders would be best positioned beneath this hurdle.
Today’s data points: US Core PCE Price Index m/m; Chicago PMI; US Revised UoM Consumer Sentiment.
XAU/USD (Gold)
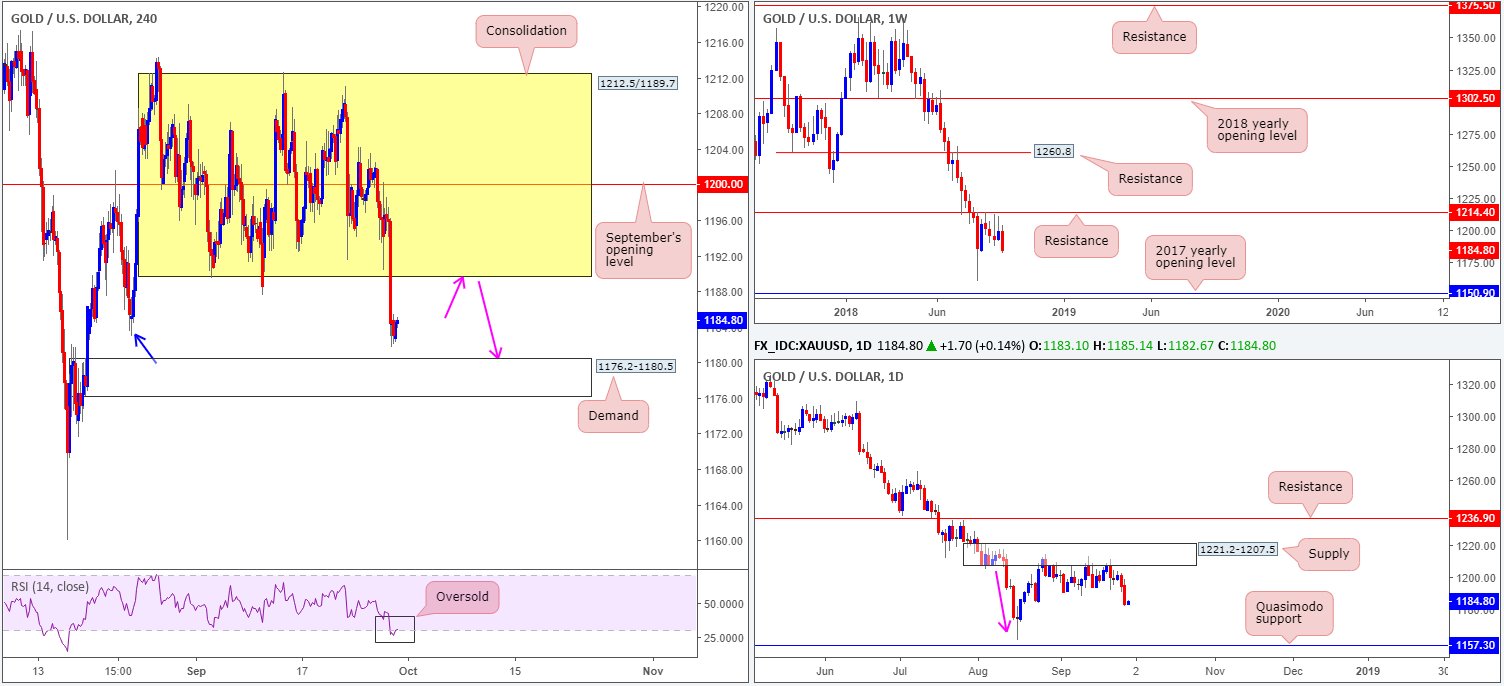
As anticipated, bullion eventually pressed for lower ground on Thursday, breaking the current H4 range between 1212.5/1189.7 (houses September’s opening level at 1200.0) to the downside.
Technicians who follow multiple timeframes likely saw the break lower on the horizon. Weekly price is making firm ground beneath a key resistance level coming in at 1214.4. Further downside from this point could eventually stretch as far south as the 2017 yearly opening level at 1150.9. Daily action was also seen engaging with the underside of a nice-looking supply zone at 1221.2-1207.5. Aside from the base displaying attractive downside momentum (see pink arrow), this area could also be considered the ‘decision point’ to print 2018 yearly lows of 1160.3.
With stop-loss orders likely tripped beyond the August 24 low 1184.4 (blue arrow), and H4 price yet to challenge demand at 1176.2-1180.5, a retest play to the underside of the recently broken H4 range (1189.7) could be an option today (pink arrows).
Areas of consideration:
A retest of 1189.7 today, as discussed above, is certainly a consideration. Traders are advised to wait and see if H4 price prints a bearish candlestick formation (stops and entry dictated by this structure) at the retest before considering a position short, since this will help avoid falling victim to fakeouts. The first take-profit target in view is the H4 demand base mentioned above at 1176.2-1180.5.
The use of the site is agreement that the site is for informational and educational purposes only and does not constitute advice in any form in the furtherance of any trade or trading decisions.
The accuracy, completeness and timeliness of the information contained on this site cannot be guaranteed. IC Markets does not warranty, guarantee or make any representations, or assume any liability with regard to financial results based on the use of the information in the site.
News, views, opinions, recommendations and other information obtained from sources outside of www.icmarkets.com.au, used in this site are believed to be reliable, but we cannot guarantee their accuracy or completeness. All such information is subject to change at any time without notice. IC Markets assumes no responsibility for the content of any linked site. The fact that such links may exist does not indicate approval or endorsement of any material contained on any linked site.
IC Markets is not liable for any harm caused by the transmission, through accessing the services or information on this site, of a computer virus, or other computer code or programming device that might be used to access, delete, damage, disable, disrupt or otherwise impede in any manner, the operation of the site or of any user’s software, hardware, data or property.


