
A note on lower timeframe confirming price action…
Waiting for lower timeframe confirmation is our main tool to confirm strength within higher timeframe zones, andhas really been the key to our trading success. It takes a little time to understand the subtle nuances, however, as each trade is never the same, but once you master the rhythm so to speak, you will be saved from countless unnecessary losing trades. The following is a list of what we look for:
- A break/retest of supply or demand dependent on which way you’re trading.
- A trendline break/retest.
- Buying/selling tails – essentially we look for a cluster of very obvious spikes off of lower timeframe support and resistance levels within the higher timeframe zone.
- Candlestick patterns. We tend to only stick with pin bars and engulfing bars as these have proven to be the most effective.
EUR/USD:
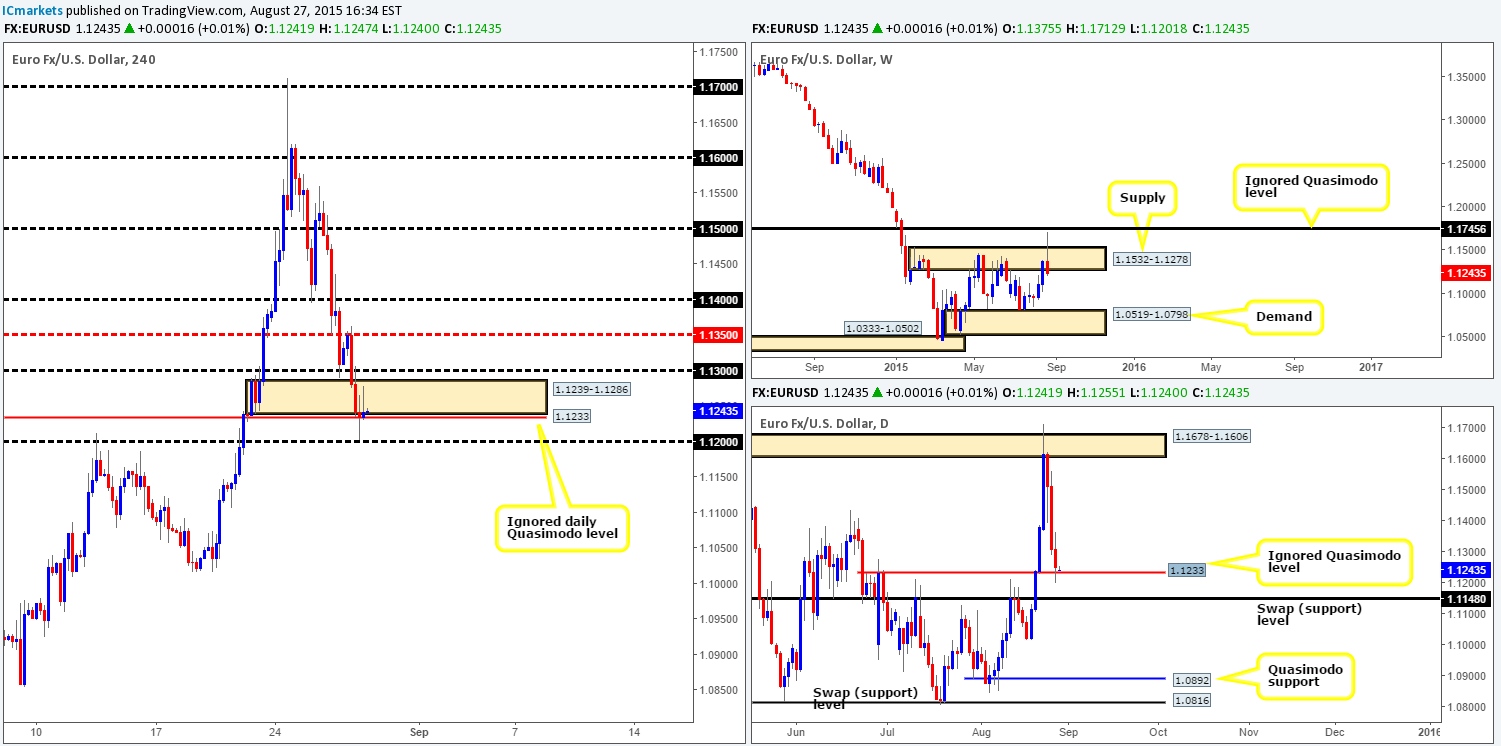
During the course of yesterday’s sessions, the EUR/USD tumbled lower for a third consecutive day losing close to 70 pips into the close 1.1241. Psychological support 1.1300 attempted to hold ground early on in the sessions, but found the mid-level number 1.1350 too strong to overcome. Consequently, this sent the EUR piling lower surpassing 1.1300 and faking below both 4hr demand at 1.1239-1.1286, and the ignored daily Quasimodo level at1.1233 (positioned just below the aforementioned 4hr demand area).
For those who read our previous report http://www.icmarkets.com/blog/thursday-27th-august-remain-vigilant-around-midday-gmt-time-today-us-data-set-to-take-the-limelight/ you may recall us mentioning to watch for this fakeout. Saying that though, we did not expect the fakeout to be quite so deep – price missed the round-number support 1.1200 by a pip!
So, with the market behaving as expected for the time being, where do we go from here? Given that price is currently holding above the ignored daily Quasimodo level, and on top of that a 4hr inverted bullish pin bar candle has just printed, we feel this may encourage further buying today. As we mentioned in yesterday’s analysis though, lower timeframe confirmation will be needed at 1.1233, simply because the path south on the weekly timeframe looks clean down to weekly demand at 1.0519-1.0798.
Should this long trade come to fruition today, however, partial profits will be quickly taken at 1.1300. It would only be once/if price closes above and retests this number as support, would we then feel safe to move our stop to breakeven and maybe then leave our trade open over the weekend.
Levels to watch/live orders:
- Buys:1.1233 [Tentative – confirmation required] (Stop loss: dependent on where one confirms this level).
- Sells:Flat (Stop loss: N/A).
GBP/USD:
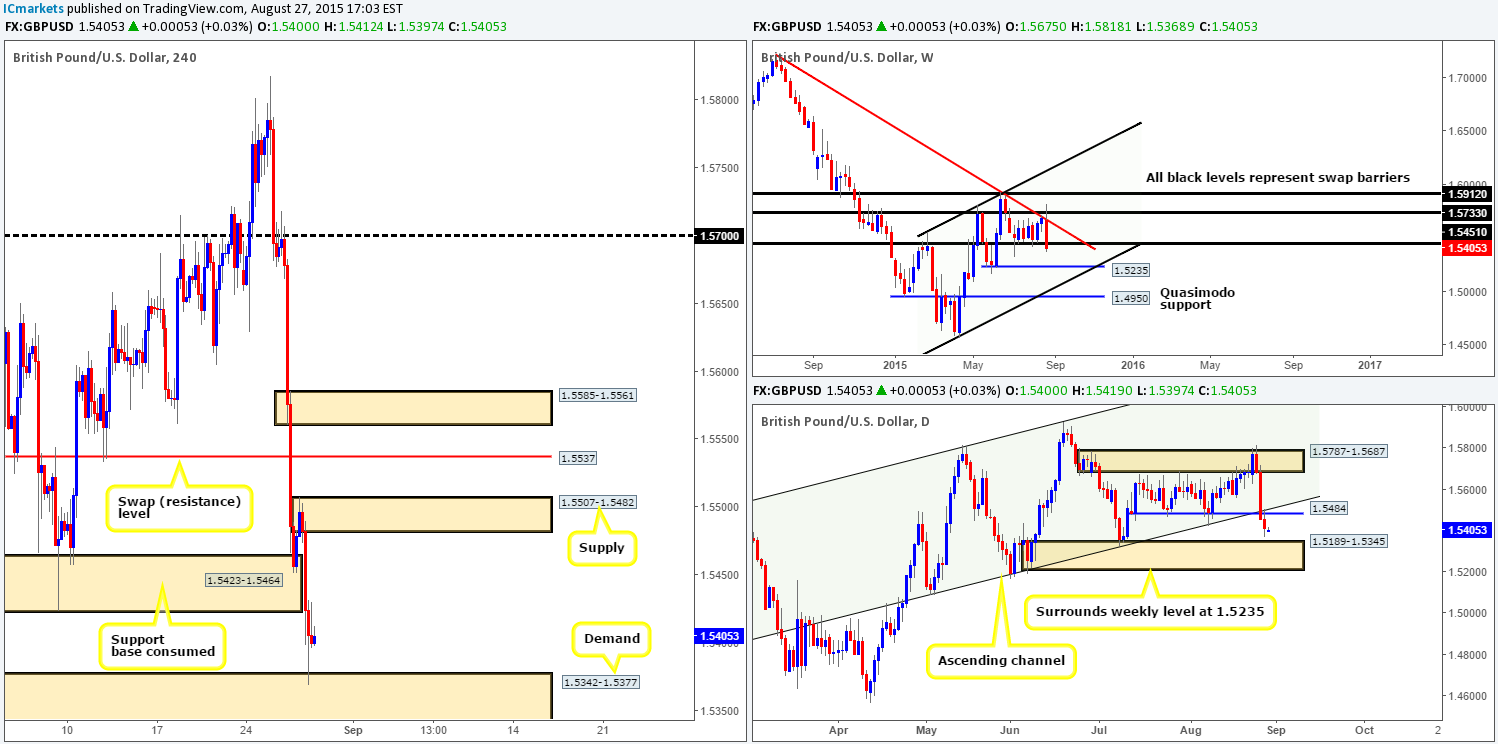
Beginning with the weekly timeframe this morning, we can see that price remains trading below the weekly swap (support) level at 1.5451. In the event that Cable closes below this number this week, the path south would, as far as we can see, be free down to a weekly support level coming in at 1.5235. Turning our attention to daily chart, shows that following Wednesday’s close below daily support at 1.5484/daily ascending channel support (1.5089), price retested these barriers and headed further south.This, like the EUR/USD, is the third consecutive drop the GBP has seen this week. The next downside target to have on your watchlists from here comes in at 1.5189-1.5345 – a daily demand area which surrounds the aforementioned weekly support level.
The 4hr timeframe, however, reveals that even though the bulls showed strength from the 4hr support base at 1.5423-1.5464 yesterday, this did not encourage further buying and Cable plummeted lower into a 4hr demand at 1.5342-1.5377.
In view of price currently trading around a 4hr demand area right now, would we consider this a stable enough platform to buy from? In our opinion, there isn’t really anything stopping price from rallying higher from here up to the 4hr supply zone at 1.5507-1.5482. However, one has to be prepared for the possibility that price may drive lower yet to connect with bids around the daily demand area mentioned above at 1.5189-1.5345. That being the case, we are not pulling the trigger just yet, we’d rather wait to see if does indeed drive lower before considering longs.
Levels to watch/ live orders:
- Buys: Keep a close eye on 1.5342-1.5377 – expect a fakeout lower before considering buys.
- Sells: Flat (Stop loss: N/A).
AUD/USD:
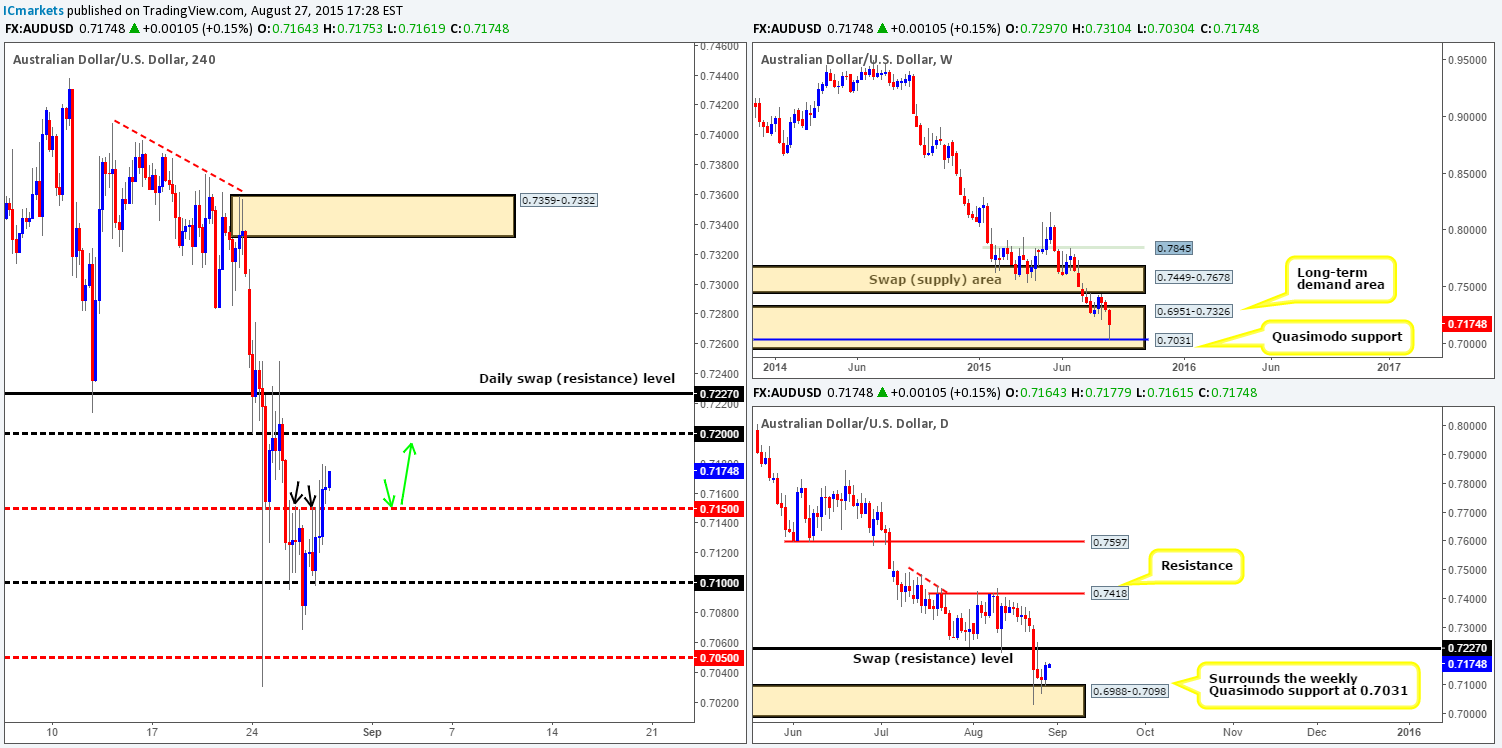
The AUD/USD pair, as you can see, spent the European/London morning session bouncing between 0.7100/0.7150. It was only once the U.S opened for business did we see a heavy round of bids hit the line, consequently closing above 0.7150 and reaching highs of 0.7180 on the day.
Now, considering only the 4hr timeframe for the minute, we currently see a possible intraday long opportunity forming. The mid-level number 0.7150 is clearly a respected intraday level right now, and a retest of this number today could provide us a platform in which to look for long opportunities into this market (green arrows). Supporting this 4hr buy zone, there’s agreement being seen across the board regarding the higher timeframe structures. Both weekly and daily action show price is firmly situated within demand (weekly: 0.7031/daily: 0.6988-0.7098).
But, there is always a BUT! With mid-level numbers being prone to fakeouts and the fact that pair is still heavily trending south at the moment, lower timeframe buying confirmation will be required before we’d consider risking capital on this idea. Targets, should this trade come to fruition, fall in at 0.7200, followed closely by the daily swap (resistance) level coming in at 0.7227. This gives us an overall profit target of nearly eighty pips.
Levels to watch/ live orders:
- Buys: 0.7150 [Tentative – confirmation required] (Stop loss: dependent on where one confirms this level).
- Sells: Flat (Stop loss: N/A).
USD/JPY:
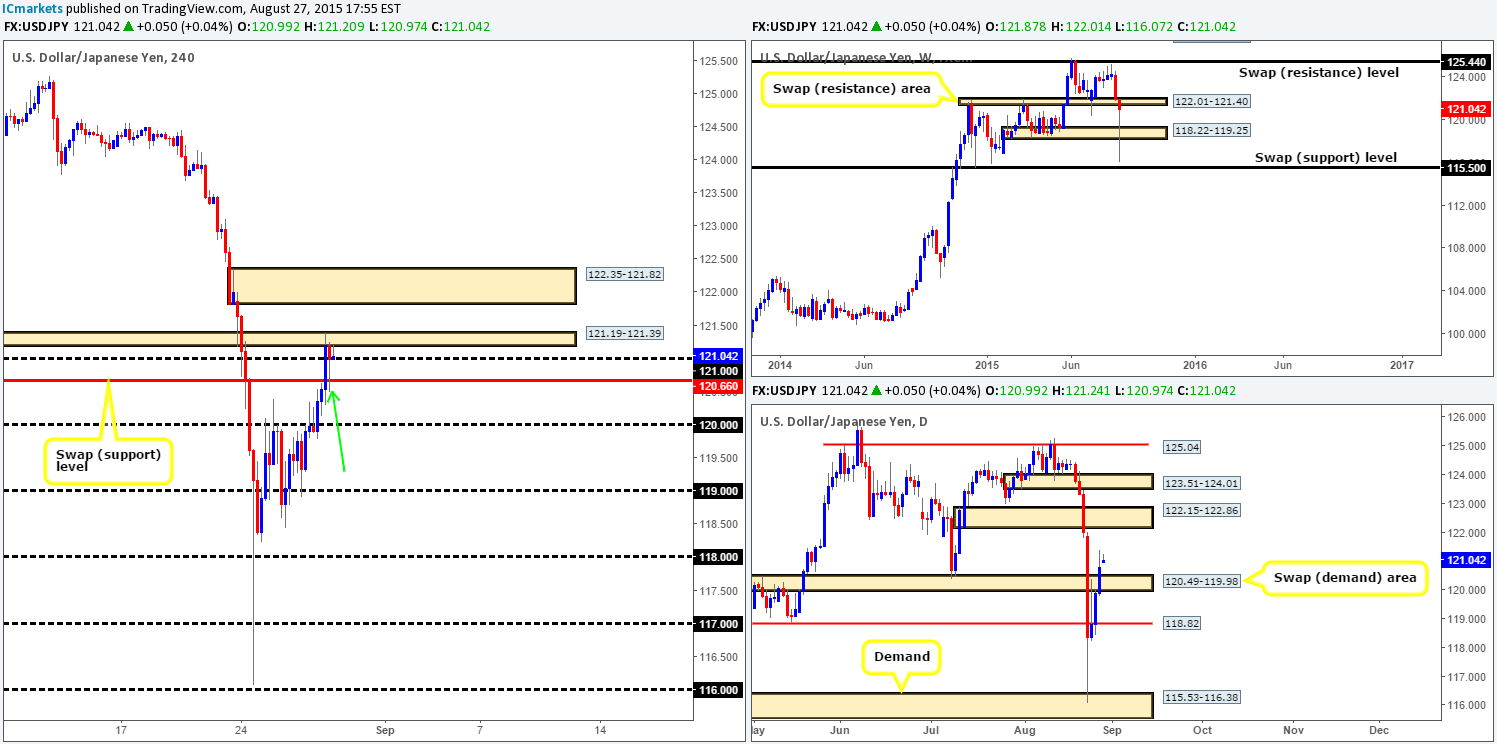
Working our way from the top-down this morning, the weekly timeframe shows one very impressive buying tail printing at the moment, stretching a little over 500 pips at the time of writing! Scaling down to the daily timeframe, we can see that price has recently chalked up a third consecutive bull candle, consequently closing above the daily swap (supply) area at 120.49-119.98. This, on its own, could suggest further upside today/next week in the direction of another daily swap (supply) area at 122.15-122.86.
Next up is the 4hr timeframe. From this angle, the recent buying pushed prices above both a 4hr swap (resistance) level at 120.66 and the round-number 121.00, and soon after into a small 4hr swap (supply) zone at 121.19-121.39. At first glance we saw little room for prices to move. However, on a second look, the majority of offers are likely consumed around both 121.00 and 121.19-121.39 now, thus potentially leaving the path north clear up until at least 4hr supply at 122.35-121.82. In addition to this, the recent spike lower seen marked with a green arrow at 120.50 confirmed, at least to us, that the 4hr resistance –turned support level at 120.66 is well-bid.
Therefore, given the points made above, here is what we have noted so far:
- Watch for price to retest 120.66 once more.
- Watch the lower timeframe action here – if confirmation is seen, look to jump in long targeting 121.73 just below the aforementioned 4hr supply zone.
- However, be prepared for a deeper fakeout below 120.66 this time, since price may want to tag in bids sitting at the daily swap (demand) zone at 120.49-119.98.
Levels to watch/ live orders:
- Buys: 120.66 [Tentative – confirmation required] (Stop loss: dependent on where one confirms this level).
- Sells: Flat (Stop loss: N/A).
USD/CAD:
Recent action on the USD/CAD shows that offers were clearly too strong around the underside of 1.3300 yesterday. Price fell sharply breaking below both 1.3250 and 1.3200. It was only once we saw the market connect with the 4hr swap (demand) area at 1.3180-1.3140 did the price really begin to stabilize.
In view of the USD/JPY now being tightly capped between the current 4hr zone and round-number resistance1.3200, where do we see this unit heading today? Well, with price now effectively trading around both weekly and daily demand (1.3128/1.3246-1.3177), the Loonie may breach 1.3200 and head higher. If 1.3200 is broken and then retested, we may be tempted to take a long from here, targeting 1.3250 if, of course, lower timeframe confirmation is spotted on the retest. However, seeing as the weekly level 1.3128 is positioned below the current 4hr swap (demand) zone, there is a chance price may fake lower and connect with the 4hr ascending channel support taken from the low 1.2536. This is somewhere we’d also be keen on looking for lower timeframe buying confirmation since this upper ascending barrier has been respected time and time again.
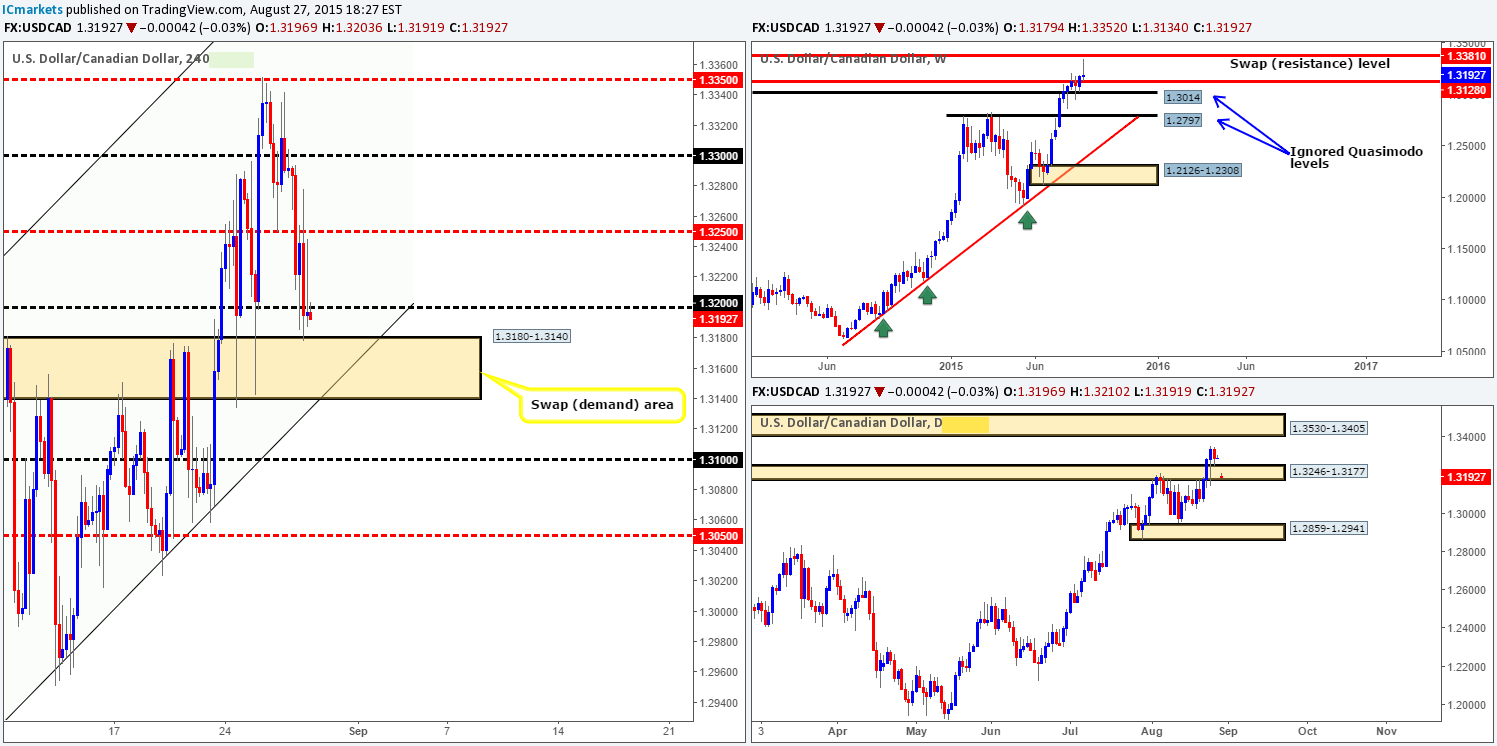
Levels to watch/ live orders:
- Buys: Watch for offers around 1.3200 to be consumed and then look to trade any retest seen at this number (confirmation required) Watch the lower ascending channel support (1.2536) for potential buy trades today.
- Sells:Flat (Stop loss: N/A).
USD/CHF: (Slightly revised)
This morning’s analysis will kick-off with a look at the weekly timeframe. From this viewpoint, price clearly found a set of strong bids around weekly demand coming in at 0.9149-0.9326, which, as you can see, is pushing prices in the direction of a weekly swap (resistance) level at 0.9796. As a result, this also forced price above a daily swap (supply) zone at 0.9597-0.9502 yesterday, potentially clearing the path north for further buying up to 0.9712 – a daily swap (resistance) level.
On to the 4hr timeframe, we can see that the recent advance cleanly took out not only a 4hr swap (supply) zone at 0.9547-0.9582, but also round-number resistance at 0.9600. It was only once price shook hands with 0.9166 did we see things begin to calm down.
So, given that there is room for prices to more north on both the weekly and daily timeframes at the moment (see above), we feel this market will at least try for 0.9700 today. As such, If price simply jumps above 0.9166 and heads for 0.9700, we’ll remain flat with no action taken due to there being little room to profit. In the event that selling is seen from this level back down to 0.9600, however, we’d being looking for lower timeframe buy entries into this market. Our rationale behind this approach comes from 0.9600 merging nicely with the upper limit of the daily swap (supply – turned demand) area at 0.9597-0.9502, and on the assumption that offers around 0.9166 are now consumed.
Therefore, to sum up, if price successfully retests 0.9600 and shows some form of lower timeframe buying confirmation, we’ll jump in long, targeting 0.9700. However, dependent on the time of day, and how price reacts to 0.9166, we may close the position here and call it a week. It will be interesting to see how this plays out.
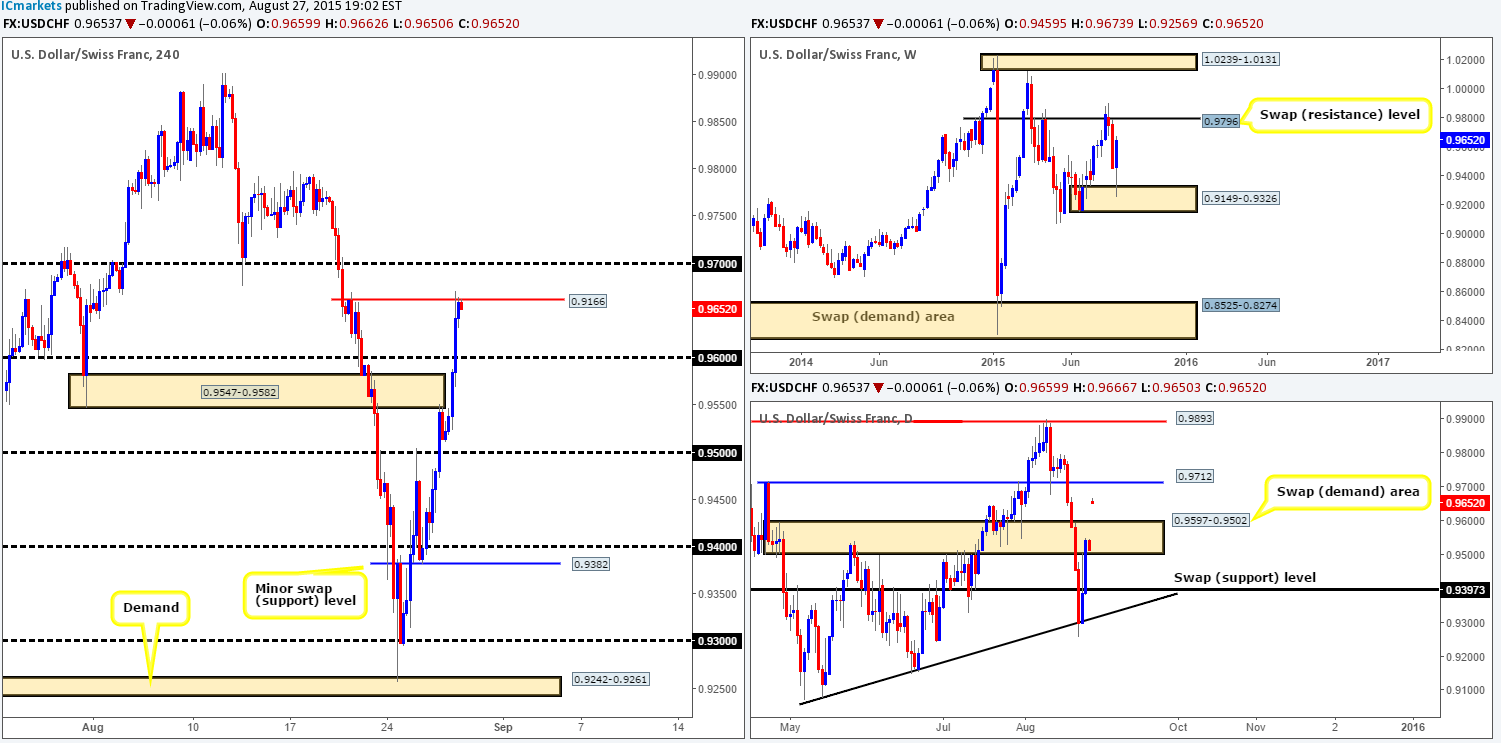
Levels to watch/ live orders:
- Buys: 0.9600 [Tentative – confirmation required] (Stop loss: dependent on where one confirms this level).
- Sells:Flat (Stop loss: N/A).
DOW 30:
Early on in yesterday’s trade, we saw a conservative wave of bids hit the line. This consequently took out offers sitting around both a 4hr swap (supply) zone at 16285-16386 and also a 4hr swap (resistance) level at 16475. Following this, price retested unfilled bids sitting betweenthe above said barriers on three occasions before reaching highs of 16690 on the day.
For those who read our previous report on the DOW http://www.icmarkets.com/blog/thursday-27th-august-remain-vigilant-around-midday-gmt-time-today-us-data-set-to-take-the-limelight/ you may recall us highlighting 16475 as an area to watch for longs should price break higher. Well done to any of our readers who locked in some green pips from this move!
With the weekly timeframe in the process of printing a monster-sized bullish pin-bar candle off of a weekly demand at 14717-15245, and the daily timeframe currently showing price trading above a daily swap (supply) area at 16459-16632, where is price heading to next? Well, along with the current higher timeframe support in play, action on both the weekly and daily timeframes also shows room for price to continue appreciating up to 17135/16895-17005. As such, our team naturally favors longs over shorts for now.
Therefore, our prime focus for today once again will be on 16475 (see green arrows). Ideally, we’re looking for price to retest this number as support before hitting the 4hr supply zone above at 16943-16827, as this would be our take-profit zone should a confirmed setup be seen at 16475.

Levels to watch/ live orders:
- Buys: 16475 [Tentative – confirmation required] (Stop loss: dependent on where one confirms this level).
- Sells: Flat (Stop loss: N/A).
XAU/USD: (Gold)
Beginning with the weekly timeframe this morning, we can see that price remains trading just beneath the weekly swap (support) level at 1130.1. However, looking at the daily chart shows us that price also remains positioned at the top-side of demand coming in at 1109.4-1122.7, which is conveniently located just below the aforementioned weekly level – anyone smelling a fakeout brewing here???
Now, due to the somewhat lackluster performance seen during yesterday’s trade, price is still seen lurking just above a 4hr demand area at 1109.4-1116.1. With this, we’re ultimately still looking for this market to drop lower and fake below both Wednesday and Thursday’s lows 1118.2/1117.6 and to connect with bids around the 4hr demand. The push below these lows will likely be attractive to well-funded traders as they know a lot of sell stops will be lurking just below these numbers – a fantastic pool of liquidity to buy into!
That being the case, this 4hr demand area remains, in our opinion, a highly confluent platform in which to look for confirmed buying opportunities into this market today.
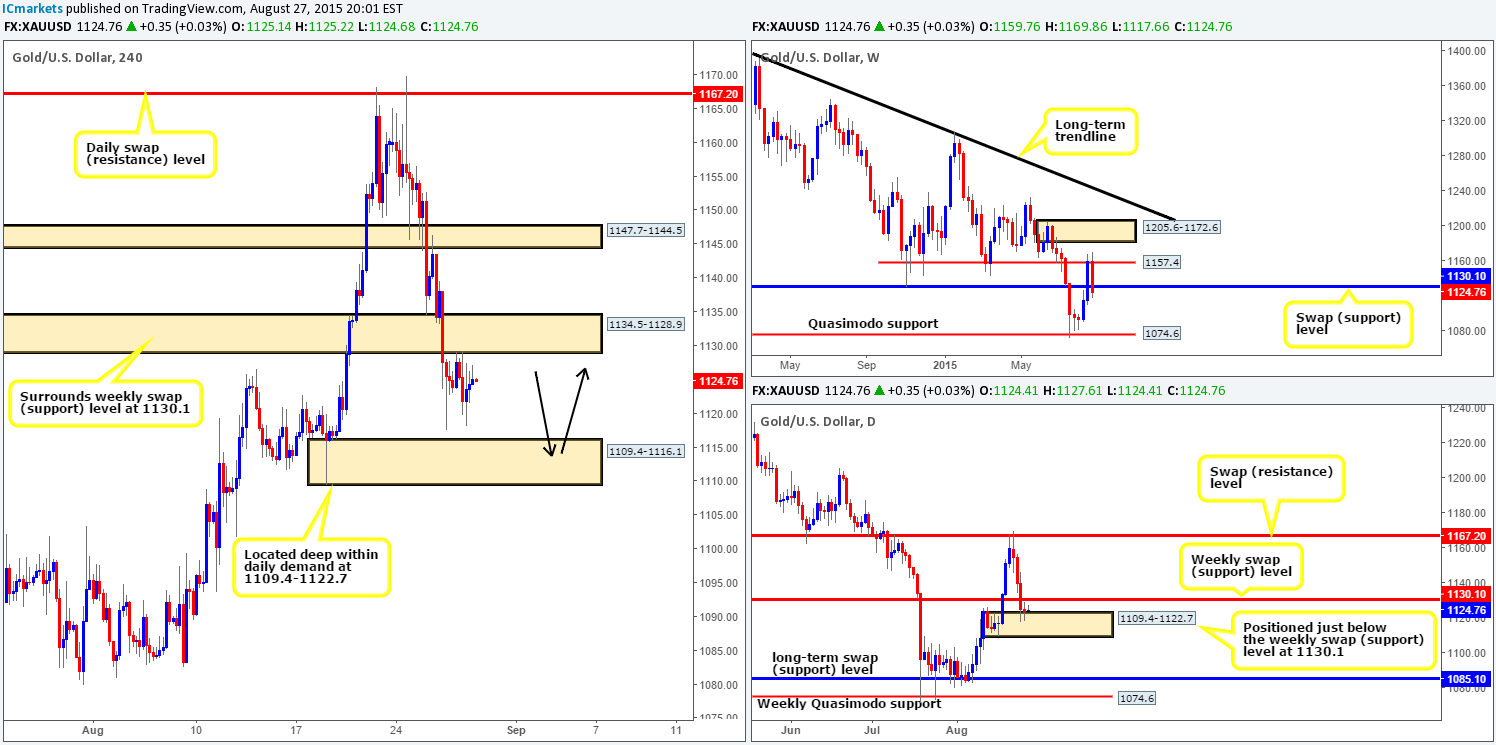
Levels to watch/ live orders:
- Buys: 1109.4-1116.1 [Tentative – confirmation required] (Stop loss: 1108.5).
- Sells: Flat (Stop loss: N/A).


