
A note on lower timeframe confirming price action…
Waiting for lower timeframe confirmation is our main tool to confirm strength within higher timeframe zones, and has really been the key to our trading success. It takes a little time to understand the subtle nuances, however, as each trade is never the same, but once you master the rhythm so to speak, you will be saved from countless unnecessary losing trades. The following is a list of what we look for:
- A break/retest of supply or demand dependent on which way you’re trading.
- A trendline break/retest.
- Buying/selling tails/wicks – essentially we look for a cluster of very obvious spikes off of lower timeframe support and resistance levels within the higher timeframe zone.
- Candlestick patterns. We tend to only stick with pin bars and engulfing bars as these have proven to be the most effective.
We search for lower timeframe confirmation between the M15 the H1 timeframes, since most of our higher-timeframe areas begin with the H4. Stops are usually placed 5-10 pips beyond confirming structures.
EUR/USD:
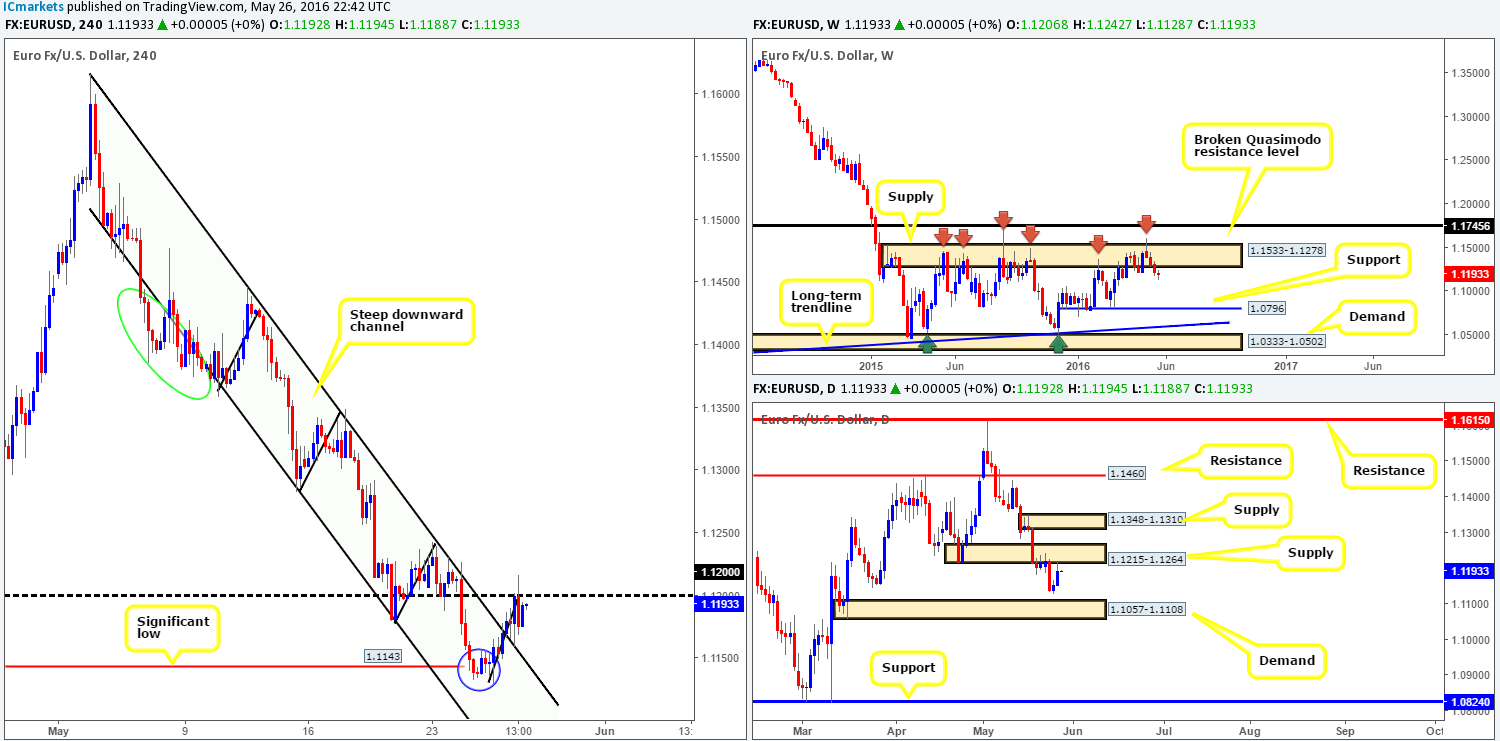
Despite better-than-expected U.S. data, the EUR rallied to highs of 1.1216 yesterday, but struggled to close above the 1.12 handle. Based on this recent movement, we see the following on the H4 chart:
- The depth of each pullback has retained a certain amount of symmetry (see black lines), and the most recent pullback has, judging by past retracements, now reached its limit. Therefore, a close above 1.12 (effectively breaking this symmetry) could spark further buying in this market.
- The breakout above the H4 channel resistance (1.1616) is not really a concern of ours since a breakout of the H4 channel support (1.1500) was seen between the 5th and 9th of May (green circle), and price, as can be seen from the chart, continued to honor the channel boundaries following the break.
From a higher-timeframe perspective, however, our team is bearish. The weekly chart, as we’ve mentioned several times already, shows that ever since price whipsawed through the upper boundary of a major weekly supply zone at 1.1533-1.1278 the bears have been in control. Furthermore, the next downside target, as we see it, does not come into view until weekly support seen at 1.0796. Along the same vein, we can see daily action now flirting with the underside of a daily supply base drawn from 1.1215-1.1264, which saw a small end-of-day correction yesterday.
Our suggestions: Technically, we would be surprised to see this pair close above 1.12 today. To that end, our prime focus will be on looking to short this number with the aid of a lower timeframe confirming setup (please see the top of this report for ideas on confirmation). Should all go to plan, partial profits would be liquated around minor H4 demand seen marked with a blue circle at 1.1128-1.1146, and the remainder will be left in the market to run until 1.1057-1.1096 – a H4 demand base that sits within the extremes of a daily demand area at 1.1057-1.1108 (the next downside target on the daily timeframe).
Levels to watch/live orders:
- Buys: Flat (Stop loss: N/A).
- Sells: 1.12 region [Tentative – confirmation required] (Stop loss: dependent on where one confirms this area).
GBP/USD:
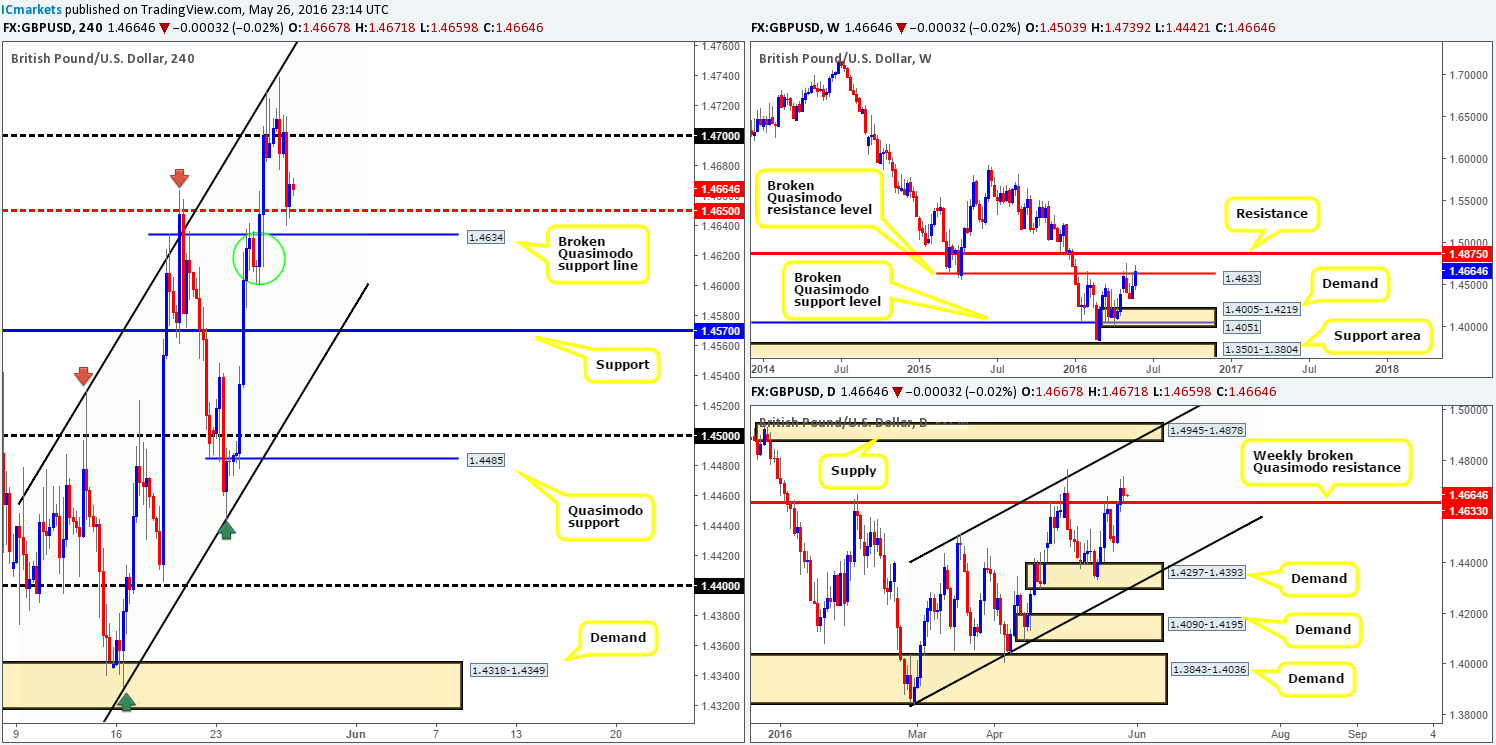
In recent trading, price sold-off beautifully from the 1.47 handle bringing this market into a H4 mid-way support barrier seen at 1.4650, which, as you can see, has so far held firm. Through the simple lens of a technical trader, it is uncertain whether this barrier will continue to hold in our opinion.
Following the daily close above the weekly broken Quasimodo barrier (BQM) at 1.4633, price has formed somewhat of a daily indecision candle with a strong bearish edge to it. As we mentioned in our previous report, it may be worth waiting for the weekly candle to close shop before presuming that this weekly line has indeed been consumed. For example, a weekly close above this boundary would, in our book, confirm consumption, and a close lower could suggest a sell-off next week.
Initially, we were looking to buy from the H4 demand formed on the break of the H4 Quasimodo line (1.4634) at 1.4601-1.4631 (green circle), since this was also the H4 decision-point area which saw price push above the weekly BQM level. However, due to the recent daily indecision candle, our team is not so confident in this H4 demand any more.
Our suggestions: Given the uncertainty being seen around the current weekly BQM level, our team has humbly decided to take a step back here and remain flat.
Levels to watch/live orders:
- Buys: Flat (Stop loss: N/A).
- Sells: Flat (Stop loss: N/A).
AUD/USD:
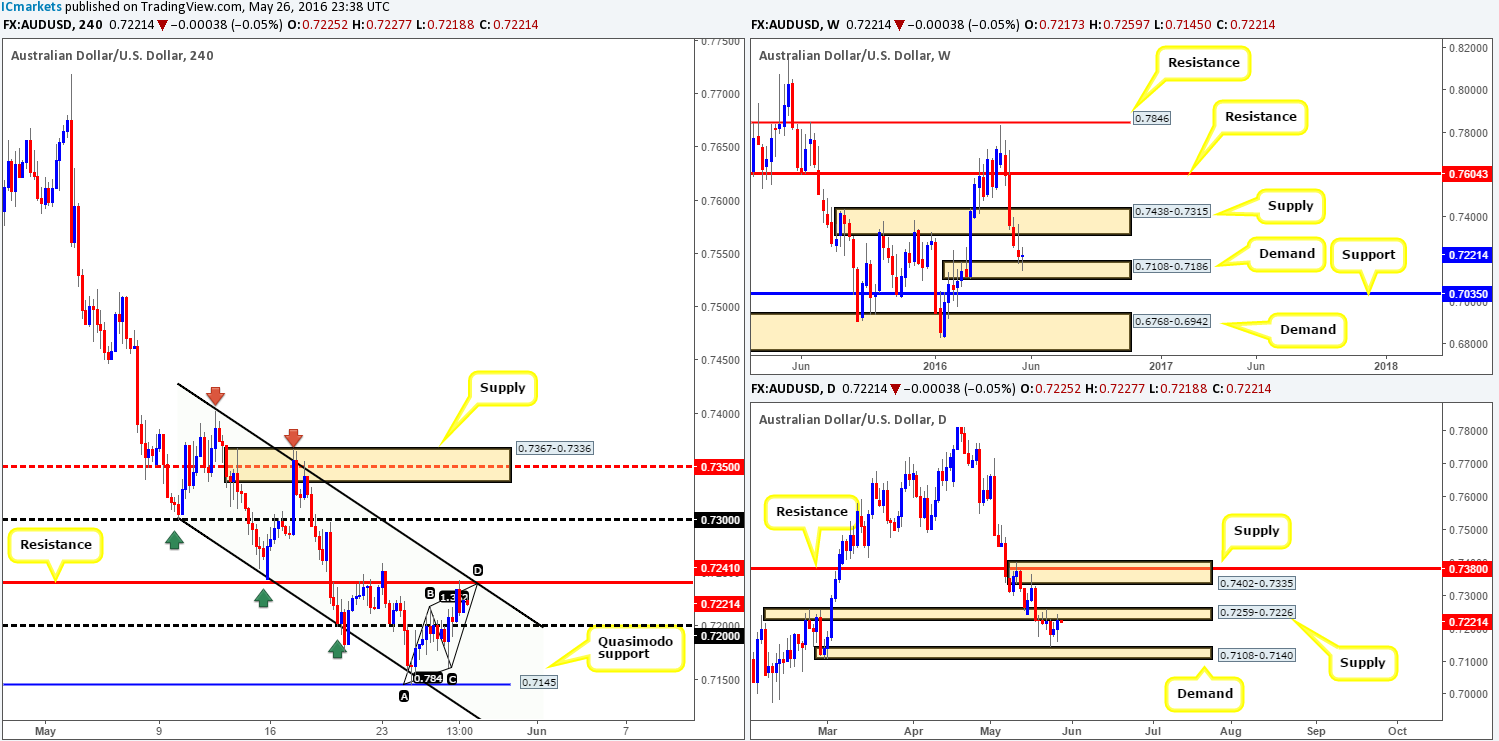
For those who have been following the Aussie report over the past few days, you may recall that our team placed a pending buy order at 0.7150, which was filled nicely on Tuesday. Partial profits were taken just beneath the 0.72 handle and, thanks to yesterday’s push higher, our position was closed at the final take-profit line – a H4 resistance at 0.7241. Well done to any of our readers who profited from this move!
Pushing forward, here is how we see this market right now:
- Weekly price is bouncing from weekly demand at 0.7108-0.7186, and has the potential to rally back up to retest weekly supply drawn from 0.7438-0.7315.
- Daily action is now seen kissing the underside of a small daily supply area at 0.7259-0.7226.
- The H4 chart shows an AB=CD bearish pattern formed on approach to the above said H4 resistance line. Additional confluence is seen from a converging upper H4 channel resistance taken from the high 0.7402.
Our suggestions: Given the confluence seen on the H4 chart, along with daily supply (see above), we feel a short from the 0.7241 is something to consider today. However, owing to the weekly picture showing demand currently in play (see above) there’s still a risk that, despite the H4 confluence, price could continue to rally higher. Therefore, we would highly recommend only taking a short trade around 0.7241 if you see bearish strength forming on the lower timeframes. For us this would be either a demand engulf and subsequent retest, a trendline break/retest or a collection of selling wicks around either the higher-timeframe level itself or a minor lower-timeframe resistance.
Levels to watch/live orders:
- Buys: Flat (Stop loss: N/A).
- Sells: 0.7241 region [Tentative – confirmation required] (Stop loss: dependent on where one confirms this area).
USD/JPY:
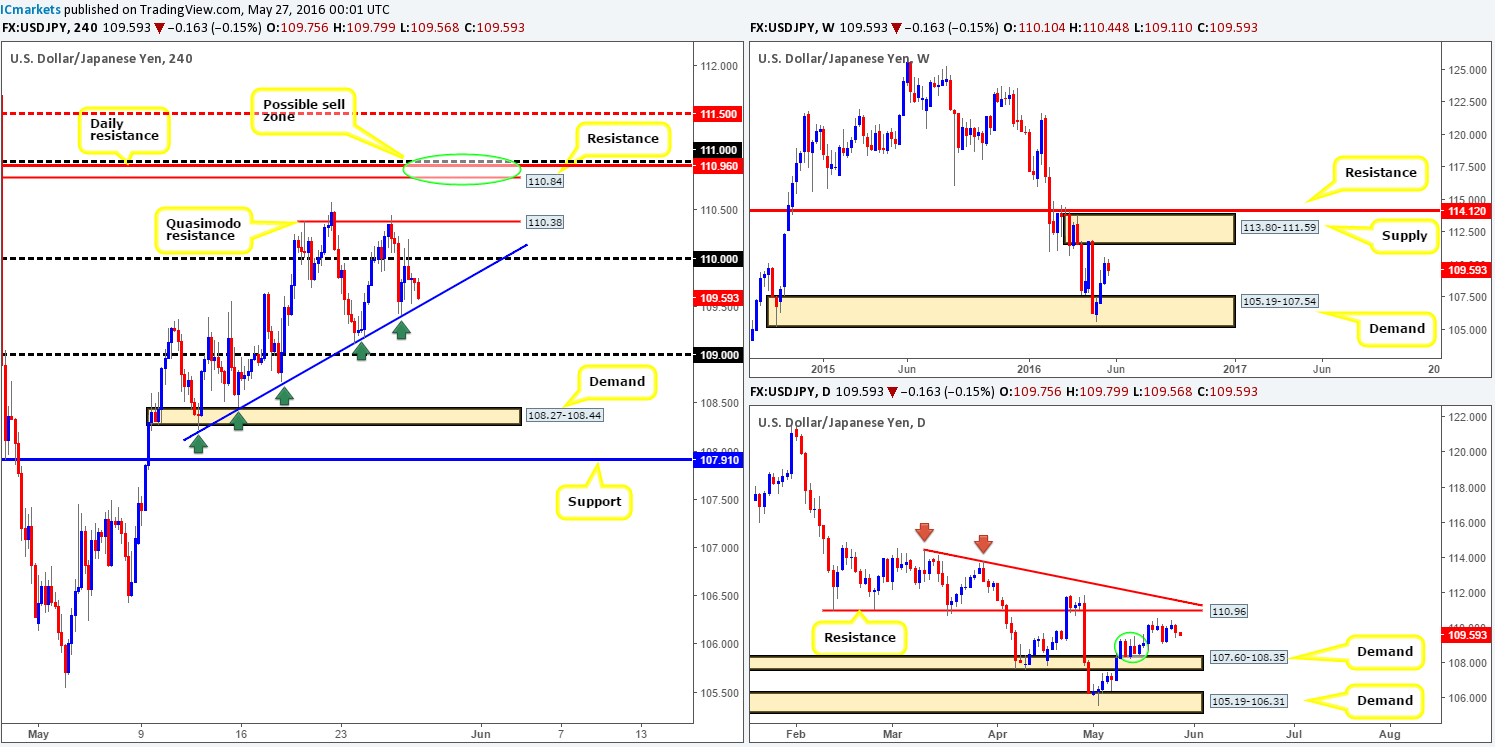
During the course of yesterday’s sessions, H4 action once again respected the H4 trendline support (extended from the low 108.22) for the fifth consecutive time. From here the bulls attempted to break above the 110 handle on two occasions, but as you can see, struggled to gain ground, eventually dropping to lows of 109.52 by the day’s end.
To keep this report as short as possible, we’re going to list our findings in bullet-point form starting with the H4 chart and working up to the weekly:
- On the H4 chart, price is, thanks to the rising H4 trendline mentioned above and the H4 Quasimodo resistance line at 110.38, collectively forming a H4 ascending triangle. Conventional wisdom, as far as we know, states to either buy the break, or conservatively trade the break/retest at the upper boundary of the ascending triangle. Caution is advised here since directly above sits a nice-looking H4 sell zone at 111.00/110.84 zone (round-number 111.00, daily resistance at 110.96 and H4 resistance at 110.84 [green circle]).
- Looking over to the daily chart, we can see that there’s also a daily trendline resistance formed from the high 114.44 converging with the above said daily resistance line.
- Weekly price continues to gravitate in the direction of a weekly supply zone given at 113.80-111.59.
Our suggestions: As mentioned in the previous report, the 111.00/110.84 H4 zone looks fantastic for sell opportunities. Despite the collection of resistances seen here, however, we would still require lower timeframe confirmation to form before risking capital (see the top of this report for ideas on how to find confirmation). The reason being is, as we mentioned above, weekly activity could very well continue north up to the underside of the above said weekly supply – essentially the H4 mid-way resistance 111.50, fifty pips above our sell zone!
Levels to watch/live orders:
- Buys: Flat (Stop loss: N/A).
- Sells: 111.00/110.84 region [Tentative – confirmation required] (Stop loss: dependent on where one confirms this area).
USD/CAD:
Reporting directly from the weekly chart this morning, price is currently seen hovering just ahead of a major line of weekly support penciled in at 1.2833. From a technical standpoint, the catalyst behind the recent decline in value is likely due to the daily supply zone coming in at 1.3218-1.3086, which has, as can be seen on the daily chart, sent prices down to daily support drawn from 1.2970. Across on the H4 chart, nevertheless, price is now seen trapped between the aforementioned daily support barrier and the large psychological resistance 1.30.
Our suggestions: Assuming price breaks above and retests 1.30 today, one could look to trade this retest (along with a lower timeframe buy setup – see the top of this report for ideas) and target H4 supply above at 1.3076-1.3099 (sits directly below the daily supply zone seen at 1.3218-1.3086). On the other hand, a H4 break below and retest of the daily support line at 1.2970 looks to be a legit short setup, targeting 1.29.
Personally, we prefer the former here guys, as a break below the daily support could simply be another fakeout similar to what we saw during yesterday’s sessions.
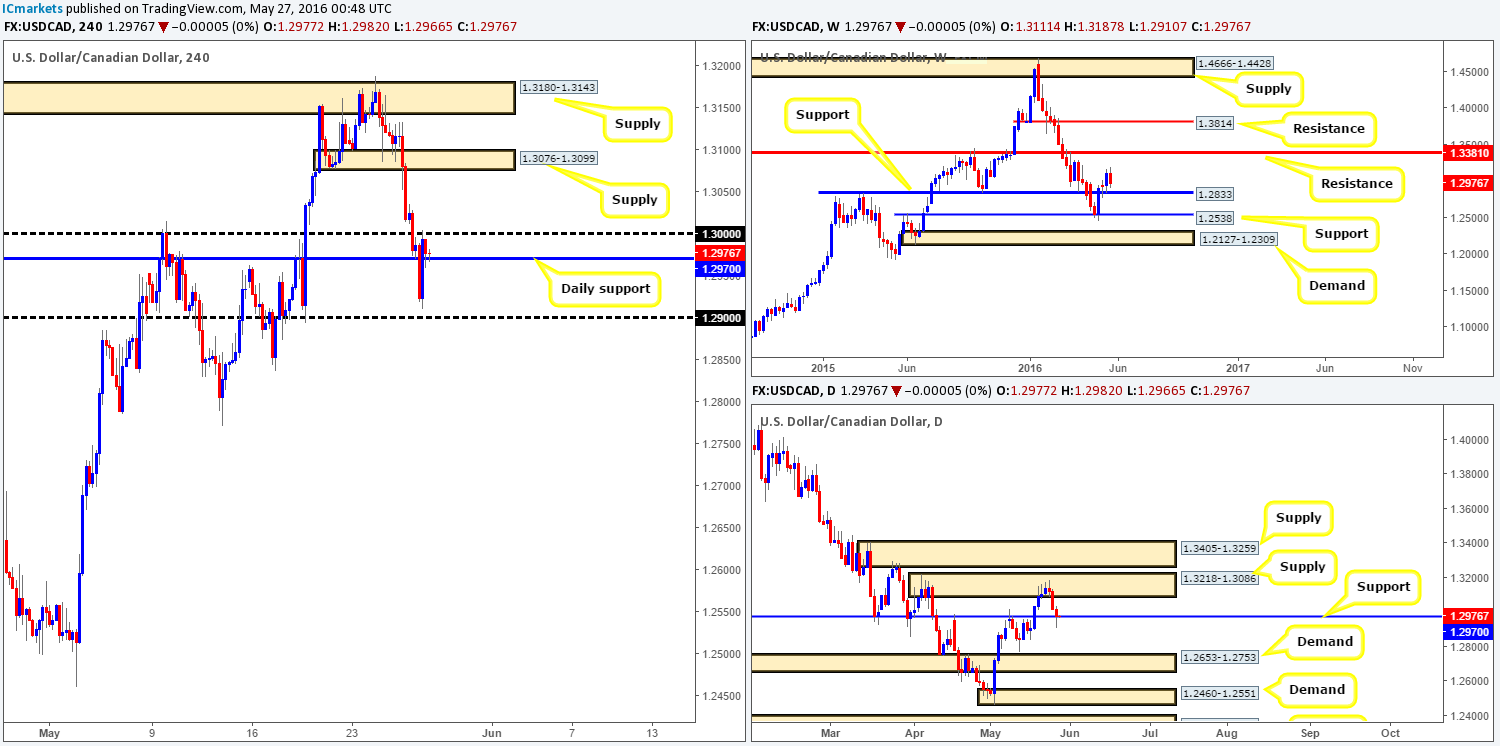
Levels to watch/live orders:
- Buys: Watch for price to consume 1.30 and then look to trade any retest seen thereafter (lower timeframe confirmation required).
- Sells: Flat (Stop loss: N/A).
USD/CHF:
Since price connected with the underside of weekly supply at 1.0092-0.9928, price has been in somewhat of a mellow phase. Assuming the bears hold ground here, it is possible, however, to see this market drive lower to shake hands with weekly support chalked up at 0.9760. However, as we mentioned in yesterday’s report, given the size of this barrier, we may see further buying into this area before weakness comes into the market.
Despite the market’s bearish response from the above said weekly supply, daily demand at 0.9913-0.9869 is still in the game. In the event that this barrier holds firm, we may see this pair rally north to connect with a daily Quasimodo resistance line formed at 1.0037 (lurks deep within the current weekly supply area).
Scanning over to the H4 chart, the Swissy continues to tease the top-side of the H4 demand barrier at 0.9862-0.9884. This barrier has managed to cap downside since the beginning of the week, so it is certainly a zone of interest to have noted in your watch lists traders!
Our suggestions: In view of the above points, here are the options as we see it:
- Look for a long trade off of the H4 demand barrier at 0.9862-0.9884. Granted, you would be buying into weekly supply, but at the same time, you’d also be trading in-line with daily flow.
- Look for lower timeframe sell setups at 0.9950. From here you’d be selling from weekly supply but against daily flow.
- Should 0.9950 fail, we’ll then focus on the daily Quasimodo resistance at 1.0037 coupled with 1.0000 (parity) to form a sell zone.
Other than the third option, our team highly recommends waiting for lower timeframe price action to form before risking capital (for ways of confirming price action, please see the top of this report). With regards to the third option, one could potentially sell at market between the daily Quasimodo line and parity and place their stop above the surrounding weekly supply zone. This remains just an idea for now, which could change depending on how price approaches the sell area.

Levels to watch/live orders:
- Buys: 0.9862-0.9884 [Tentative – confirmation required] (Stop loss: dependent on where one confirms this area).
- Sells: 0.9950 region [Tentative – confirmation required] (Stop loss: dependent on where one confirms this area).1.0037/1.0000 [Could possibly enter at market from this region – will depend on how the H4 price approach the sell zone] (Stop loss: dependent on how we decide to sell here).
DOW 30:
From the top this morning, weekly bulls seem to be really digging in their hoofs at the moment as price continues to look strong from its recent bounce off of the weekly support area at 17446-17606. Should the bears remain weak here, we see price likely coming into contact with the weekly resistance area at 18365-18158 sometime soon. Down on the daily chart, nonetheless, the DOW is seen flirting with a daily resistance line coming in at 17894, which saw the latest action print a clear-cut indecision candle.
Despite price testing a daily resistance, H4 price found a pocket of bids from just above a H4 demand base carved from 17801-17761 going into yesterday’s American session. Therefore, knowing upside momentum could possibly diminish from the daily resistance line, would buying at the H4 demand zone make sense? Well, as we mentioned in our previous report, this is debatable considering that the weekly chart shows room for the bulls to continue advancing north (see above).
Our suggestions: To enter long from the current H4 demand we would need to see some form of lower timeframe confirmation take shape within the H4 demand base before risking capital on this idea (for ways of confirming higher-timeframe zones please see the top of this report). On the assumption that we do manage to pin down a lower timeframe buy setup here, we’ll immediately look to target the daily resistance line mentioned above at 17894 as a first take-profit target, followed then by H4 resistance at 17920.
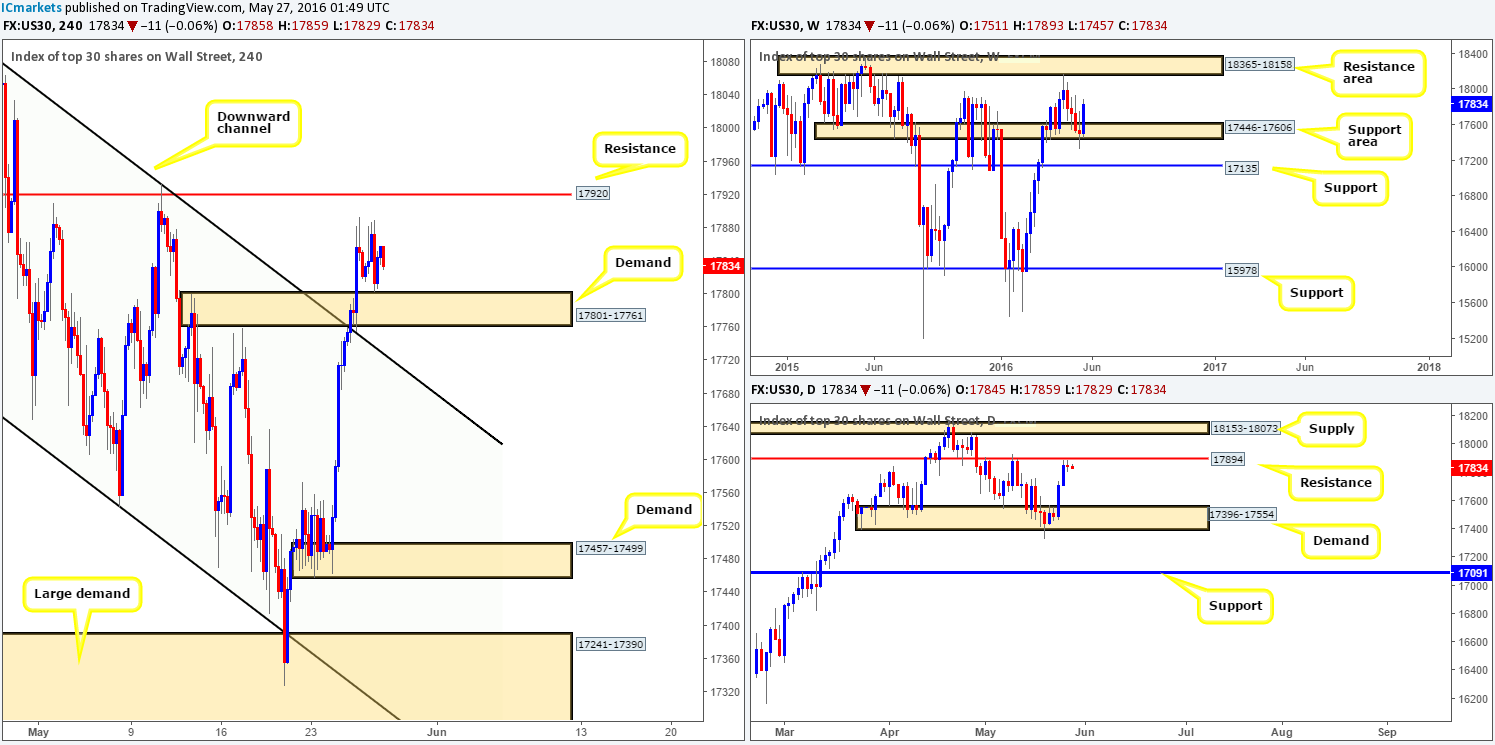
Levels to watch/live orders:
- Buys: 17801-17761 [Tentative – confirmation required] (Stop loss: dependent on where one confirms this area).
- Sells: Flat (Stop loss: N/A).
GOLD:
Using a top-down approach this morning, we can see that the yellow metal continues to steam roll itself lower, edging price to now within touching distance of its next target – the weekly demand base coming in at 1205.6-1181.2.
Daily demand at 1223.7-1233.3 (now acting supply), which at this time yesterday was holding this market higher, has been taken out as price closed lower for its seventh consecutive day! To our way of seeing things, this has potentially cleared the pathway south for further selling down to daily support given at 1191.4.
Despite both the weekly and daily timeframes suggesting further selling is possible, H4 movement is seen kissing the extremes of a H4 demand zone falling in at 1216.4-1222.0. Judging by the way price is moving right now though, it is unlikely that this area is going to hold. The next downside target as per this timeframe can be seen around a H4 demand base coming in at 1181.6-1191.1 – essentially sits beneath the daily support line mentioned above at 1191.4.
Our suggestions: Some traders may think our downside targets are a little steep on the daily and H4 timeframes. They could very well be correct too! However, we see very little active demand on both these timeframes until the above said barriers. Therefore, in the event that bullion closes below the current H4 demand base today, we’ll then be on the lookout for price to retest this barrier as supply and hold. Should this come to fruition, and the lower timeframe bears hold ground, we’ll look to short this market attempting to ride the wave down to the aforementioned H4 target.
For ideas on how to confirm a higher-timeframe zone on the lower timeframes, please see the top of this report.
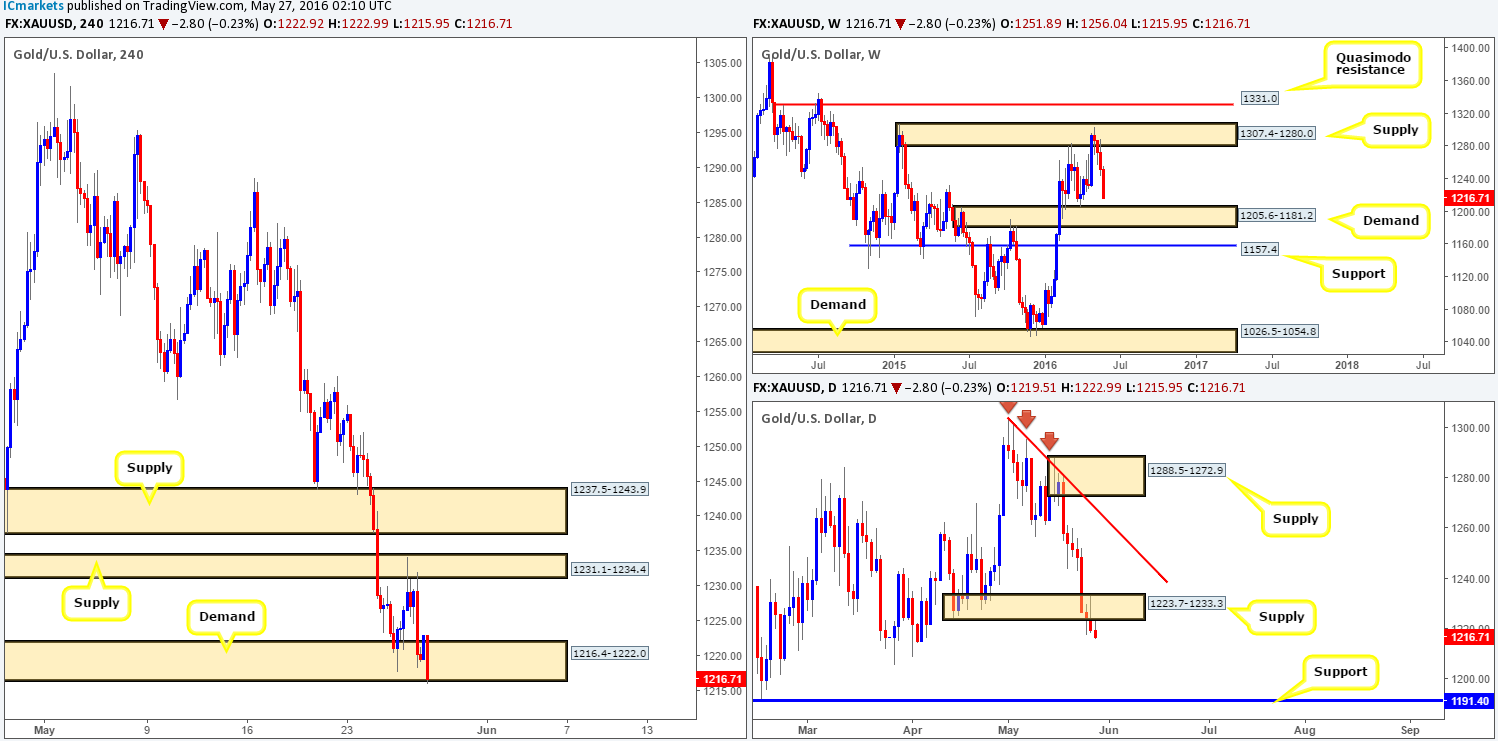
Levels to watch/live orders:
- Buys: Flat (Stop loss: N/A).
- Sells: Watch for price to consume 1216.4-1222.0 and then look to trade any retest seen thereafter (lower timeframe confirmation required).


