EUR/USD:
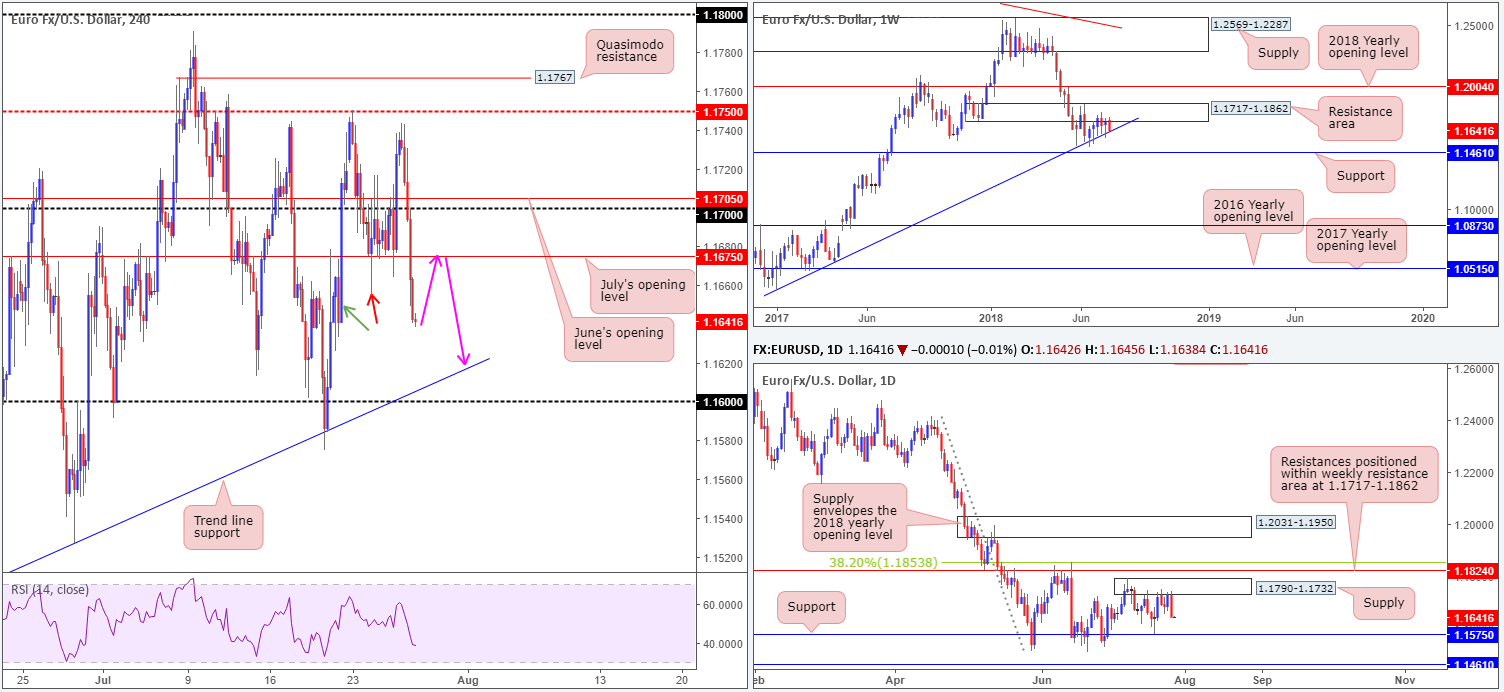
EUR/USD bulls, as you can see, lost their flavor just ahead of the H4 mid-level resistance at 1.1750 on Thursday, consequently forcing price through a number of key H4 support barriers. Despite disappointing US durable goods orders m/m, the euro fell sharply after Draghi clarified guidance regarding an interest rate hike through summer 2019 at the earliest.
As a result of yesterday’s move, the H4 candles appear free to cross swords with the trend line support etched from the low 1.1508 and nearby 1.16 handle. Our rationale behind this approach comes from seeing H4 demand around the 1.1640-1.1715 area marked with a green arrow likely already consumed by Tuesday’s low at 1.1654 (red arrow).
Daily movement responded beautifully to the underside of supply at 1.1790-1.1732, forming a near-full-bodied bearish candle in the direction of nearby support priced in at 1.1575. In terms of weekly action, however, the pair is seen testing trend line support (etched from the low 1.0340) after selling off from a neighboring resistance area at 1.1717-1.1862.
Areas of consideration:
In light of recent events, the team has noted to keep eyeballs on the underside of July’s opening level printed on the H4 timeframe at 1.1675 for a possible retest play (pink arrows), targeting the noted H4 trend line support as the initial take-profit zone.
The only drawback to a sell in this market, of course, is the current weekly trend line support. To help overcome this, traders are urged to wait and see if H4 price can chalk up a full or near-full-bodied bearish candle from 1.1675 prior to pulling the trigger.
Today’s data points: US GDP (advance) q/q; US Revised UoM consumer sentiment.
GBP/USD:
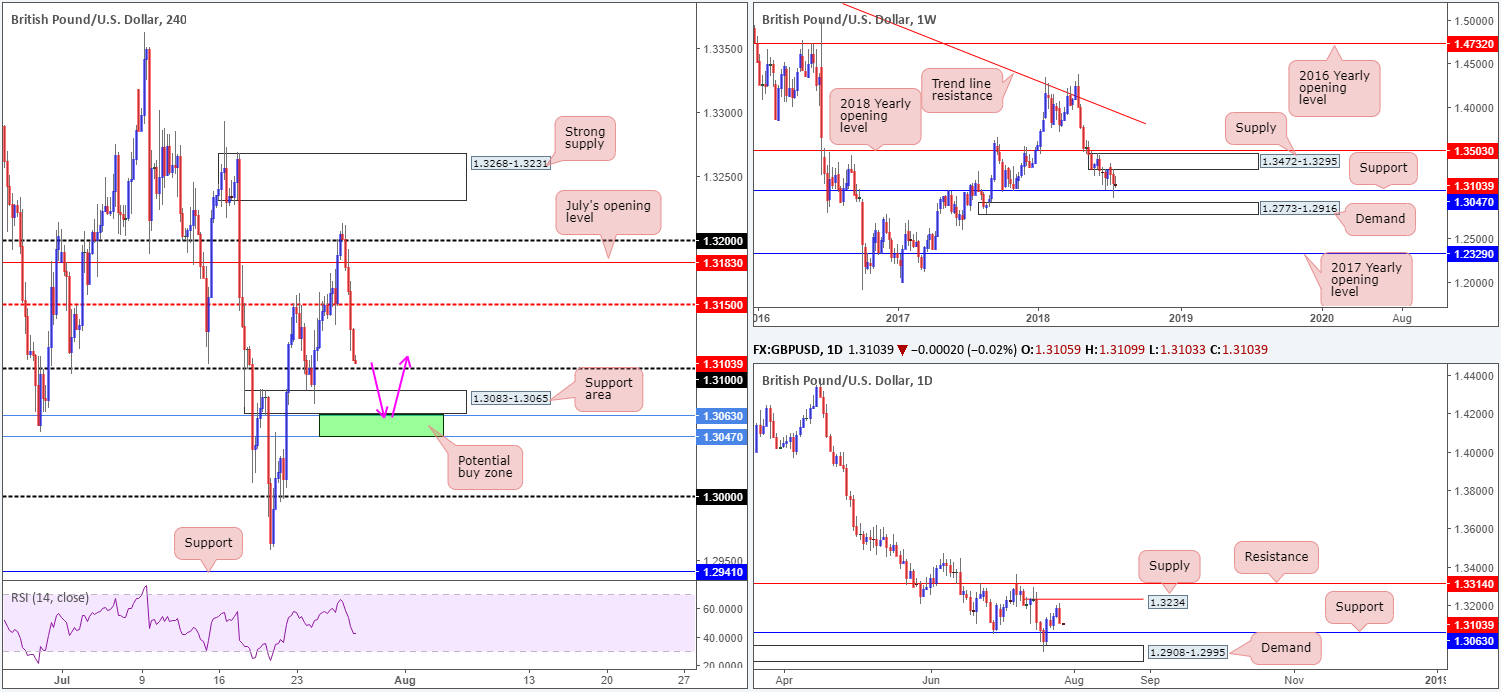
In recent sessions, the British pound pared weekly gains as the currency tracked overall trends, particularly in the EUR/USD market. Further adding to this weakness, Brexit fears elbowed its way back into the spotlight, following EU’s chief Brexit negotiator, Michel Barnier, saying the UK customs plan is not a workable solution.
Both July’s opening level at 1.3183 and the mid-level support at 1.3150 on the H4 timeframe were consumed, with the unit concluding trade closing within striking distance of the 1.31 handle, followed closely by a support area at 1.3083-1.3065. Higher-timeframe levels to keep in sight are the daily support base coming in at 1.3063 and weekly support at 1.3047.
Areas of consideration:
With 1.31 seen close by, along with its closely associated H4 support area mentioned above at 1.3083-1.3065, looking to short this market is challenging.
In its place, the team has highlighted a potential buy zone that ‘makes sense’ on the H4 timeframe, comprised of both the weekly and daily supports seen marked in green at 1.3047/1.3063. Stop-loss orders beneath 1.31 and the noted H4 support area will likely provide liquidity to those with big pockets looking to buy from 1.3047/1.3063. The first ‘trouble’ area can be seen at 1.31. A H4 close above this number would be an ideal cue to begin thinking about taking some profit off the table and reducing risk to breakeven.
Today’s data points: US GDP (advance) q/q; US Revised UoM consumer sentiment.
AUD/USD:
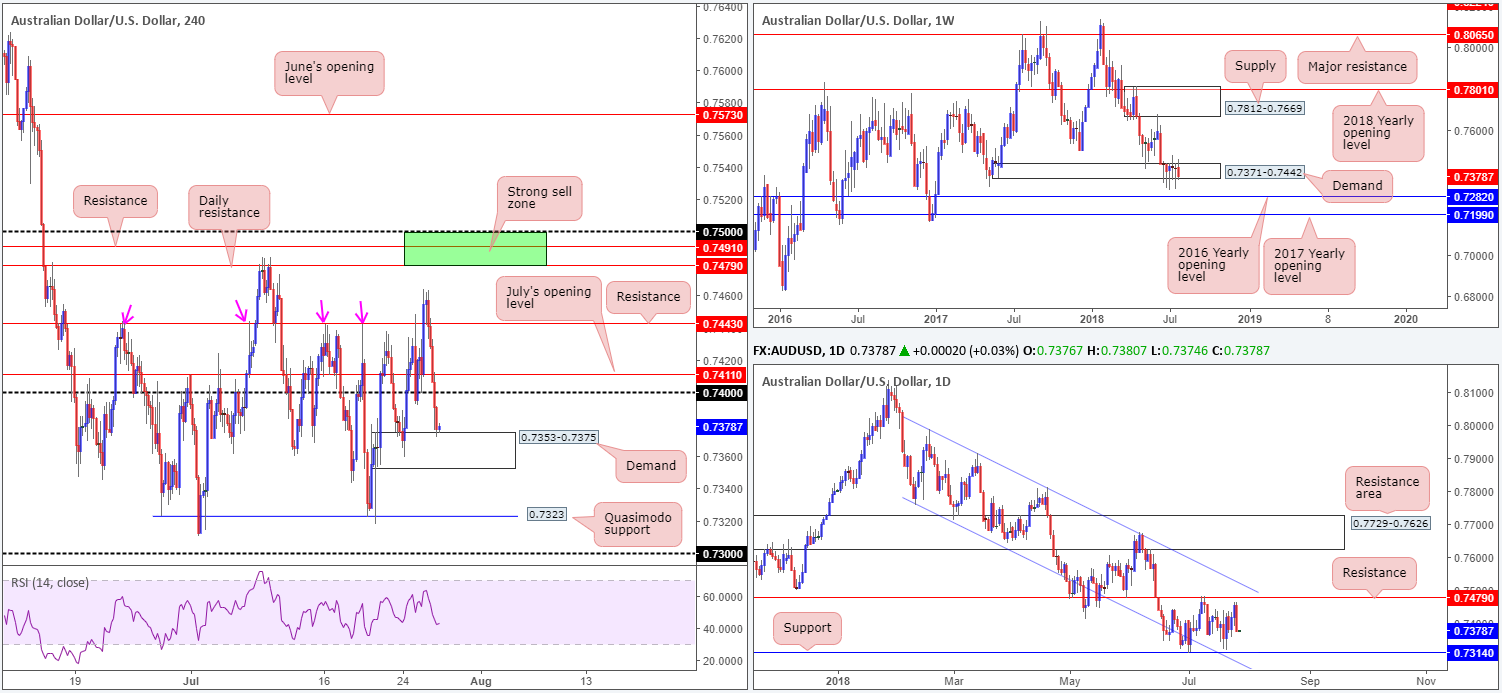
Failing to sustain gains above H4 resistance at 0.7443, the commodity currency went back to playing on the defensive amid trade on Thursday. USD demand re-entered the markets, prompted by recent Draghi comments, pulling the USD dollar index firmly above the 94.50 mark, with 95.00 now eyed.
In terms of weekly price, very little has changed over the last month. Demand at 0.7371-0.7442 remains in a fragile state. Continued indecisiveness here could open the window to a possible test of the 2016 yearly opening level at 0.7282 sometime down the road. In the event that the bulls regain consciousness, however, a retest of supply at 0.7812-0.7669 may be on the cards. Turning the spotlight over to daily movement, we see little stopping this market from probing lower until reaching support plotted at 0.7314, shadowed closely by channel support etched from the low 0.7758.
Areas of consideration:
Following a break of the 0.74 handle on the H4 scale, the pair landed firmly in the lap of demand printed at 0.7353-0.7375, which, as you can see, responded once already on Tuesday. This area, along with nearby H4 Quasimodo support at 0.7323, makes this a difficult market to short, despite both weekly and daily timeframes indicating weakness in the air!
On account of the above, neither a long nor short seems attractive at the moment. Remaining on the sidelines may, therefore, be the better bet.
Today’s data points: US GDP (advance) q/q; US Revised UoM consumer sentiment.
USD/JPY:
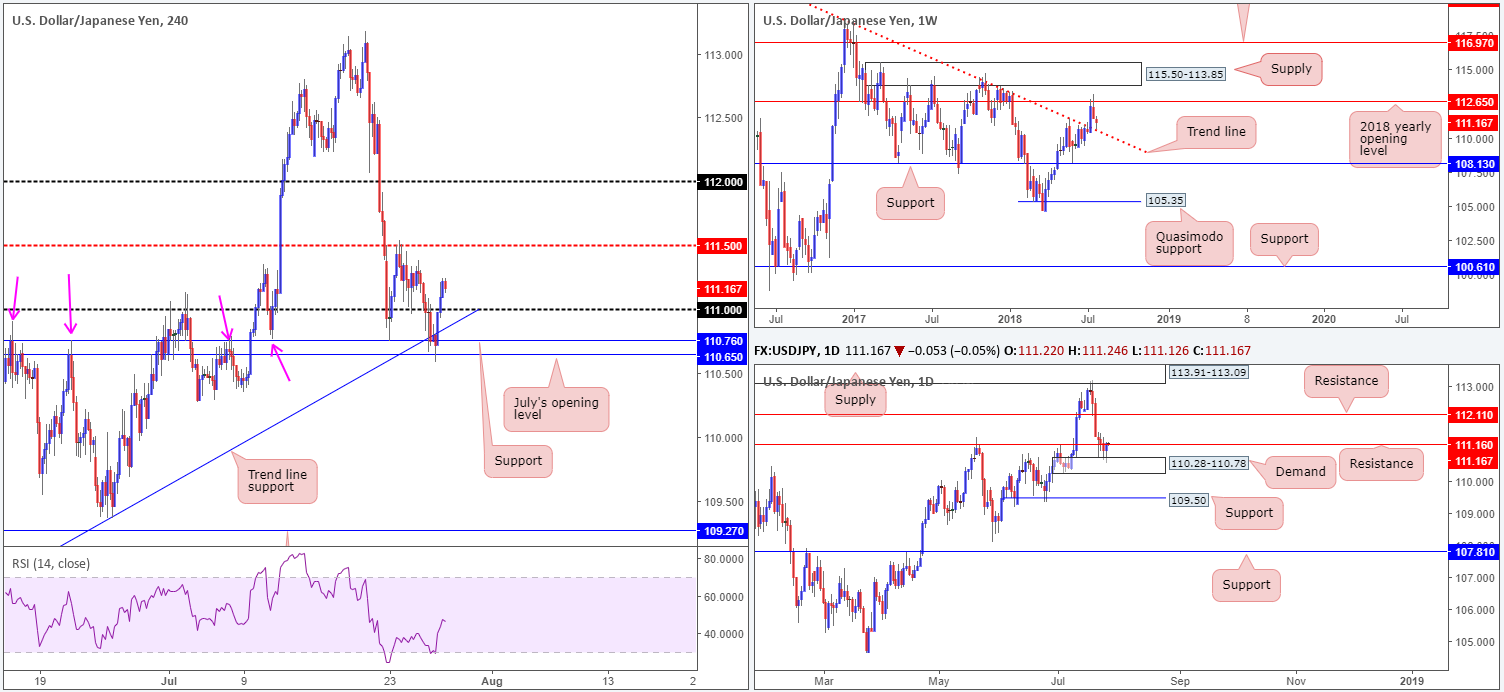
For those who read Thursday’s briefing you may recall the team cautioned taking longs in this market around H4 support at 110.65, given weekly price had not yet connected with trend line resistance-turned support (taken from the high 123.57). Although we expected more of an abrupt push below the H4 support, we did see a marginal fakeout lower and weekly price shake hands with the trend line support on Thursday. Seeing as how the weekly trend line support was also in unison with the top edge of daily demand at 110.28-110.78, the pair advanced higher from here and closed above the 111 handle on the H4 timeframe. Well done to any of our readers who managed to jump aboard this move.
Moving forward, the majority of traders are now likely seeking a retest play off the top of 111, given where we’re coming from on the weekly timeframe. The only grumble we see here is daily resistance at 111.16 remains in the fold!
Areas of consideration:
Should H4 price retest 111 and hold in the shape of a full or near-full-bodied bull candle, this will, technically speaking, emphasize strength. And knowing that this move is bolstered by weekly structure, daily resistance will likely be taken out.
Entering long on the close of a bull candle is an option, with the stop-loss order tucked beneath its tail. As for take-profit targets, the ultimate area of interest falls in at the 2018 yearly opening level seen on the weekly timeframe drawn from 112.65.
Today’s data points: US GDP (advance) q/q; US Revised UoM consumer sentiment.
USD/CAD:
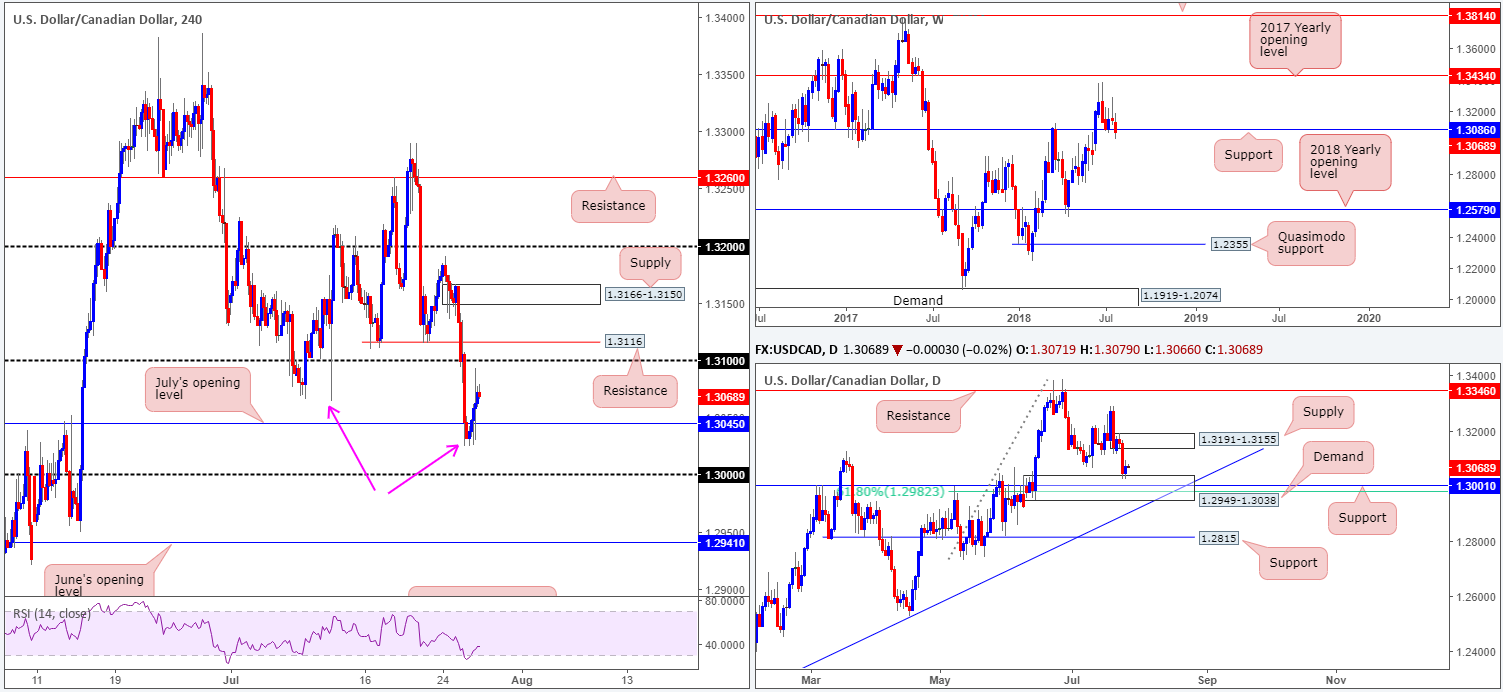
Despite breaching July’s opening level on the H4 timeframe at 1.3045, USD/CAD movement penciled in a modest recovery on Thursday. Robust USD buying seen across the board, supported by daily demand at 1.2949-1.3038, permitted the Loonie to reclaim 1.3045 and close the session eyeing the underside of the 1.31 handle. Also worth noting on the H4 scale is the resistance level seen plotted directly above 1.31 at 1.3116.
The story over on the bigger picture shows daily price could extend Thursday’s gains owing to room seen for the market to stretch as high as supply coming in at 1.3191-1.3155. On the other side of the spectrum, however, weekly flow remains marginally below weekly support at 1.3086, although a mild pullback is being seen.
Areas of consideration:
1.31 is likely on the radar for the majority of traders today for shorts, having seen we recently made a lower low (pink arrows) on the H4 timeframe. Be that as it may, sell trades from here are chancy, in our humble view, due to daily price showing room to approach supply mentioned above at 1.3191-1.3155. The more preferred area for shorts, therefore, falls in around H4 supply at 1.3166-1.3150 as it is glued to the underside of the said daily supply.
Today’s data points: US GDP (advance) q/q; US Revised UoM consumer sentiment.
USD/CHF:
Since the beginning of the week, the H4 candles have been busy carving out a range between supply noted at 0.9953-0.9938 and May’s opening level at 0.9907, shadowed closely by the 0.99 handle and July’s opening level at 0.9899. Outside of this consolidation, traders likely have their crosshairs fixed on parity (1.0000) and the Quasimodo support at 0.9884.
The technical picture on the higher timeframes also displays an interesting landscape. Weekly price remains capped by the 2016 yearly opening level at 1.0029. Further selling from current price has the June lows at 0.9788 to target, as well as the 2018 yearly opening level at 0.9744. Turning the focus to the daily timeframe, we can see the unit hovering just north of Quasimodo support at 0.9893. Note the additional layer of supports seen directly below it at 0.9855 (a double-bottom formation) and another Quasimodo support at 0.9826.
Areas of consideration:
With daily price likely to eventually test Quasimodo support mentioned above at 0.9893, a fakeout below the current H4 supports (the lower edge of the current H4 range) down to the H4 Quasimodo support noted above at 0.9884 is a possible move in the near future. Stops taken from below the H4 consolidation should provide institutional traders liquidity to buy. Remember, entering long from 0.9884 has daily Quasimodo support backing the move, so a break back above 0.99 could be on the cards (a good time to be thinking of reducing risk to breakeven). Aggressive stop placement can be positioned at 0.9877, while conservative traders may opt for the apex of the H4 Quasimodo formation at 0.9857.
Should the market witness a H4 close above the current H4 supply, nevertheless, a retest to this area as support in the shape of a full or near-full-bodied H4 bull candle would, in our technical view, be enough to warrant further upside to parity. Stop-loss orders are best placed beyond the candle’s tail.
Today’s data points: US GDP (advance) q/q; US Revised UoM consumer sentiment.
Dow Jones Industrial Average:
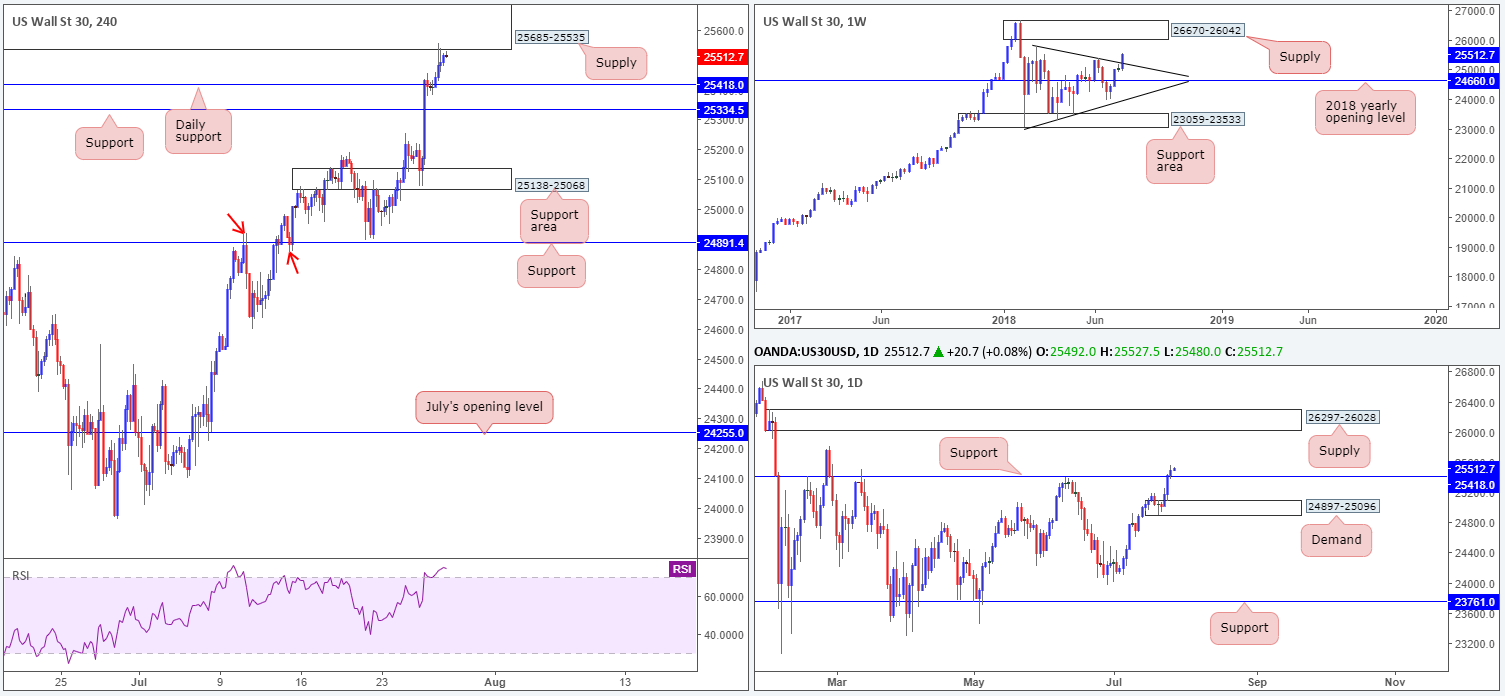
Kicking this market off from the top this morning, weekly price recently elbowed its way through trend line resistance (etched from the high 25807), potentially setting the stage for further upside to supply positioned at 26670-26042.
In conjunction with weekly flow, daily resistance at 25418 was also taken out amid trading yesterday (now acting support). Assuming the buyers remain defensive here, the market could witness an approach towards supply drawn from 26297-26028.
In terms of H4 movement, Thursday’s session brought the index to the underside of supply coming in at 25685-25535: an area with sound history dating back to February of this year. Another worthy point is the H4 RSI indicator is seen displaying a clear overbought signal right now.
Areas of consideration:
Having seen both weekly and daily price standing in a strong position at the moment, sellers from the underside of the current H4 supply zone may struggle to print anything noteworthy. With that being the case, we strongly recommend treading carefully here should you consider selling.
Should H4 price retest daily support mentioned above at 25418 today and chalk up a full or near-full-bodied bull candle, this would, technically speaking, be an ideal location to secure a long position (stop-loss order best placed beyond the candle’s rejection tail), targeting a break of the aforementioned H4 supply zone.
Today’s data points: US GDP (advance) q/q; US Revised UoM consumer sentiment.
XAU/USD (Gold)
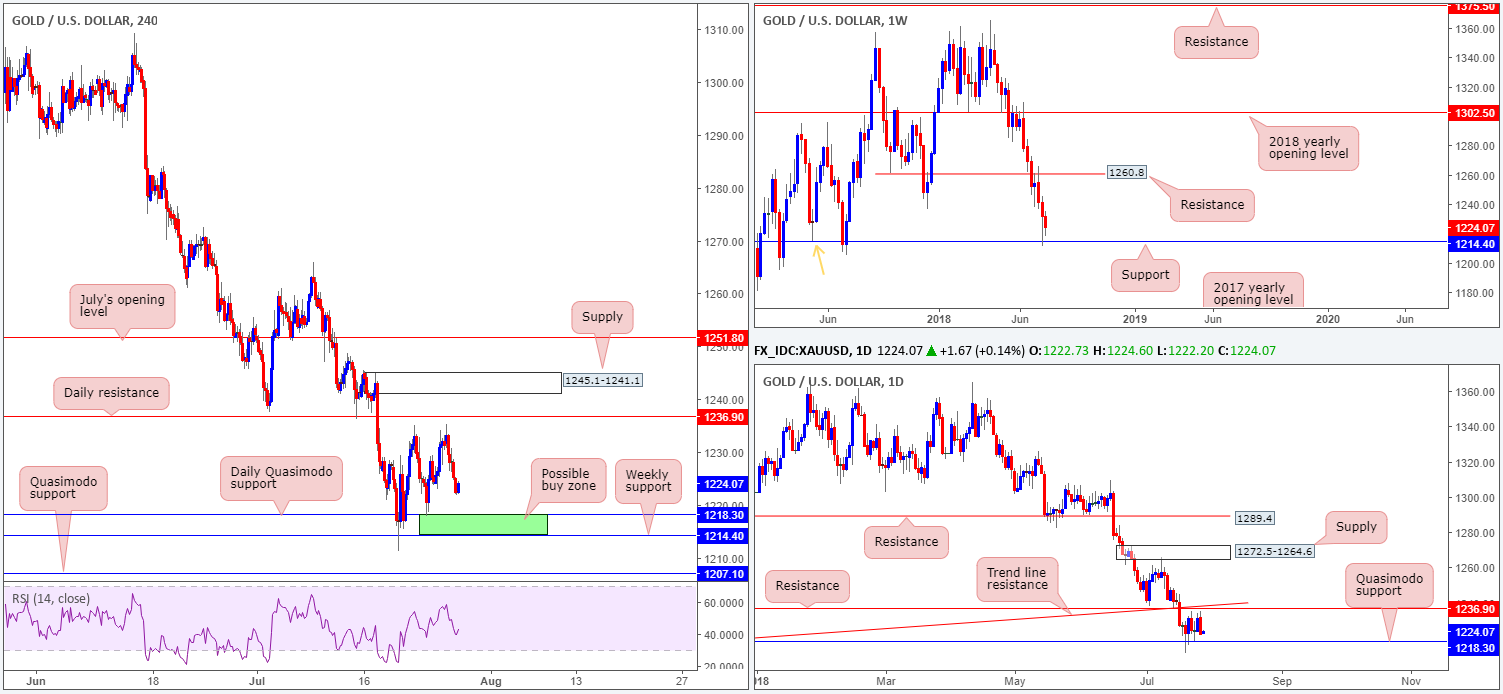
Leaving the daily resistance level at 1236.9 unchallenged, Thursday’s movement turned lower amid strong USD buying. As you can see, this has placed the H4 candles within striking distance of a daily Quasimodo support priced in at 1218.3, followed closely by weekly support at 1214.4. Between these two levels: 1214.4/1218.3 is likely an area of interest for buyers today.
Areas of consideration:
Keeping it Simple Simon this morning, keep eyes on 1214.4/1218.3 for possible buying opportunities. Aggressive traders may opt to buy at market from the top edge of the zone with stops positioned below it. Conservative traders, on the other hand, could consider waiting and seeing if H4 price pencils in a full or near-full-bodied bull candle before pulling the trigger. With regard to take-profit zones, the daily resistance level highlighted above at 1236.9 is certainly a base to keep tabs on. Above here, the next area of concern falls in at 1245.1-1241.1: a H4 supply.
The use of the site is agreement that the site is for informational and educational purposes only and does not constitute advice in any form in the furtherance of any trade or trading decisions.
The accuracy, completeness and timeliness of the information contained on this site cannot be guaranteed. IC Markets does not warranty, guarantee or make any representations, or assume any liability with regard to financial results based on the use of the information in the site.
News, views, opinions, recommendations and other information obtained from sources outside of www.icmarkets.com.au, used in this site are believed to be reliable, but we cannot guarantee their accuracy or completeness. All such information is subject to change at any time without notice. IC Markets assumes no responsibility for the content of any linked site. The fact that such links may exist does not indicate approval or endorsement of any material contained on any linked site.
IC Markets is not liable for any harm caused by the transmission, through accessing the services or information on this site, of a computer virus, or other computer code or programming device that might be used to access, delete, damage, disable, disrupt or otherwise impede in any manner, the operation of the site or of any user’s software, hardware, data or property.
