
EUR/USD:
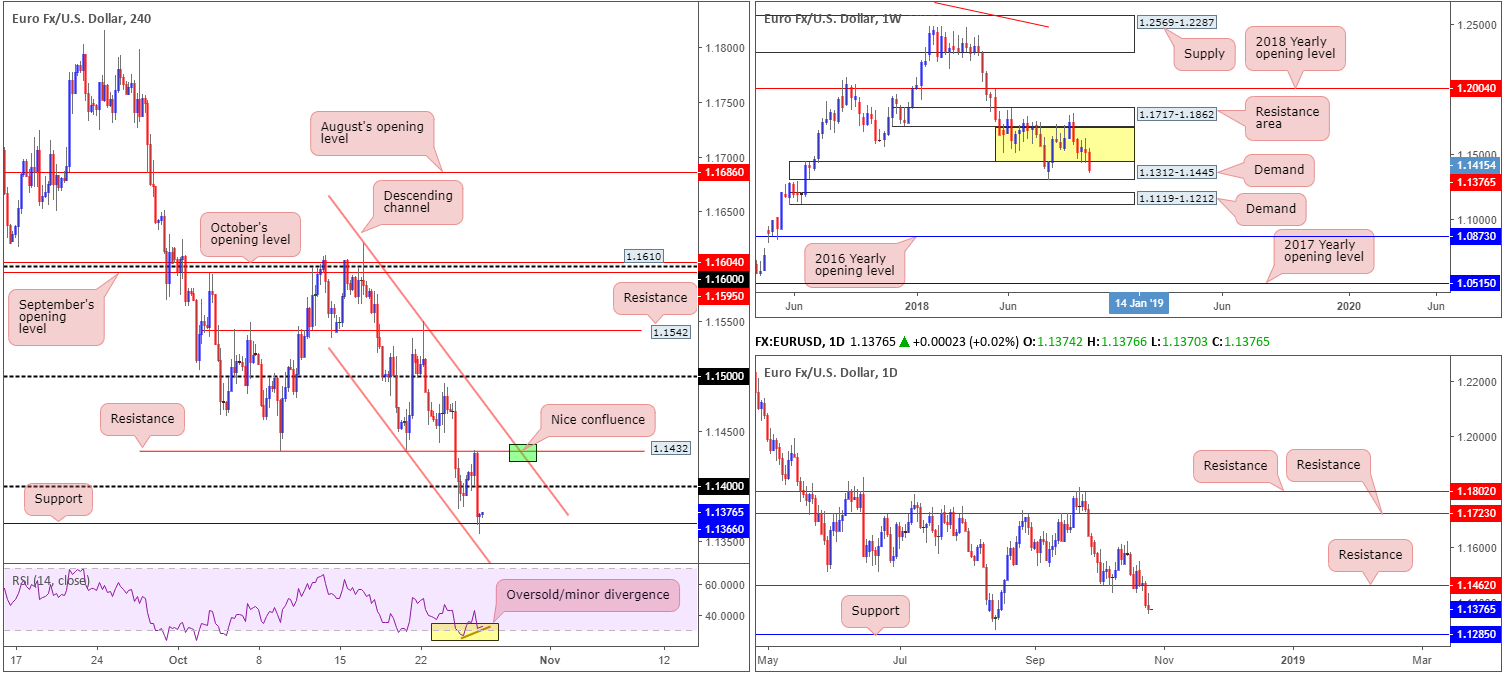
Down 0.15% on the day, the single currency registered its second consecutive daily loss Thursday.
The European Central Bank (ECB), as expected, kept interest rates unchanged at its October meeting. Its statement reiterated inflation is on track to converge to target and risks for growth remain broadly balanced. During this time, although the euro traded as high as 1.1432 vs. its US counterpart, the pair encountered strong selling pressure from this point: a H4 double-bottom support-turned resistance. As you can see, the H4 candles concluded the session reclaiming 1.14 to the downside, challenging neighbouring support fixed at 1.1366 in the shape of a bullish pin-bar formation.
Having seen the current H4 support/bullish pin-bar pattern take shape within the walls of a weekly demand area at 1.1312-1.1445, along with the H4 RSI indicator printing an oversold/minor bullish divergence reading, a recovery play may be in store today towards 1.14/H4 resistance at 1.1432. The only drawback to this is the daily timeframe. Daily support at 1.1462 – a level which boasts notable history dating as far back as early 2015 – was engulfed Wednesday (now acting resistance) in strong fashion. According to this timeframe, the pathway south is now potentially clear for a run towards the 1.1301 August 15 low, followed closely by support sited at 1.1285.
Areas of consideration:
A bullish play off the current H4 pin-bar configuration (entry/stop parameters can be defined by the candlestick structure) is an option this morning, given its surrounding confluence – see above in bold. Beyond 1.1432: the H4 resistance, traders also likely have their crosshairs fixed on daily resistance at 1.1462 as additional upside target.
For sellers, should 1.14 fail to hold price lower, intraday eyes will likely be on resistance at 1.1432, specifically at the point where the channel resistance (extended from the high 1.1621) intersects with the level (green zone). However, do remain aware although we have daily action supporting lower prices from here and reasonably sound H4 confluence, weekly flow still resides within demand.
Today’s data points: ECB President Draghi speaks; US growth figures q/q; US revised UoM consumer sentiment.
GBP/USD:
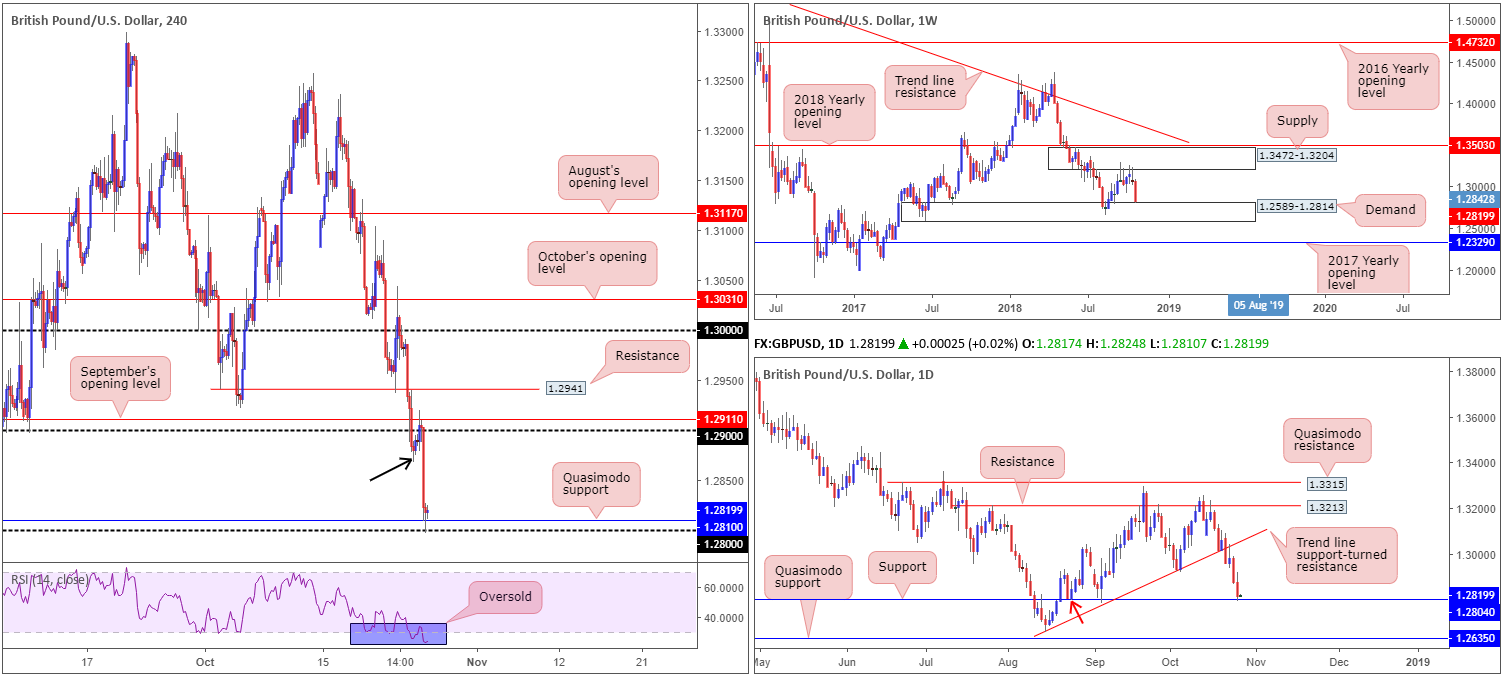
The British pound sank to lows of 1.2796 Thursday, its lowest since early September. Broad-based USD strength, coupled with ongoing Brexit concerns, weighed on market sentiment. Latest headlines to emerge on the Brexit front came from UK Brexit Secretary Raab, noting that planning and preparations are in place to mitigate risks of a no-deal, saying the risk of a no-deal is real if the EU engages in an intransigent approach.
For those who read Thursday’s report you may recall the piece highlighted 1.2911/1.29 (September’s opening level/round number) as a possible sell zone, targeting 1.28ish. Well done to any of our readers who managed to jump aboard this move!
Going forward, unlike British politics at the moment, the technical picture communicates a bullish tone regarding structure. On the H4 timeframe we have the 1.28 handle along with a Quasimodo support at 1.2810 in play. Further adding to this, H4 price recently chalked up a reasonably nice-looking bullish pin-bar formation, as well as the H4 RSI indicator displaying a strong oversold reading. Daily support at 1.2804 (also represents a Quasimodo support – red arrow) is also seen in motion, alongside the top edge of weekly demand plotted at 1.2589-1.2814.
Areas of consideration:
Having seen all three timeframes highlight a buyers’ market right now, a long based around 1.2828 – a couple of pips above the high of the current H4 bullish pin-bar pattern – could be a location to contemplate going long from, with stops tucked beneath its tail: 1.2796. With respect to upside targets from this point, the 1.2867 region (represents the lower edge of a rather large H4 supply: black arrow), followed by the 1.29 handle, are logical considerations according to our technical studies.
Today’s data points: US growth figures q/q; US revised UoM consumer sentiment.
AUD/USD:
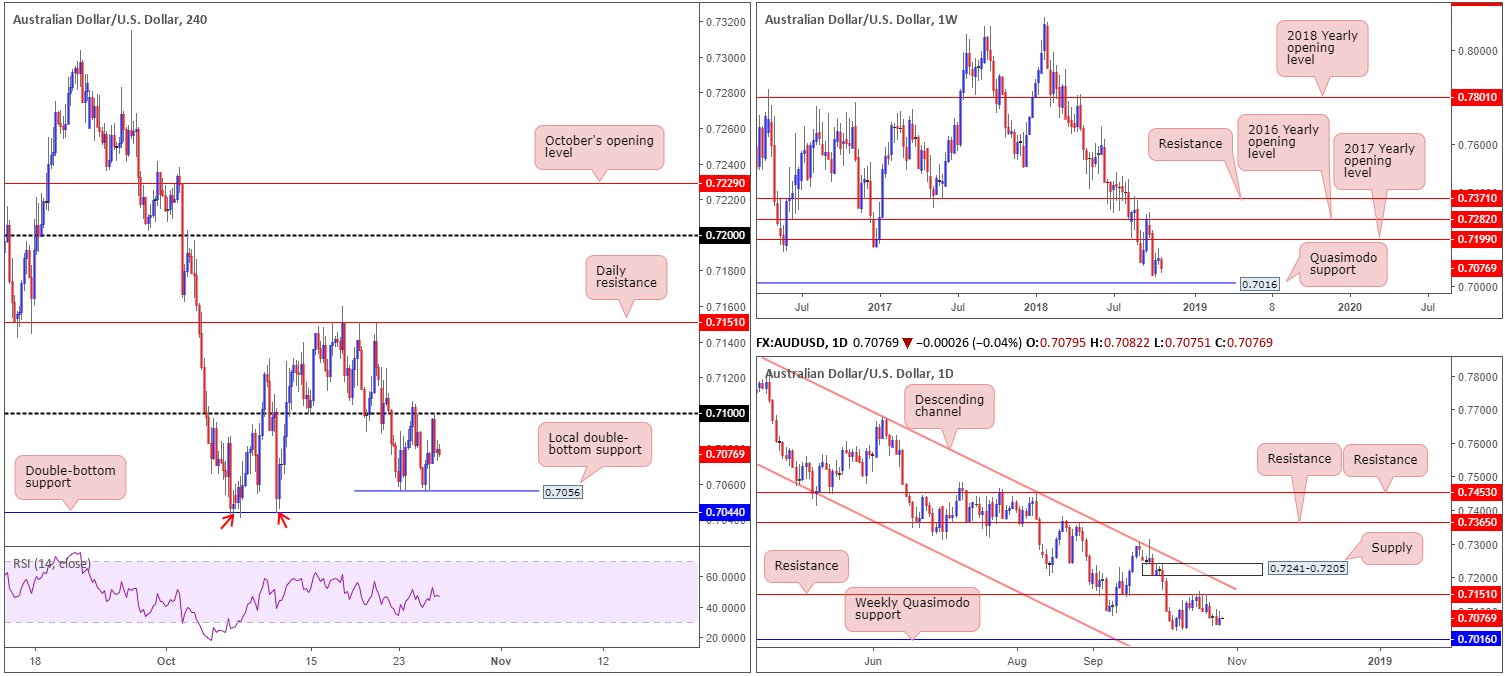
As is evident from the H4 timeframe this morning, the candles remain wedged underneath the 0.71 handle – proven to be a major technical level since mid-October. Traders may also want to note since Tuesday the AUD/USD has been busy carving out a local range between 0.71 and a nearby double-bottom support plotted at 0.7056. Areas outside of this border fall in at daily resistance drawn from 0.7151 and another layer of H4 double-bottom support seen at 0.7044.
In terms of where the market stands on the higher timeframes, weekly price is seen hovering between its 2017 yearly opening level at 0.7199 and a Quasimodo support at 0.7016. The story on the daily timeframe, similar to its weekly teammate, is also in a ranging environment flanked by the noted weekly Quasimodo support and the daily resistance level mentioned above at 0.7151.
Areas of consideration:
With both weekly and daily timeframes floating in no man’s land right now (in terms of structure that is), trading this market medium/long term is challenging.
Intraday –
Having seen a little over 40 pips of room to play with between the H4 local range at 0.71/0.7056, trading within this region is possible, though do keep risk/reward considerations at the forefront of the analysis (look to achieve at least a 1:1:5 ratio between the limits of the consolidation).
A H4 break above 0.71 followed up with a retest play by way of a bullish candlestick formation (entry/stop parameters can be defined by the candlestick structure) is likely enough to draw in buyers towards daily resistance at 0.7151.
Today’s data points: US growth figures q/q; US revised UoM consumer sentiment.
USD/JPY:
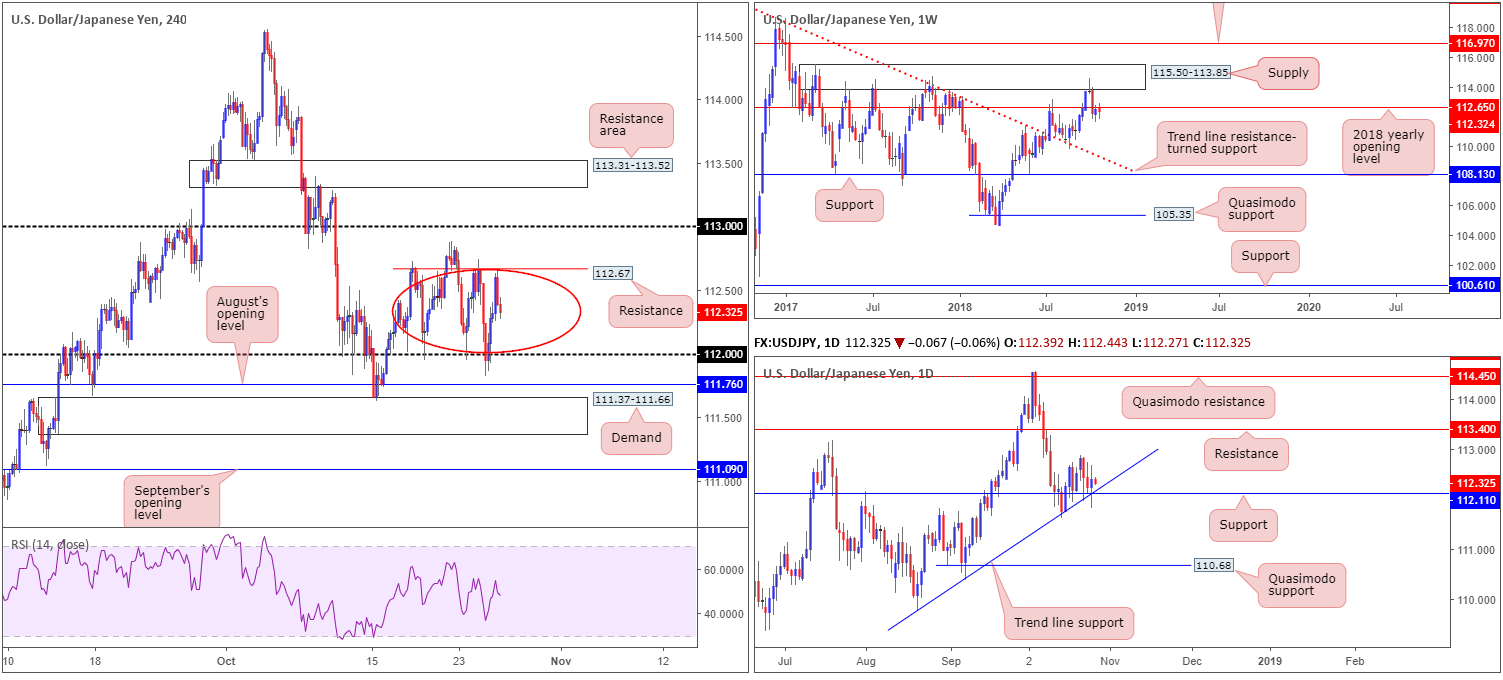
After mildly surpassing its 112 handle to lows just north of August’s opening level at 111.76 Thursday, the H4 candles witnessed a resurgence of bidding, though failed to conquer Wednesday’s high of 112.74. It may be worth noting local resistance is present around the 112.67ish region. In fact, you’ll notice a range has been forming since mid-October between this level and the 112 handle (red circle).
Daily support at 112.11, which happens to intersect with a trend line support (etched from the low 109.77) and essentially represents the 112 handle on the H4, remains intact, though has yet to really produce much action to the upside. Should the buyers regain consciousness from here, the next resistance hurdle on the radar can be seen around 113.40. Before pressing the buy button, though, it’s worth penciling in weekly price is engaging with the underside of its 2018 yearly opening level at 112.65 – a notable weekly resistance that denotes the same region as our local H4 resistance at 112.67.
Areas of consideration:
According to the weekly timeframe, the ducks are being lined up for a possible selloff, though price is finding it difficult to overcome buying pressure emanating from daily support mentioned above at 112.11.
With higher timeframes at war with one another, trading the H4 range between 112.67 and the 112 handle may be an option today (note this H4 range is effectively forming between the higher-timeframe levels currently in play). As there’s ample room to profit within this range (assuming risk/reward parameters are kept in check), waiting for additional candlestick confirmation (preferably on the H1/M30 timeframes – entry/stop parameters can be defined by the candlestick structure) is recommended. This helps avoid the risk of being taken out should price decide to fakeout to its surrounding levels: August’s opening base at 111.76 and the 113 handle.
Today’s data points: US growth figures q/q; US revised UoM consumer sentiment.
USD/CAD:
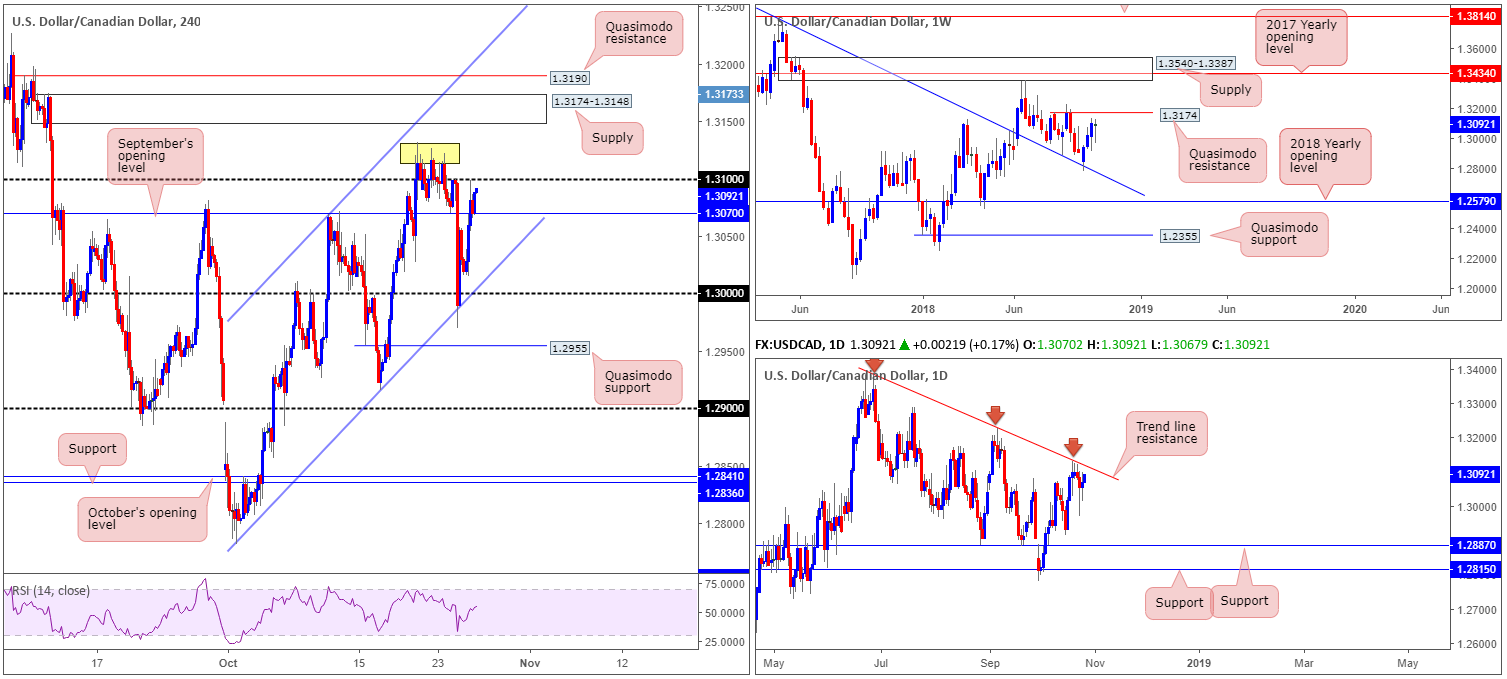
Erasing all of Wednesday’s losses (on the back of the BoC raising rates), Thursday’s movement gained traction amid broad-based USD buying. The H4 candles overthrew September’s opening level at 1.3070 and shook hands with its 1.31 handle in to the close. Beyond this point, a number of tops are visible (yellow) around the 1.3126 region, though intraday traders likely have their crosshairs fixed on nearby supply at 1.3174-1.3148, shadowed closely by a Quasimodo resistance at 1.3190.
According to our technical studies, the weekly timeframe still shows room to advance as far north as the Quasimodo resistance at 1.3174. Daily flow, on the other hand, is wedged underneath a trend line resistance (etched from the high 1.3386). Supportive structure from this area is not expected to emerge until 1.2887.
Areas of consideration:
Above 1.31, the H4 supply zone mentioned above at 1.3174-1.3148 and its neighbouring H4 Quasimodo resistance at 1.3190 are open for possible shorting opportunities today. Not only do we have a weekly Quasimodo resistance at 1.3174 intersecting with the top edge of the H4 supply, there’s also a daily trend line resistance in view as well (see above). Irrespective of whether one selects the H4 supply to sell or the H4 Quasimodo, stop-loss order placement above the apex of the H4 Quasimodo (1.3198) is a feasible option. In terms of take-profit targets, the 1.31 handle is (without seeing the approach) a logical first step.
Today’s data points: US growth figures q/q; US revised UoM consumer sentiment.
USD/CHF:
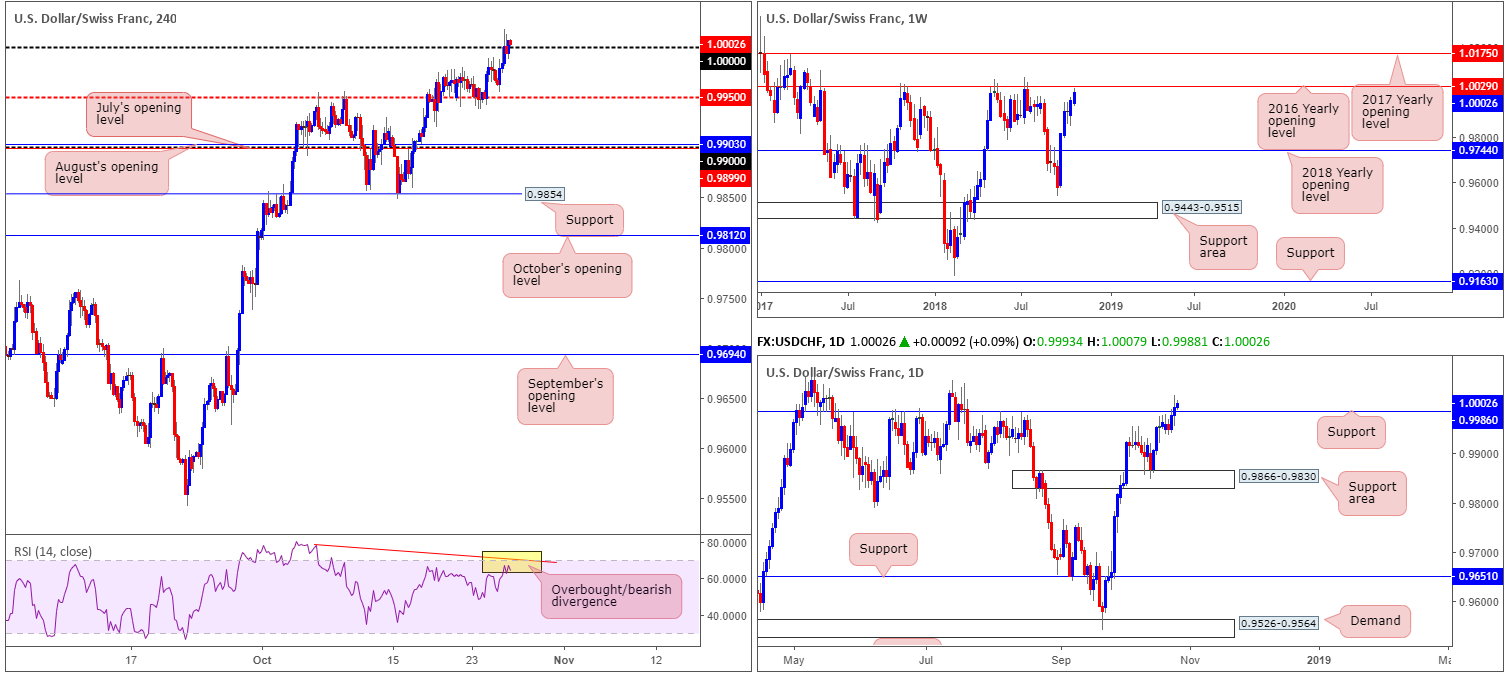
Kicking off with a look over weekly structure, price is seen fast approaching its 2016 yearly opening level at 1.0029. Note this level boasts incredibly strong history. In 2017 the base held price lower on two occasions and twice already in 2018.
Daily resistance at 0.9986 suffered a breach Thursday, likely clearing out selling interest from this region and unlocking the runway north towards the 2016 yearly opening level mentioned above on the weekly timeframe at 1.0029.
A closer look at price action on the H4 timeframe shows parity (1.0000) entered the fight yesterday. Given price struck highs of 1.0018, levels not seen since July 2018, one can only visualize the pain this move caused for those attempting to fade parity. With the majority of sellers likely cleared from this angle, and breakout buyers’ orders filled, the unit could observe additional upside today, targeting 1.0029. It might also interest some traders to note the RSI indicator is currently displaying an overbought/bearish divergence reading.
Areas of consideration:
For traders who remain short from 0.9986 (a setup discussed in Wednesday’s briefing), there’s little you can do but hang in there as stops should still be tucked above 1.0029.
Attempting to buy above parity may be good for a small intraday bounce, though remain aware strong selling likely resides around the 1.0029 weekly resistance!
Ultimately, in view of its history, 1.0029 will likely hinder upside movement. To confirm bearish intent from this neighbourhood, however, consider waiting for H4 price to reclaim parity to the downside. A retest to the underside of this number by way of a bearish candlestick formation is a high-probability setup in light of where we’re coming from on the bigger picture.
Today’s data points: US growth figures q/q; US revised UoM consumer sentiment.
Dow Jones Industrial Average:
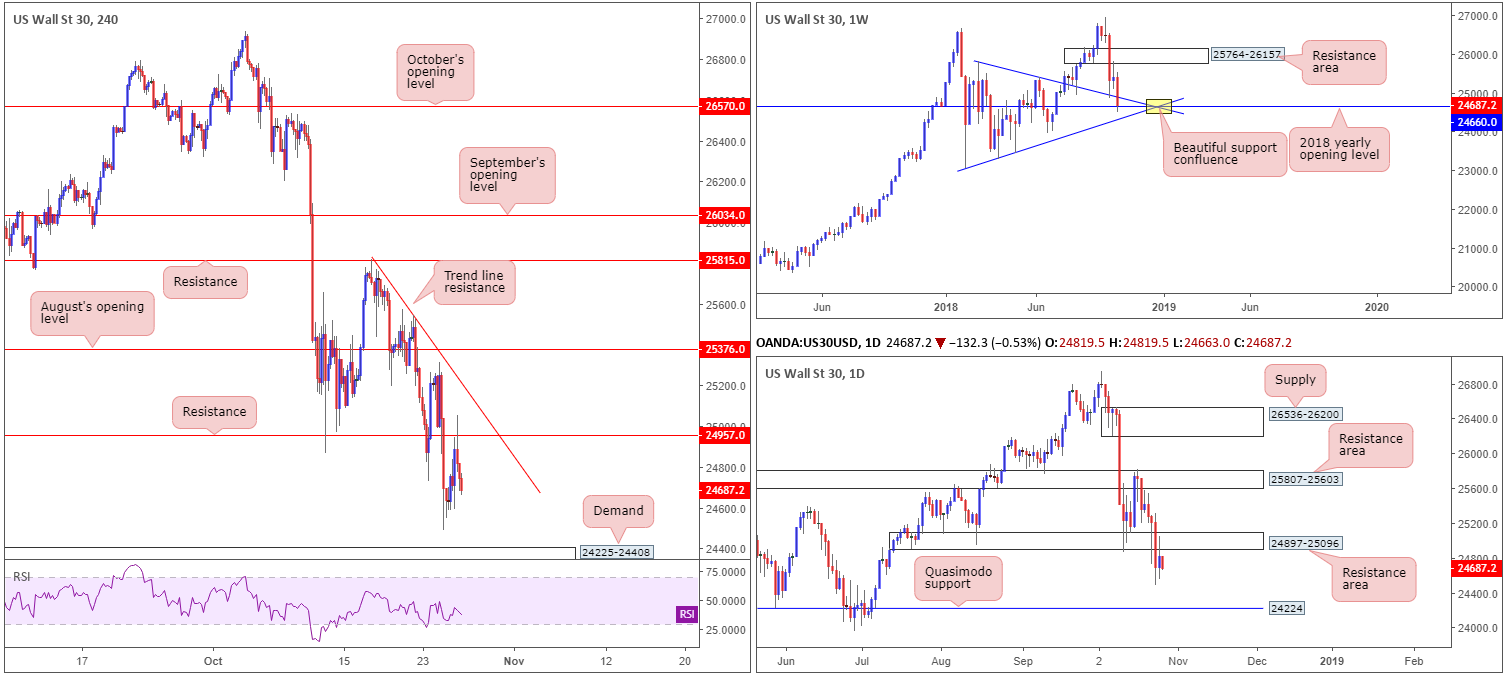
Following Wednesday’s precipitous decline, Thursday’s movement attempted to reclaim some of its lost ground on the back of strong earnings. Despite the fact the move was bolstered by the 2018 yearly opening level at 24660 plotted on the weekly timeframe, price action met strong selling pressure from H4 resistance at 24957, which happens to be encased within the walls of a daily resistance area at 24897-25096.
Besides Wednesday’s low 24489, there’s little in the way of support on the H4 scale until we reach demand penciled in at 24225-24408. In terms of the daily picture, reinforcing the underside of the current H4 demand we can see a daily Quasimodo support at 24224.
Areas of consideration:
While the 2018 yearly opening level at 24660 has every chance of holding ground and pushing higher, traders are urged to pencil in the weekly trend line support surfacing just beneath it (extended from the low 24182). Not only is this a valid trend line support, it also fuses beautifully with the daily Quasimodo support mentioned above at 24224, which itself holds H4 demand at 24225-24408. Therefore, attention is driven towards this region for possible longs today/next week in the event we push lower.
A long from the top edge of H4 demand at 24408, with stops tucked beneath the daily Quasimodo support at 24224 is an option. For conservative traders, however, waiting for additional candlestick confirmation to form around the H4 demand is an alternative play (entry/stop parameters can be defined by the candlestick structure).
Today’s data points: US growth figures q/q; US revised UoM consumer sentiment.
XAU/USD (Gold):
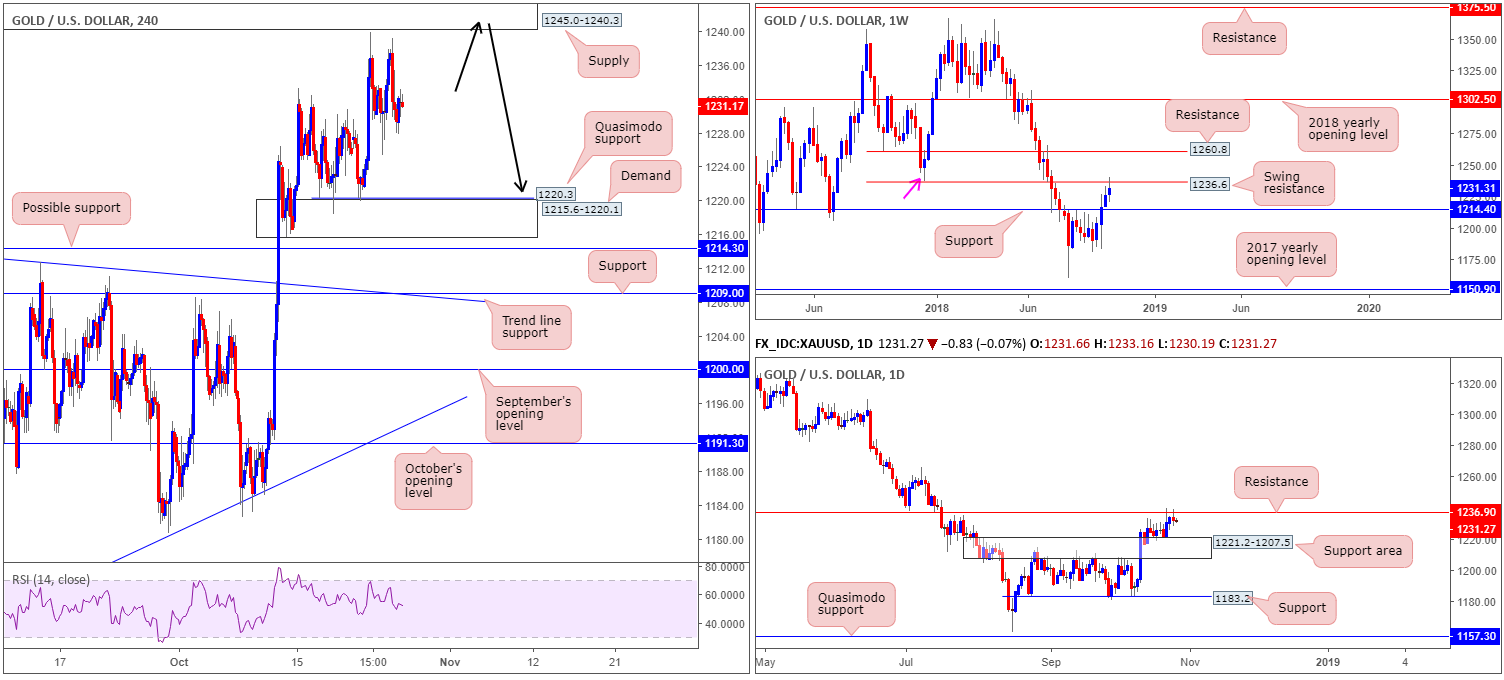
The general sense from the higher-timeframe picture at the moment is ‘resistance’, and a possible pullback. On the weekly timeframe, we can see price action testing swing resistance (pink arrow) at 1236.6, which essentially represents daily resistance at 1236.9. In regard to supportive structure, the top edge of a daily support area at 1221.2 is first in line to the downside, followed then by weekly support at 1214.4.
The H4 supply zone coming in at 1245.0-1240.3 remains an area of interest for possible shorting opportunities. This is largely due to the strong drop out of the supply area’s base (mid-July 2018), as well as being positioned within close proximity to the higher-timeframe resistances highlighted above.
Areas of consideration:
As emphasized in previous reports, traders have several options here in regards to entering short from the current H4 supply area. Here’s two:
- Entering short at (market) 1240.3 and locating stops above 1245.0. This is considered aggressive to some traders.
- For some of the more conservative traders, waiting for additional candlestick confirmation and entering based on this structure is an option.
As for take-profit targets, traders might want to pencil down the H4 Quasimodo support at 1220.3, positioned a few pips south of 1221.2: the next downside target on the daily scale – the top edge of a daily support area.
The use of the site is agreement that the site is for informational and educational purposes only and does not constitute advice in any form in the furtherance of any trade or trading decisions.
The accuracy, completeness and timeliness of the information contained on this site cannot be guaranteed. IC Markets does not warranty, guarantee or make any representations, or assume any liability with regard to financial results based on the use of the information in the site.
News, views, opinions, recommendations and other information obtained from sources outside of www.icmarkets.com.au, used in this site are believed to be reliable, but we cannot guarantee their accuracy or completeness. All such information is subject to change at any time without notice. IC Markets assumes no responsibility for the content of any linked site. The fact that such links may exist does not indicate approval or endorsement of any material contained on any linked site.
IC Markets is not liable for any harm caused by the transmission, through accessing the services or information on this site, of a computer virus, or other computer code or programming device that might be used to access, delete, damage, disable, disrupt or otherwise impede in any manner, the operation of the site or of any user’s software, hardware, data or property.


