
EUR/USD:
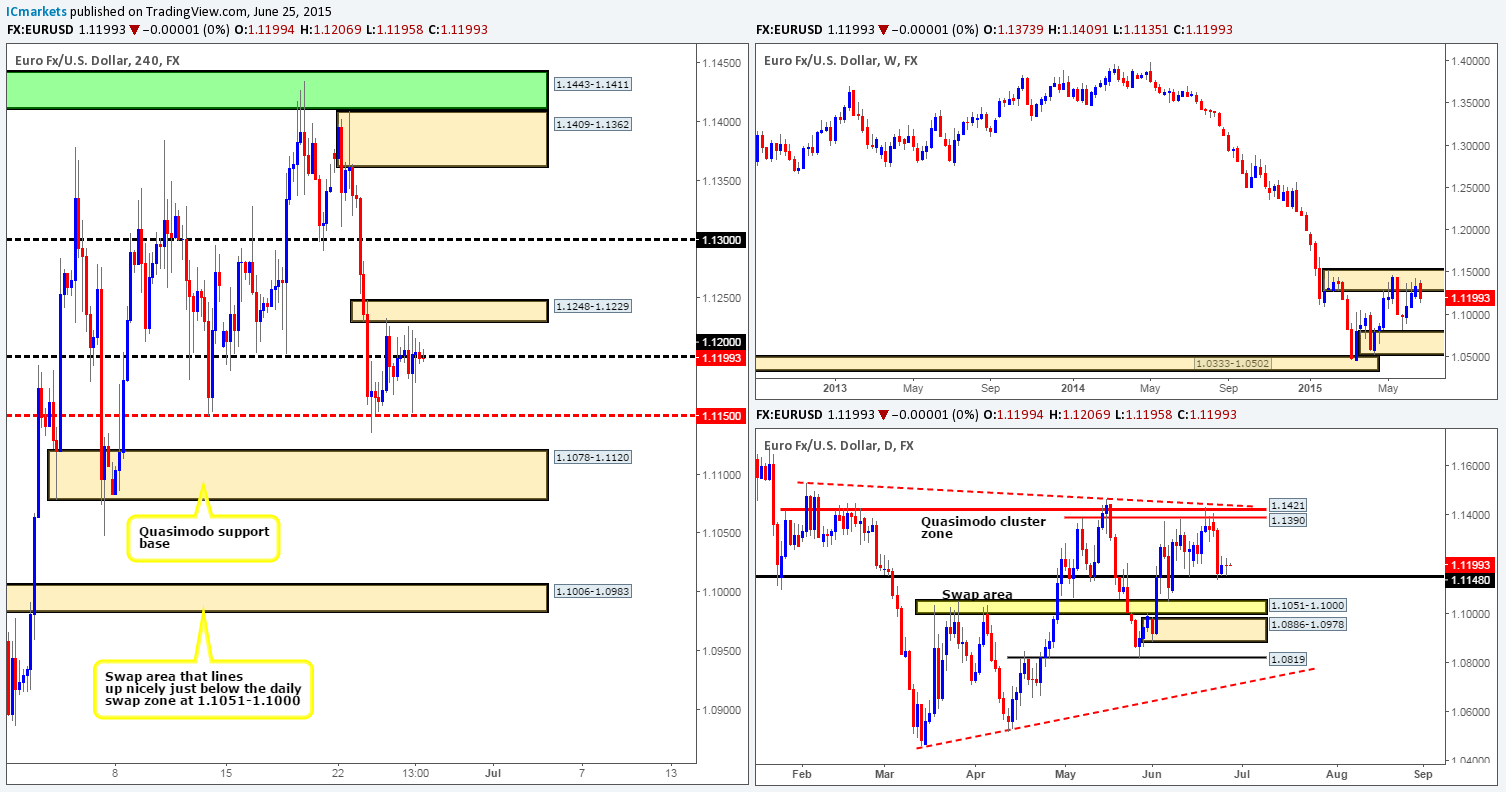
Weekly view: From the weekly timeframe, we can see that price is currently selling off from the weekly supply area coming in at 1.1532-1.1278. This supply zone, however, is a very significant hurdle in our opinion (held gold lower since the 11th May) since if there’s a sustained break above this area, our long-term bias (currently short) on this pair will very likely shift north.
Daily view: (Slightly revised) The daily timeframe on the other hand, shows that price is being supported by a daily swap level at 1.1148. However, buy-side liquidity appears weak here – we only have to look at Wednesday’s attempt to rally and the daily indecision candle that formed during yesterday’s session to see this.
4hr view: Greek negotiations continue, and rumors are spreading that there will be another emergency meeting held over the weekend, but market participants have not responded positively to this given the progress made in past.
Price appears to be clinging to 1.1200 at the moment, which as you can see is sandwiched in between 1.1248-1.1229 – a small 4hr supply area, and the mid-level number 1.1150. Given the uncertainty looming over this market, we’re going to play it safe and only look for small intraday moves at the limits (tentative buys seen at 1.1155, sells at 1.1223) of this current 4hr range today. As most are already aware fakeouts are common within consolidative environments such as this, so waiting for the lower timeframes to confirm your entry is highly recommended.
Levels to watch/live orders:
- Buys: 1.1155 [Tentative – confirmation required] (Stop loss: dependent on where one confirms this level).
- Sells: 1.1223 [Tentative – confirmation required] (Stop loss: 1255).
GBP/USD:
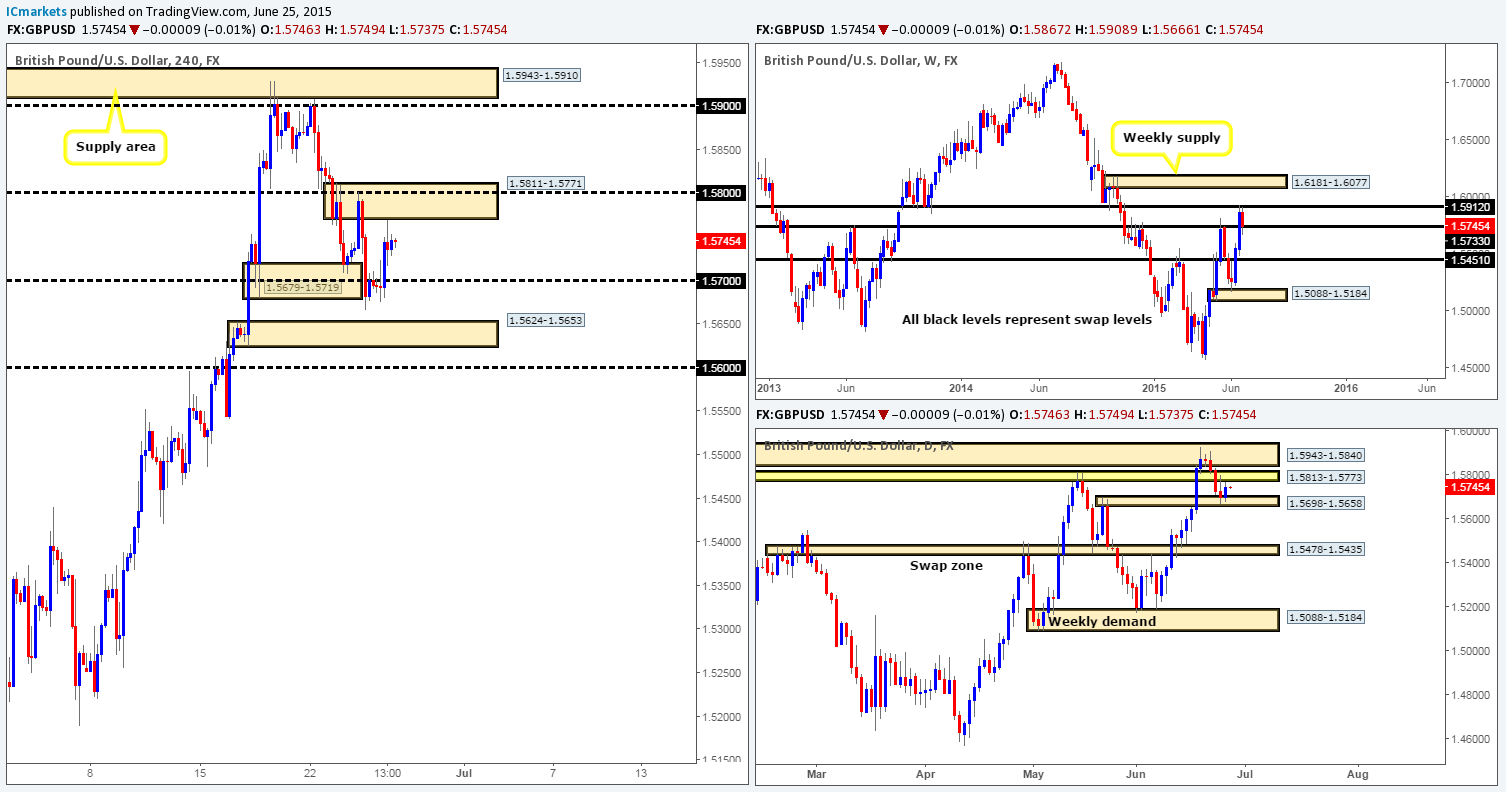
Weekly view – The recent selling seen from the weekly swap level at 1.5912 has forced this market to test 1.5733 – another weekly swap level. Should this barrier give way, we’d then be quite confident that the GBP would continue to sell off down to at least the 1.5451 region.
Daily view: The daily timeframe on the other hand, shows that buying interest came into the market yesterday from a daily swap area at 1.5698-1.5658 (located just below the weekly swap level mentioned above at 1.5733). As you can see, this resulted in price retesting the recently broken daily swap area at 1.5813-1.5773 for the second time this week.
4hr view: Following the break below the combined 4hr demand/round number area at 1.5679-1.5719/1.5700 (positioned around the daily swap area mentioned above at 1.5698-1.5658), the GBP rallied north yesterday, consequently attacking the lower limits of a combined 4hr supply/round number area at 1.5811-1.5771/1.5800 (positioned within the daily swap area mentioned above at 1.5813-1.5773).
Given the points made above in bold, we have decided to only trade (confirmed) short-term intraday moves on this pair for the time being, at least until we begin seeing clearer (less congested) price action on the higher timeframes.
Zones we have noted for potential shorts come in at:
- The 4hr supply area at 1.5811-1.5771.
Zones we have noted for potential longs come in at:
- The round number 1.5700.
- The 4hr demand area at 1.5624-1.5653.
Levels to watch/ live orders:
- Buys: 1.5700 [Tentative – confirmation required] (Stop loss: dependent on where one confirms this level) 1.5624-1.5653 [Tentative – confirmation required] (Stop loss: 1.5617).
- Sells: 1.5811-1.5771 [Tentative – confirmation required] (Stop loss: 1.5816).
AUD/USD:
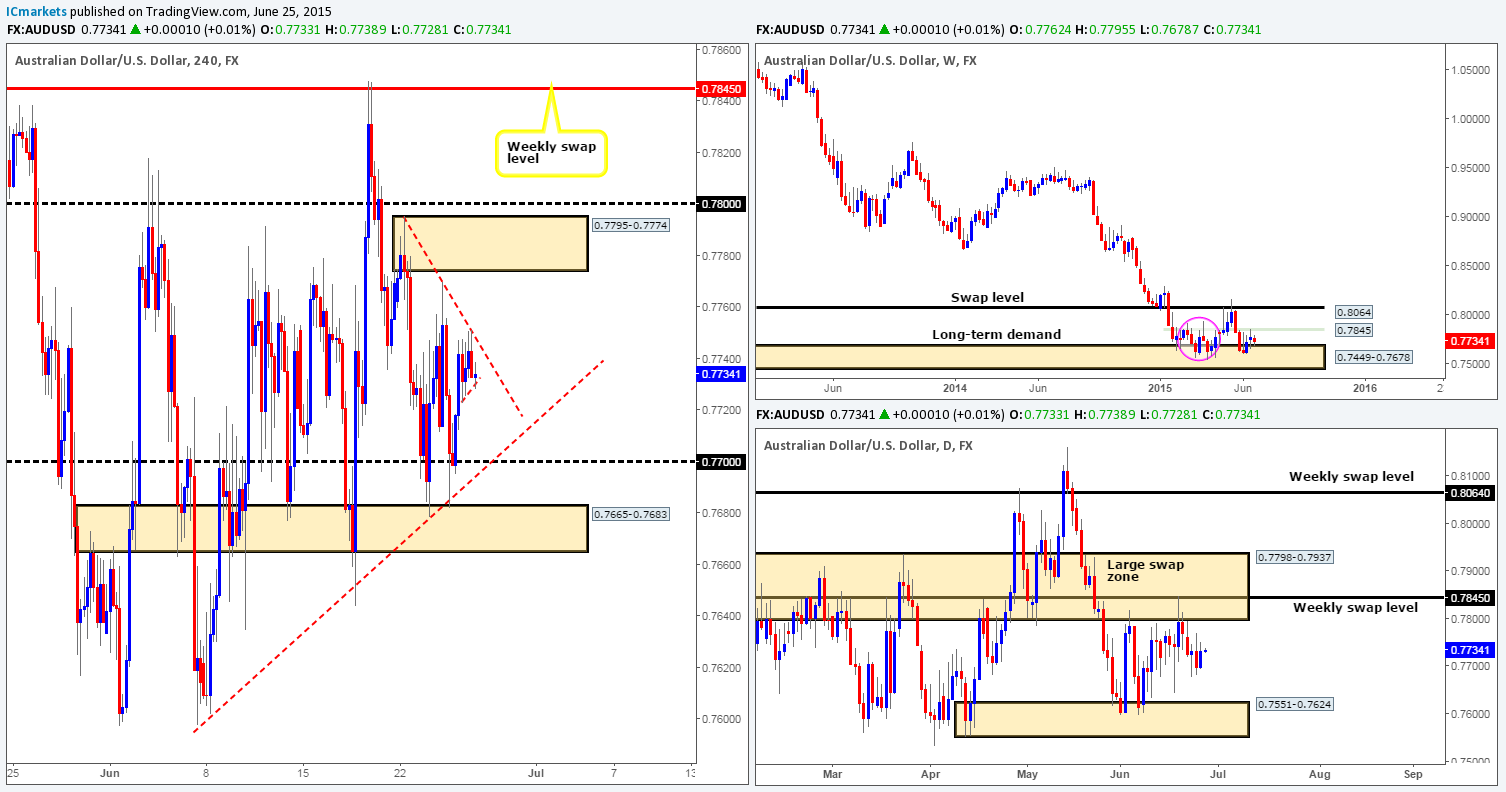
Weekly view – Following the rebound seen from the long-term weekly demand area at 0.7449-0.7678, price connected with a minor weekly swap level coming in at 0.7845 last week, consequently forming a weekly indecision candle. Judging by the sloppy reaction seen (pink circle – 02/02/15-06/04/15) between these two aforementioned weekly areas a few months ago, things could potentially get messy here again before we see any decisive move take place. From a long-term perspective, nonetheless, the trend direction on this pair is still very much south in our opinion, and will remain this way until we see a convincing break above 0.8064.
Daily view: From the pits of the daily scale, we can see that price has begun to consolidate (mid-range at the time of writing) between 0.7798-0.7937 (a large daily swap zone that surrounds the aforementioned weekly swap level), and 0.7551-0.7624 (a daily demand area that is located within the aforementioned weekly demand zone).
4hr view: Not too long after price faked below the 0.7700 handle into the 4hr swap zone at 0.7665-0.7683, the AUD rallied and connected with a 4hr downtrend line taken from the high 0.7795. Consequent to this, the buyers and sellers spent the rest of yesterday’s sessions battling for position just below this line.
Seeing as we’re not receiving much Intel from the higher timeframe picture at the moment (see above), we’re only going to be looking for small intraday moves during today’s sessions.
Selling from the current 4hr downtrend line is certainly a possibility today. However, until the ascending 15 minute trendline extended from the low 0.7722 is consumed, we would not be confident in shorting this market.
With regards to longs, our team has come to a general consensus that until price convincingly pushes above the current 4hr downtrend line, or touches gloves with the round number 0.7700 (lower timeframe confirmation will be needed here), there will be no buy trades initiated on this pair.
Levels to watch/ live orders:
- Buys: 0.7700 region [Tentative – confirmation required] (Stop loss: dependent on where one confirms this level).
- Sells: Flat (Stop loss: N/A).
USD/JPY:
Weekly view – From this angle, we can see that price is currently floating in between 125.44 and 121.57. From a long-term perspective, however, the uptrend on this pair is still very much intact, and will remain this way in our opinion until the weekly swap level 115.50 is consumed.
Daily view: Following Wednesday’s bearish pin-bar candle that formed just below 124.34 (last Wednesday’s high), price extended lower during yesterday’s session dropping to a low of 123.31.
4hr view: Yesterday’s action shows that price broke out below the small 4hr range (124.00/123.80), and (as expected) headed south to test the 123.32 level which held firm going into the London session.
With the USD/JPY now effectively trading mid-range between 123.80 and 123.32, there is no immediate opportunity to trade this pair as far as we can see. Therefore, the best thing we believe we can do is to watch the following levels for potential short-term bounce trades today and close the week out flat:
Buys:
- The 4hr swap level at 123.32.
- The round number at 123.00.
- The 4hr demand area at 122.44-122.75.
Sells:
- The 4hr swap level at 123.80.
- The round number 124.00.
- The 4hr supply area at 124.72-124.46. If price reaches this high, be prepared for the possibility that a fakeout higher may take place up to the green 4hr Quasimodo base at 125.04-124.86.
Just to be clear here guys, we have no plan to set pending orders at either of the above areas, and remember these levels are only for short-term moves so targets (for us) will be kept small. In addition to this, lower timeframe confirmation will also be required before we’d consider risking capital on a trade.

Levels to watch/ live orders:
- Buys: 123.32 [Tentative – confirmation required] (Stop loss: dependent on where one confirms this level) 123.00 [Tentative – confirmation required] (Stop loss: dependent on where one confirms this level) 122.44-122.75 [Tentative – confirmation required] (Stop loss: 122.40).
- Sells: 123.80 [Tentative – confirmation required] (Stop loss: dependent on where one confirms this level) 124.00 [Tentative – confirmation required] (Stop loss: dependent on where one confirms this level) 124.72-124.46 [Tentative – confirmation required] (Stop loss: 124.73).
USD/CAD:
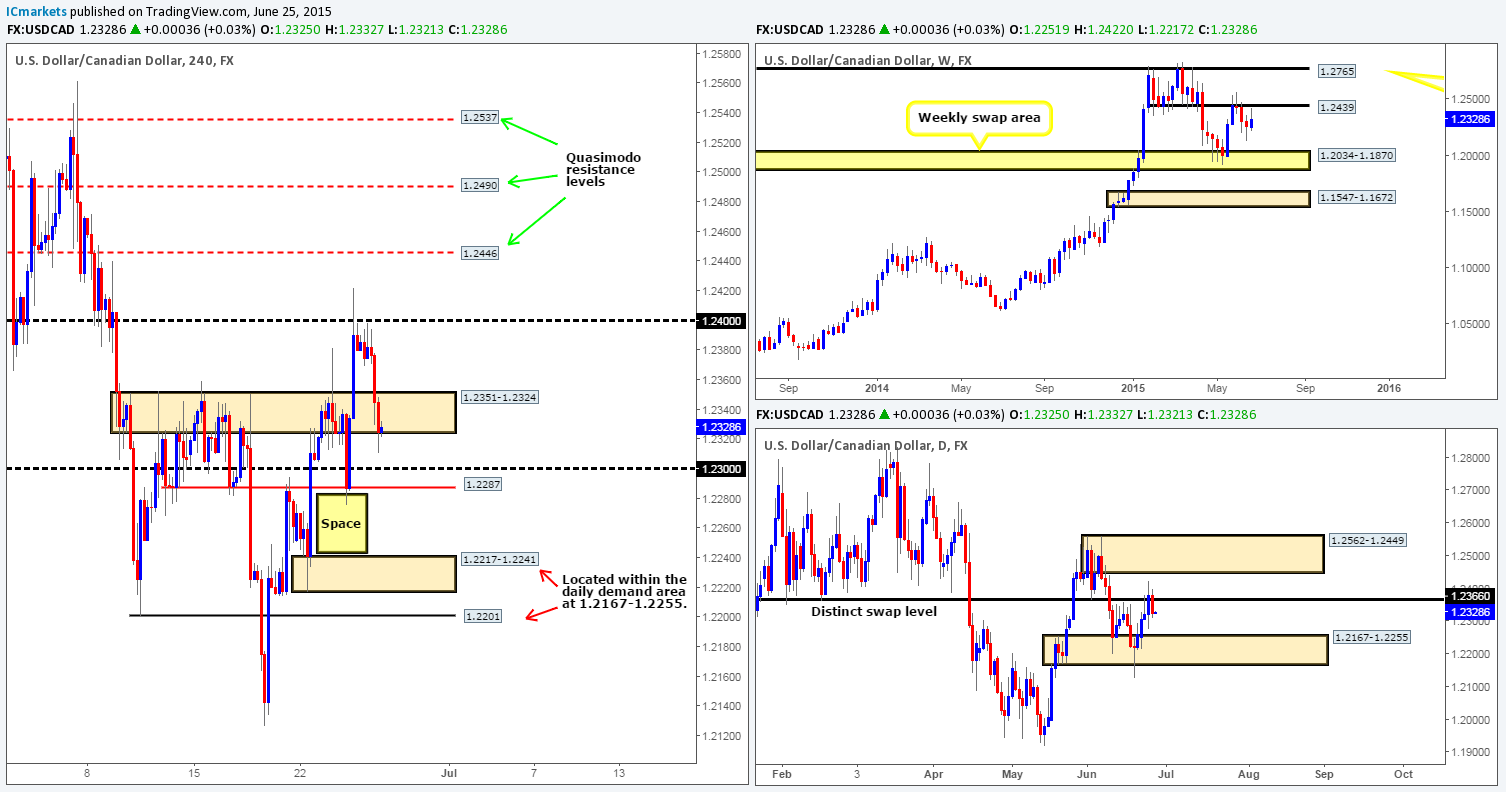
Weekly view – From this angle, we can see that price is trading just below a weekly swap level coming in at 1.2439. With that being said though, our long-term bias on this pair remains long, and it will only be once/if we see a break below the weekly swap area at 1.2034-1.1870 would our present bias likely shift.
Daily view: Following Wednesday’s close above the daily swap level at 1.2366, price reversed yesterday and closed back below this barrier. Should this bearish momentum continue into today’s session, it is likely we’ll see price challenge the daily demand area at 1.2167-1.2255 once again.
4hr view: The recent descent on this pair saw price dive head first into a 4hr swap area coming in at 1.2351-1.2324, which at the time of writing seems to be holding. Buying from this area today, however, could be risky for two reasons:
- Little to no higher timeframe support being seen around this zone (see charts).
- The 1.2300 round number positioned just below will likely be a magnet to pull price lower.
With that in mind, our team would much rather wait to see if price can drop down to the 4hr demand area at 1.2217-1.2241, or even the 4hr Quasimodo support level just below it at 1.2201 before considering longs, since both zones are located nicely within the aforementioned daily demand area.
Selling on the other hand will only be permitted on the break of 1.2287, as this would likely open the gates for further downside towards the aforementioned 4hr demand area. Nonetheless, for us to commit capital here, we’d need to see a retest of this area as resistance with corresponding lower timeframe confirmation.
Levels to watch/ live orders:
- Buys: 1.2217-1.2241 [Tentative – confirmation required] (Stop loss: 1.2211) 1.2201 [Tentative – confirmation required] (Stop loss: dependent on where one confirms this level).
- Sells: Flat (Stop loss: N/A).
USD/CHF:
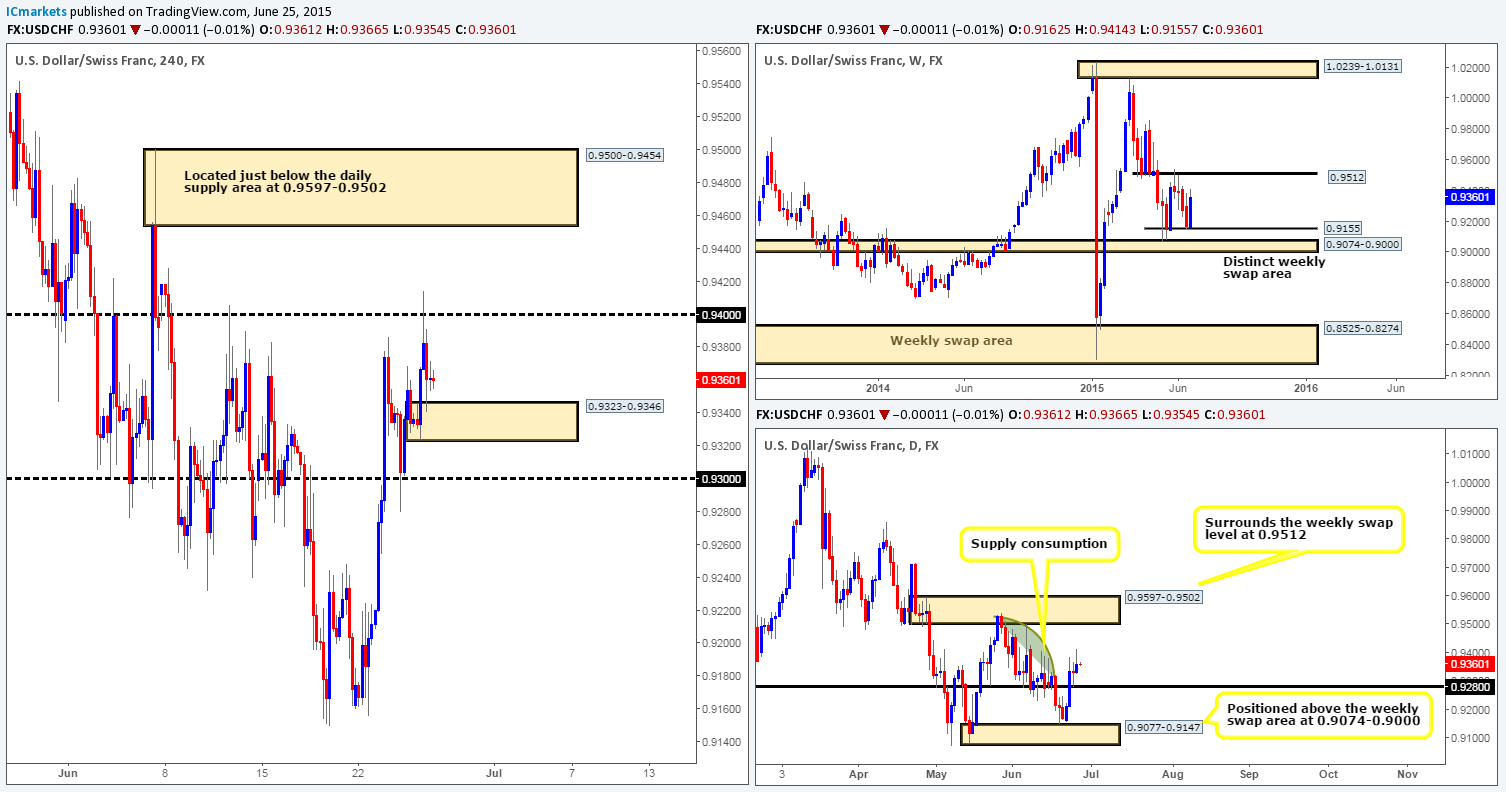
Weekly view – The view from the weekly timeframe is currently bullish with price finding support around the 0.9155 mark. Continued buying from here could see the market connect with 0.9512 – a proven weekly swap level.
Daily view: Following Wednesday’s indecision candle which formed with the help of 0.9280, price drove higher yesterday. As a consequence, this market has now projected further into a consumption zone (the green arc pattern). By consumption zone we simply mean an area where we feel (in this case) supply has already been taken out at least until the daily supply area seen at 0.9597-0.9502.
4hr view: The recent advance saw an attack on the 0.9400 number, which as expected, was strong enough to hold the market lower and force price to cross swords with a 4hr demand area at 0.9323-0.9346. Given that both the weekly and daily timeframes are showing support with room to move further north (see above) at the moment, today’s spotlight will firmly be focused on longs.
The vicious spike above 0.9400 likely took out the vast majority of sellers residing there, thus potentially weakening this level. For this reason, should we see the 4hr demand area at 0.9323-0.9346 continue to hold firm, we may, if lower timeframe buying confirmation is seen, enter long targeting 0.9400. We would usually target higher levels under normal circumstances and be prepared to let the trade run, but with the Greek negotiations due to continue into the weekend, leaving short-term positions open is a very risky game indeed, and not one we intend to play.
Levels to watch/ live orders:
- Buys: 0.9323-0.9346 [Tentative – confirmation required] (Stop loss: 0.9317).
- Sells: Flat (Stop loss: N/A).
US 30:
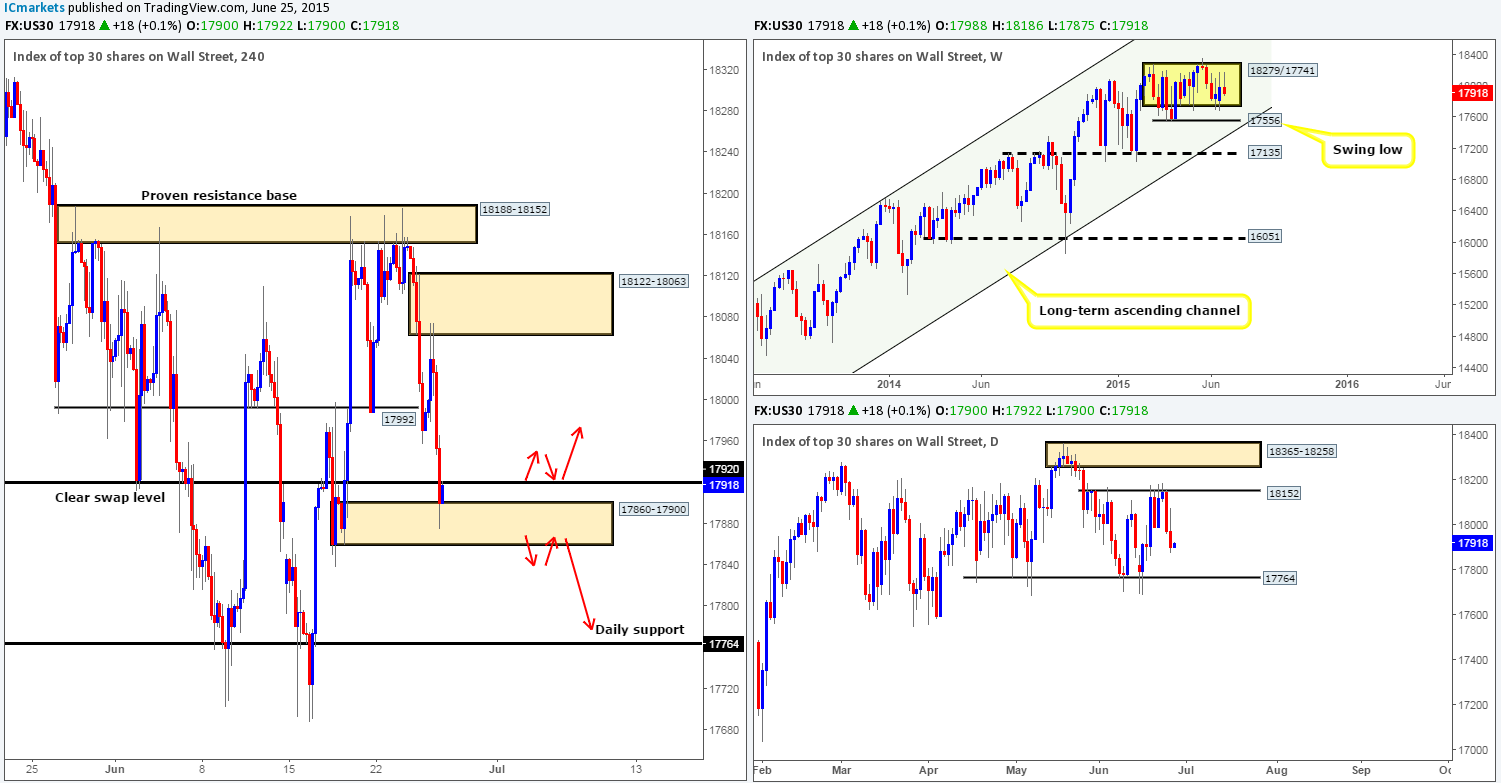
Weekly view – The weekly timeframe shows that the DOW continues to consolidate (currently mid-range) between 18279/17741 (yellow rectangle). From a longer-term perspective, however, the overall uptrend on this index is still very strong, and will remain this way in our opinion until we see a convincing push below 16051.
Daily view: Following Wednesday’s rebound from the daily resistance level at 18512, price extended lower yesterday dipping to a low of 17875. Should further selling be seen today, we may see price challenge the daily support level coming in at 17764.
4hr view: The 4hr timeframe reveals that before price rallied yesterday, London traders pushed this market north to connect with a 4hr supply area at 18122-18063, which as you can see is where the selloff begun. During the decline, price chomped its way through a clear 4hr swap level at 17920, and collided with a 4hr demand area seen just below it at 17860-17900.
Buying this market from here is not something we’d consider high probability, since there is no higher timeframe support backing this 4hr demand area, and price has yet to clear the recently broken 4hr swap level (now acting resistance) at 17920. Should 17920 be taken out today, however, and a confirmed retest seen, we may consider an intraday long position up to the 17970 region (as per the upper red arrows).
With regards to selling today, we’d need to see a convincing push below the current 4hr demand area before shorting this market becomes an option. In the event a break lower is seen, price would need to (i) retest this area as supply, and (ii) show some sort of lower timeframe selling signal such as, an engulf of demand, or a trendline break etc… Targets for any shorts would be the daily support level seen at 17764 (as per the lower red arrows).
Levels to watch/ live orders:
- Buys: Flat (Stop loss: N/A).
- Sells: Flat (Stop loss: N/A).
XAU/USD (Gold)
Weekly view – The weekly timeframe shows that gold is now effectively range bound between a weekly resistance barrier at 1223.1-1204.5 and a weekly demand area at 1142.5-1167.3. From a long-term perspective, however, gold is still trending south in our opinion, and It will only be once/if we see a close above the weekly trendline extended from the high 1488.0 would we begin to feel that this market may be reversing.
Daily view: From this angle, we can see that price is currently teasing the lower limits of a daily buy zone at 1170.3-1184.0.
4hr view: Technically the market has not seen much change from when we last analyzed this pair, and as such, most of the following analysis will be similar to the previous…
Considering the market’s overall position on the higher timeframes (see above) at the moment, our team is naturally focusing more on looking for longs at present. The long-term 4hr swap level seen at 1170.4 (represents the lower limit of the aforementioned daily buy zone) has so far been able to hold this market higher. Nevertheless, to buy based on this alone when there is a clearly reactive 4hr supply area sitting just above at 1180.1-1177.8 would not be something our team would label high probability.
Ultimately, we’re looking for price to break above this newly-formed 4hr supply area, as this would likely pave the way north up to the 4hr supply zone at 1188.0-1185.5 (an ideal take-profit target). This would not only give us confidence to begin looking to buy any dips seen (as per the red arrows), but also likely confirm buying strength from both the daily buy zone and the lower limit of the weekly range (see above).

Levels to watch/ live orders:
- Buys: Flat (Stop loss: N/A).
- Sells: Flat (Stop loss: N/A).


