
Waiting for lower timeframe confirmation is our main tool to confirm strength within higher timeframe zones, and has really been the key to our trading success. It takes a little time to understand the subtle nuances, however, as each trade is never the same, but once you master the rhythm so to speak, you will be saved from countless unnecessary losing trades. The following is a list of what we look for:
- A break/retest of supply or demand dependent on which way you’re trading.
- A trendline break/retest.
- Buying/selling tails/wicks – essentially we look for a cluster of very obvious spikes off of lower timeframe support and resistance levels within the higher timeframe zone.
We typically search for lower-timeframe confirmation between the M15 and H1 timeframes, since most of our higher-timeframe areas begin with the H4. Stops are usually placed 1-3 pips beyond confirming structures.
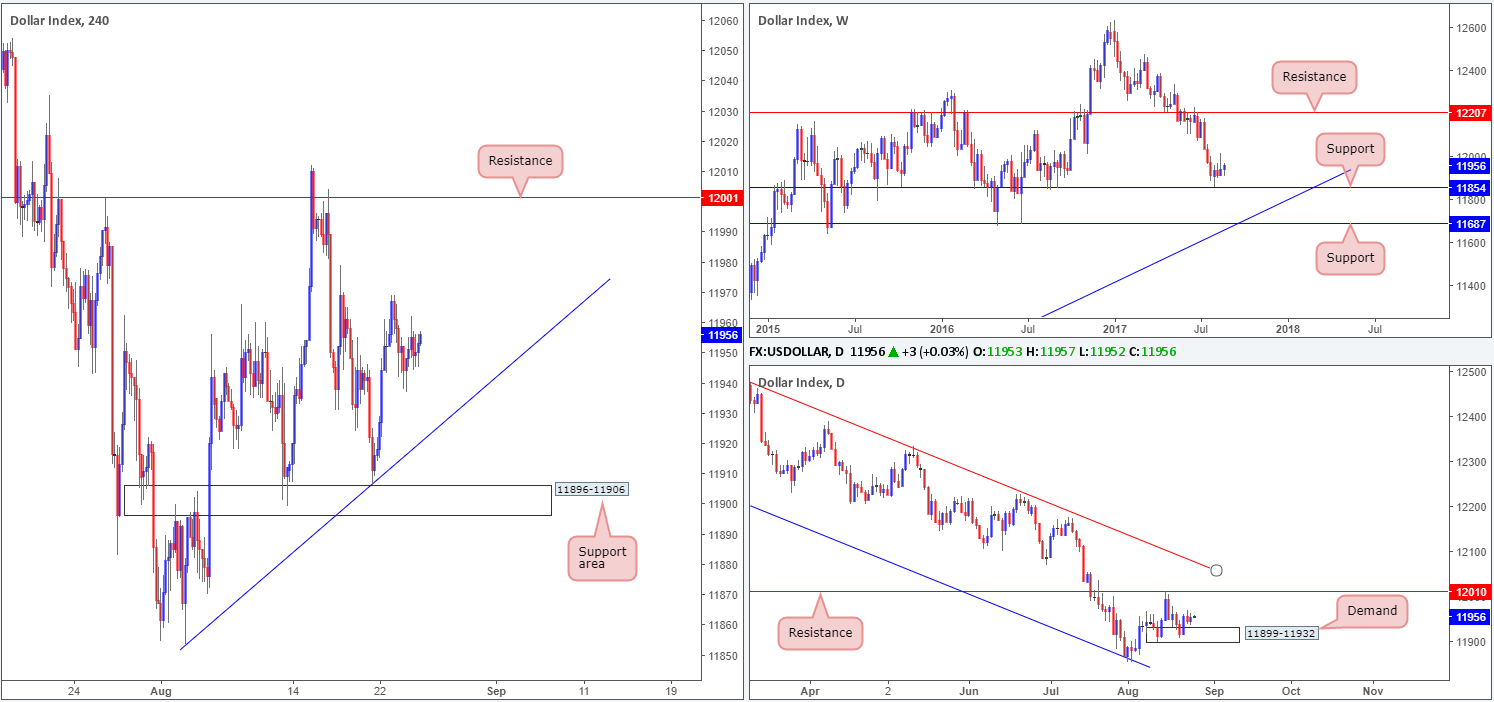
US dollar index (USDX):
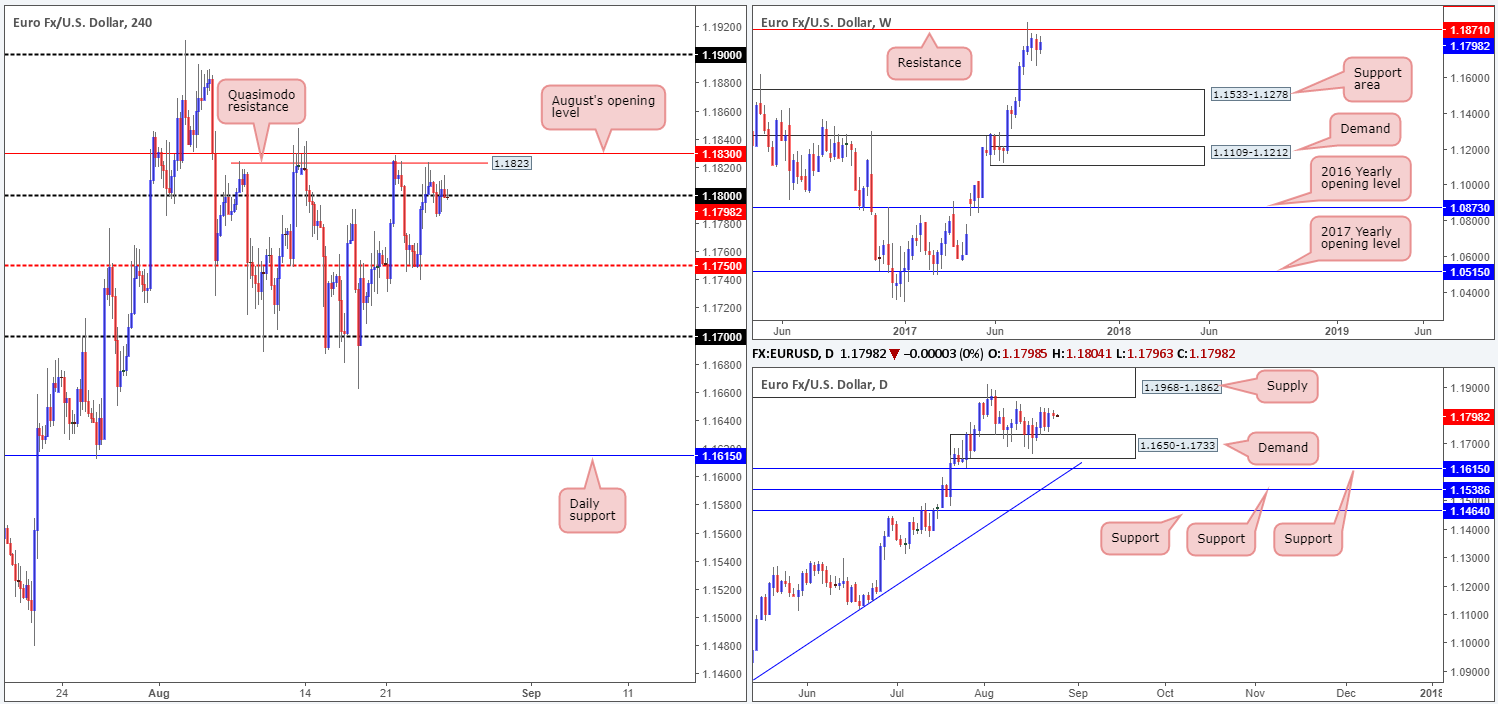
EUR/USD:
In recent trading we can see that price took on more of a sober approach on Thursday. Clinging to the 1.18 handle, the pair only managed to range a mere 33 pips on the day. In light of the somewhat lackluster approach, we continue to follow a neutral bias in this market. Here’s why.
Directly above current price there’s a nearby H4 Quasimodo resistance level at 1.1823 (shadowed closely by August’s opening level at 1.1830). However, considering that the USDX shows room for the H4 candles to push down as far as the trendline support extended from the low 11853, we may see the two noted H4 resistances give way sometime today.
The story over on the weekly chart shows that the buyers and sellers remain battling for position below a major resistance at 1.1871. A similar picture can be seen on the US dollar index (USDX), only inverse from a weekly support drawn in at 11854. Looking down to the daily timeframe, price is currently seen sandwiched between a supply zone coming in at 1.1968-1.1862 and a demand base lodged at 1.1650-1.1733.
Suggestions: A decisive close above 1.1830 on the H4 chart likely clears the footpath north up to the 1.19 band. While this may be true on the H4 timeframe, the bigger picture shows we have both the underside of the current daily supply at 1.1862 and the weekly resistance at 1.1871 to contend with before 1.19 can be achieved. This, for us, makes buying beyond 1.1830 just too much of a risk, and therefore a market best left on the back burner for the time being.
Data points to consider: German IFO business climate survey at 9am, ECB President Draghi speaks at 8pm. US Core durable goods orders at 1.30pm, Fed Chair Yellen speaks at 5pm GMT+1. US Jackson Hole symposium (all day).
Levels to watch/live orders:
- Buys: Flat (stop loss: N/A).
- Sells: Flat (stop loss: N/A).
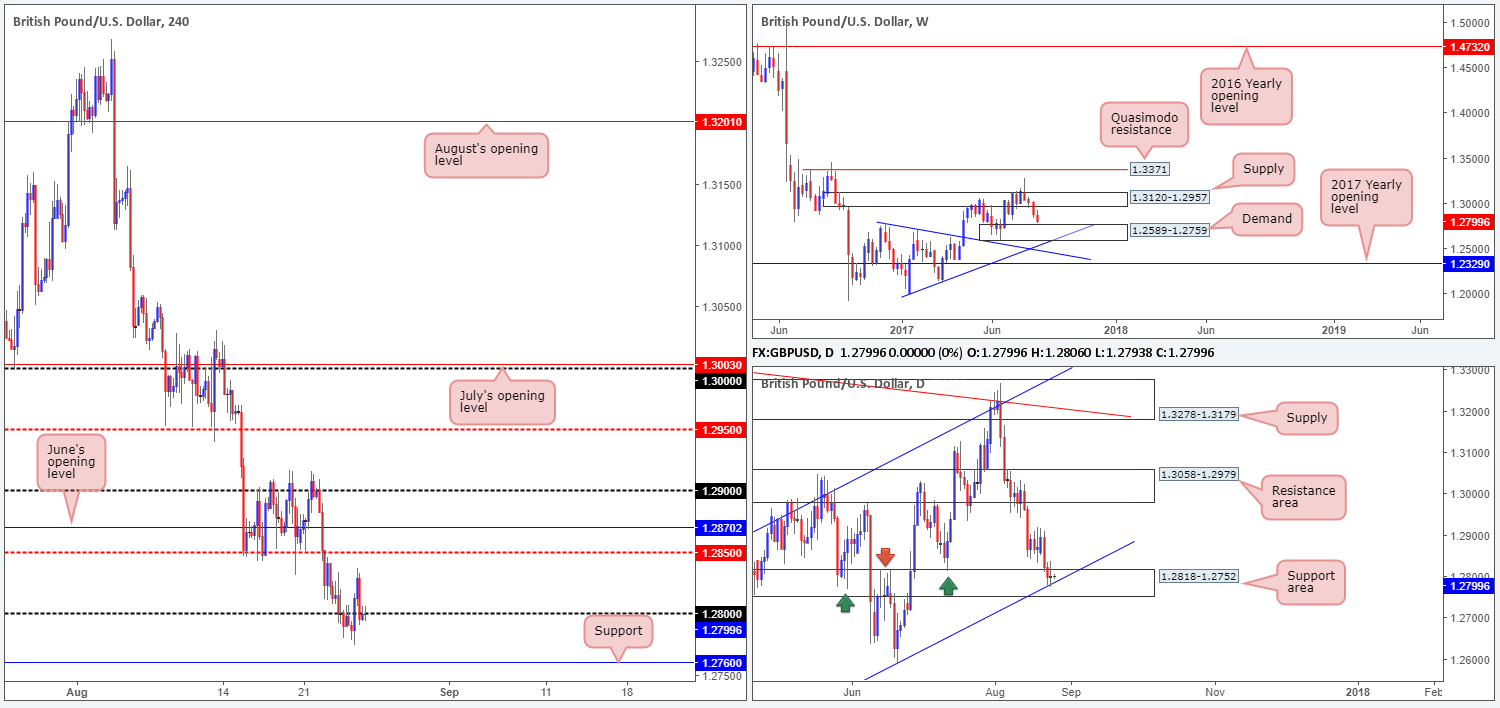
GBP/USD:
Kicking this morning’s report off with a look at the weekly timeframe, we can see that price is loitering just ahead of a demand base pegged at 1.2589-1.2759. Looking down to the daily timeframe, however, the unit is seen shaking hands with a support area at 1.2818-1.2752, which happens to intersect closely with a channel support line etched from the low 1.2365. Also of particular interest here is this area is seen glued to the top edge of the aforementioned weekly demand.
A closer look at price action on the H4 timeframe shows price briefly rose above the 1.28 handle yesterday, and managed to clock a high of 1.2836 on the day. Still, like the EUR/USD, the GBP ended the day pretty much unchanged with price closing a few pipettes back below 1.28.
Suggestions: In view of the unit’s close proximity to the weekly demand, as well as price currently interacting with a daily support area, we’re STILL reluctant to take on any medium/long-term shorts at this time. However, we are still interested in buying from the 1.28 neighborhood. But for this trade to come to fruition, we still require a decisive H4 close back above 1.28. This, alongside a retest and a reasonably sized H4 bullish candle (preferably printed in the shape of a full, or near-full-bodied candle) would, in our opinion, be enough to validate a long trade. The first area of concern would be the H4 mid-level resistance at 1.2850, followed closely by June’s opening level at 1.2870.
Data points to consider: US Core durable goods orders at 1.30pm, Fed Chair Yellen speaks at 5pm GMT+1. US Jackson Hole symposium (all day).
Levels to watch/live orders:
- Buys: Watch for H4 price to close back above 1.28 and then look to trade any retest seen thereafter ([waiting for a reasonably sized H4 bullish candle to form following the retest is advised] stop loss: ideally beyond the candle’s tail).
- Sells: Flat (stop loss: N/A).
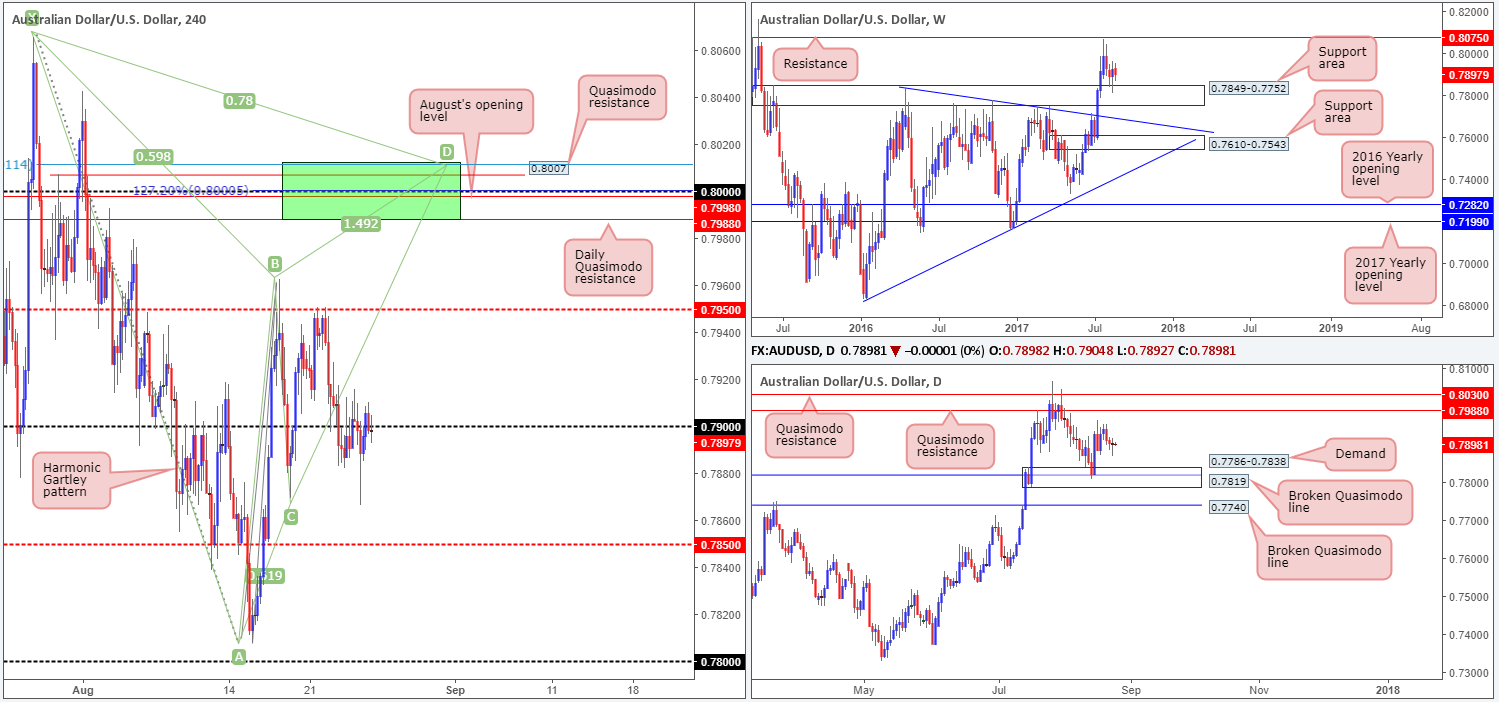
AUD/USD:
AUD/USD prices are effectively unchanged this morning, despite the pair ranging almost 50 pips on the day. As you can see from the H4 timeframe, the candles spent the day seesawing around the 0.79 handle. As of current price though, the sellers are seen pressing south, which could lead to the unit challenging the mid-level support at 0.7850 today.
At this time, there is very little to hang our hat on as far as trading opportunities go! This is largely due to the higher- timeframe direction. On the weekly timeframe, the bulls continue to defend the support area at 0.7849-0.7752 which could eventually see price advancing higher. Down on the daily timeframe, nonetheless, the candles appear confined between a demand area at 0.7786-0.7838 and a Quasimodo resistance at 0.7988, meaning the unit could effectively trade either way!
Suggestions: With the above notes in mind, our team has decided to remain flat for the time being.
Data points to consider: US Core durable goods orders at 1.30pm, Fed Chair Yellen speaks at 5pm GMT+1. US Jackson Hole symposium (all day).
Levels to watch/live orders:
- Buys: Flat (stop loss: N/A).
- Sells: Flat (stop loss: N/A).
USD/JPY:
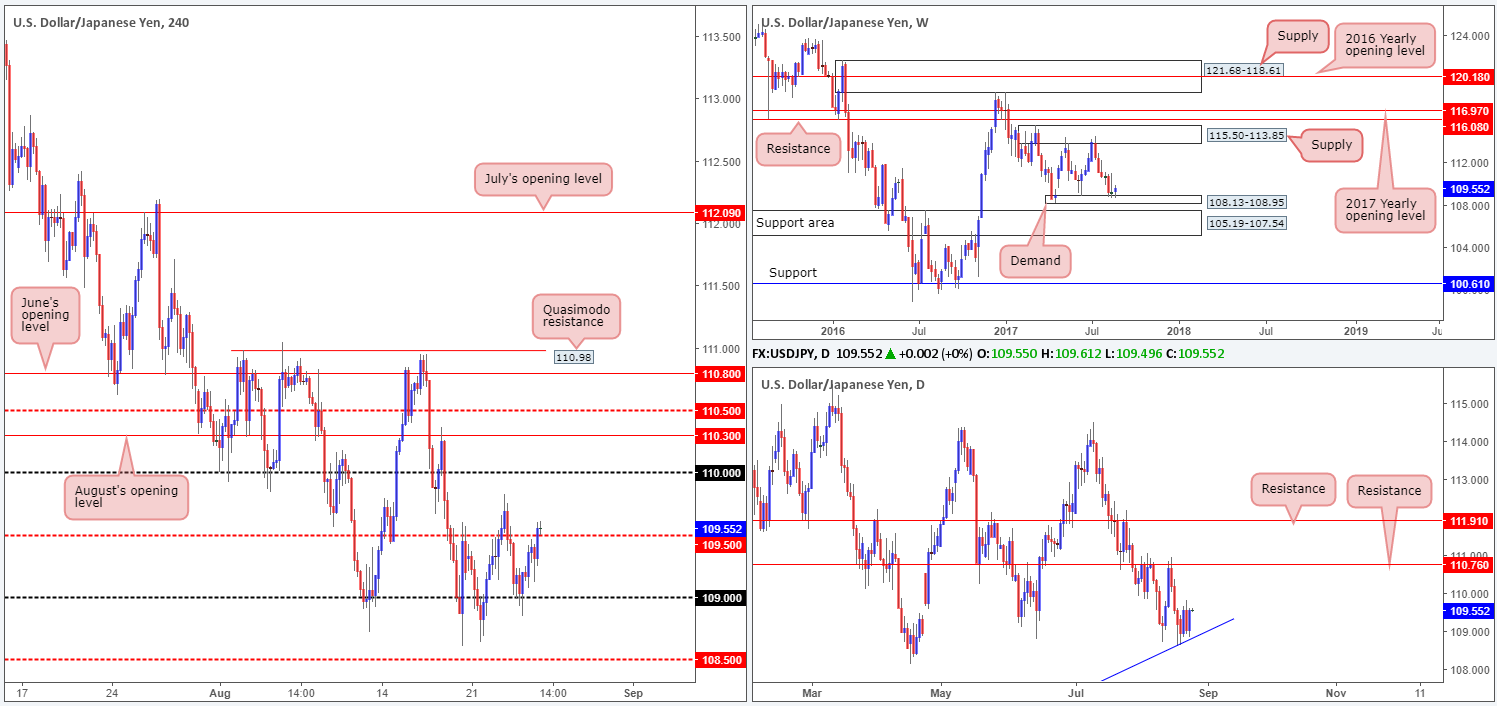
USD/JPY bulls seem to have a slight edge this morning. On the weekly timeframe, price is currently showing promise from demand pegged at 108.13-108.95. Uniting nicely with this weekly demand is a daily trendline support etched from the low 100.08. Should the bulls continue to climb from this trendline, the next upside target in view is a resistance level marked at 110.76.
Bouncing over to the H4 candles, we can see that price was recently bid above the mid-level resistance at 109.50. This, given the current landscape on the higher timeframes, could attract fresh buyers into the market place and pull price up to at least the 110 handle.
Suggestions: Drill down to the lower timeframes and look to enter long from the 109.50. To do this, you may want to consider using the techniques displayed at the top of this report.
Data points to consider: US Core durable goods orders at 1.30pm, Fed Chair Yellen speaks at 5pm GMT+1. US Jackson Hole symposium (all day).
Levels to watch/live orders:
- Buys: 109.50 region ([waiting for a lower-timeframe confirming buy signal to form before pulling the trigger is advised] stop loss: dependent on where one confirms this area).
- Sells: Flat (stop loss: N/A).
USD/CAD:
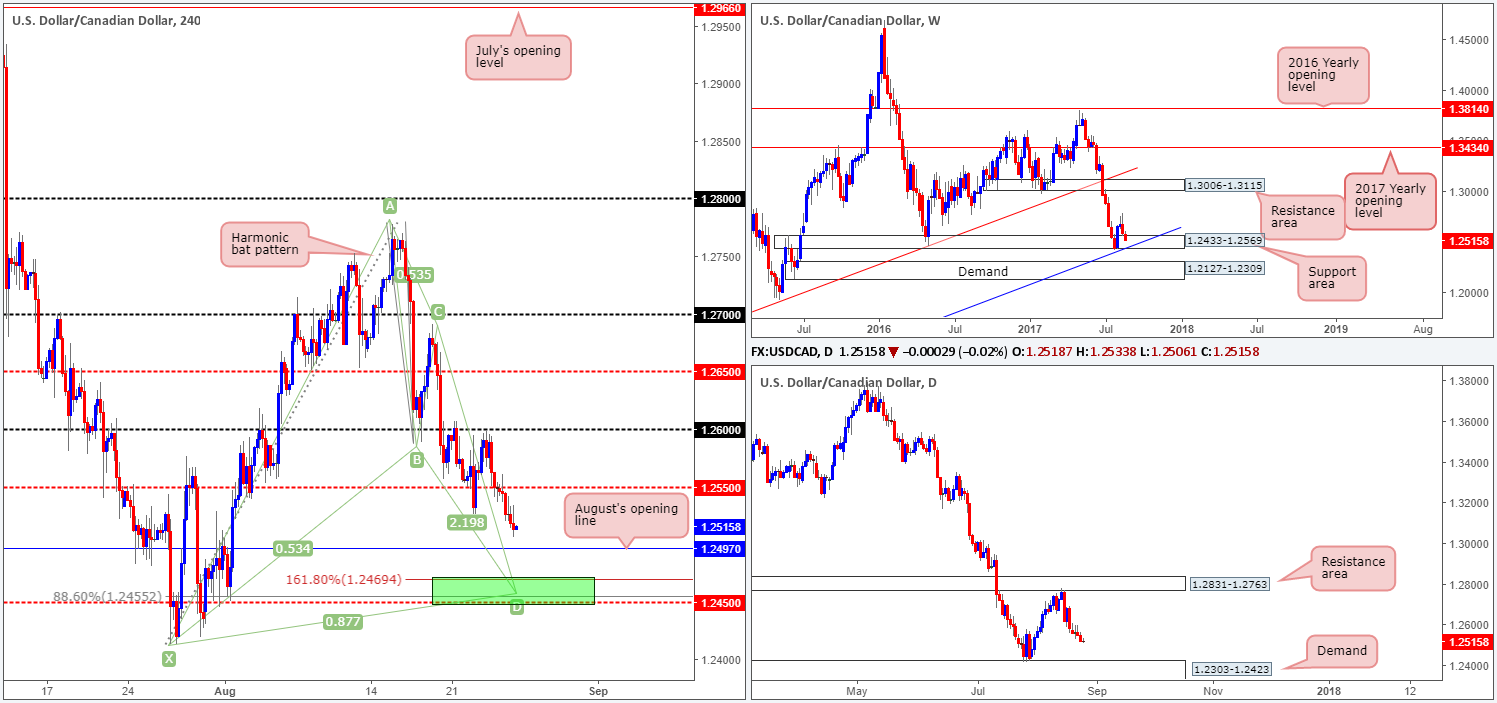
After touching gloves with the 1.26 handle early on in Wednesday’s session, the pair has since been on the decline. With the H4 mid-level support at 1.2550 now out of the picture, August’s opening level at 1.2497 is the next support on the hit list. Beyond this monthly level, however, is a H4 Harmonic bat completion point at 1.2455.
Despite the stronger-than-expected rebound seen from the weekly support area given at 1.2433-1.2569 three weeks ago, weekly action recently pulled back and is now seen trading back within the walls of this zone. Technically speaking, the selloff is likely due to the daily resistance area coming in at 1.2831-1.2763. Should the bears continue to dominate from this zone, the next area on the hit list is the demand penciled in at 1.2303-1.2423 (positioned just below the aforementioned weekly support area).
The H4 Harmonic bat pattern mentioned above boasts a powerful XA retracement (88.6% Fib retracement at 1.2455) and is located just ahead of the H4 mid-level support 1.2450. It is also positioned within the noted weekly support area and its converging weekly trendline support taken from the low 0.9633.
Suggestions: In the event that the Harmonic pattern completes, we will be interested buyers here. Additional confirmation, in our opinion, is not required since we can comfortably place stops beyond the X point (1.2413) and still achieve adequate risk/reward.
Data points to consider: US Core durable goods orders at 1.30pm, Fed Chair Yellen speaks at 5pm GMT+1. US Jackson Hole symposium (all day).
Levels to watch/live orders:
- Buys: 1.2450 (stop loss: 1.2411).
- Sells: Flat (stop loss: N/A).
USD/CHF:
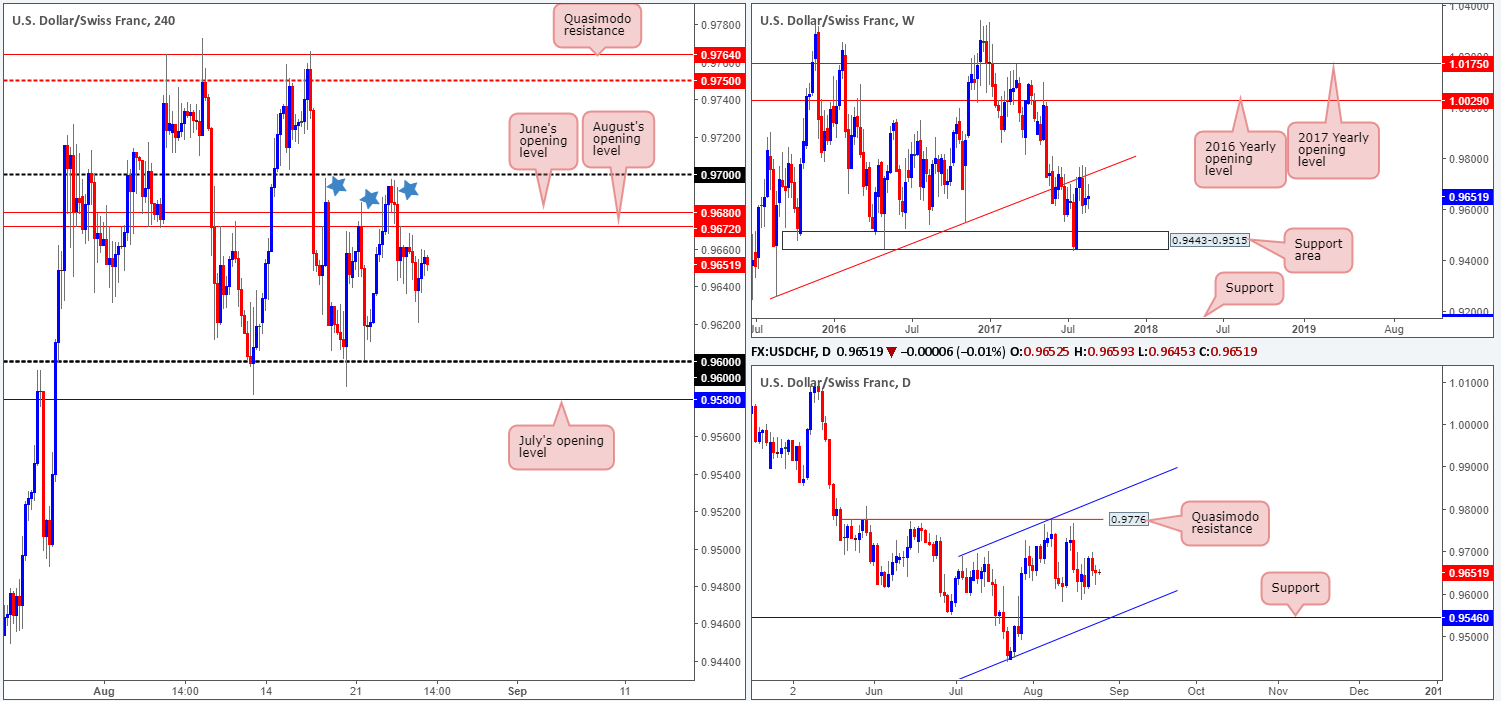
Using a top-down approach this morning, the weekly timeframe shows that the trendline resistance extended from the low 0.9257 remains in play. This has, in our opinion, firmly placed the weekly support area at 0.9443-0.9515 back on the hit list. Also noteworthy is the daily timeframe. The chart shows room for the pair to trade as far down as support coming in at 0.9546, which happens to unite with a channel support etched from the low 0.9438. A closer look at price action on the H4 timeframe shows the unit is currently trading within striking distance of June and August’s opening levels at 0.9680/0.9672.
Suggestions: Despite the higher-timeframe picture suggesting further downside, we’re wary about selling from 0.9680/0.9672, as price has whipsawed through these levels on three occasions over the past two weeks (see blue stars).
Considering this, our desk has decided to remain on the sidelines for the time being.
Data points to consider: US Core durable goods orders at 1.30pm, Fed Chair Yellen speaks at 5pm GMT+1. US Jackson Hole symposium (all day).
Levels to watch/live orders:
- Buys: Flat (stop loss: N/A).
- Sells: Flat (stop loss: N/A).
DOW 30:
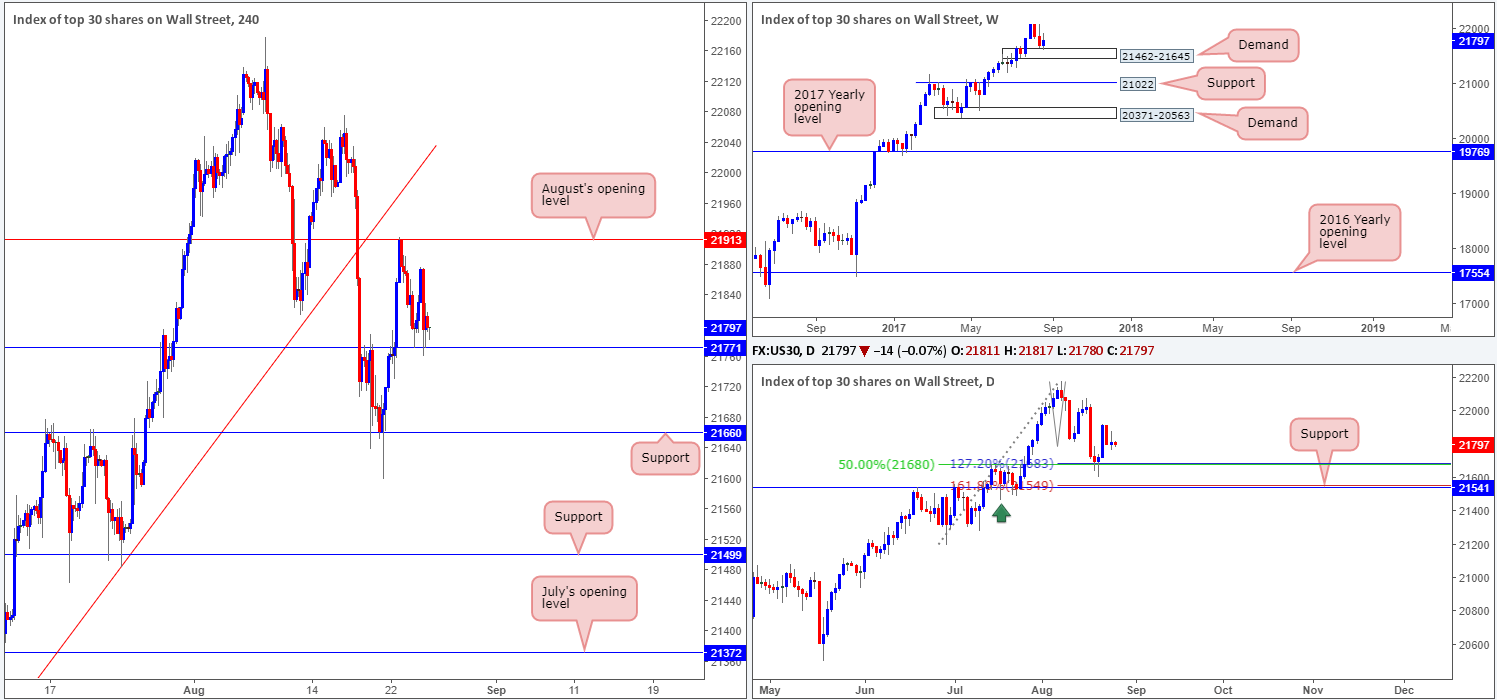
Recent action on the H4 timeframe shows how powerful monthly open levels can be! August’s opening level at 21913 has held price lower since Wednesday. In spite of this, 21771 has also provided the market with adequate support.
Up on the weekly timeframe, demand at 21462-21645 has, as you can see, managed to bolster price action this week. This should not really come as too much of a surprise as it is a WEEKLY demand, and it is positioned within an incredibly strong uptrend. Daily price on the other hand is seen lurking just ahead of an interesting support comprised of a 127.2% Fib ext. point at 21683, and a daily 50% support line at 21680 drawn from the low 21192.
Our suggestions: Buying from the current H4 support could be an option today. However, despite weekly price trading from demand, we still believe a buy from here may be too risky. The reason being is simply due to daily price showing room to trade lower, which could end up sending price back down to the H4 support lodged at 21660.
Data points to consider: US Core durable goods orders at 1.30pm, Fed Chair Yellen speaks at 5pm GMT+1. US Jackson Hole symposium (all day).
Levels to watch/live orders:
- Buys: Flat (stop loss: N/A).
- Sells: Flat (stop loss: N/A).
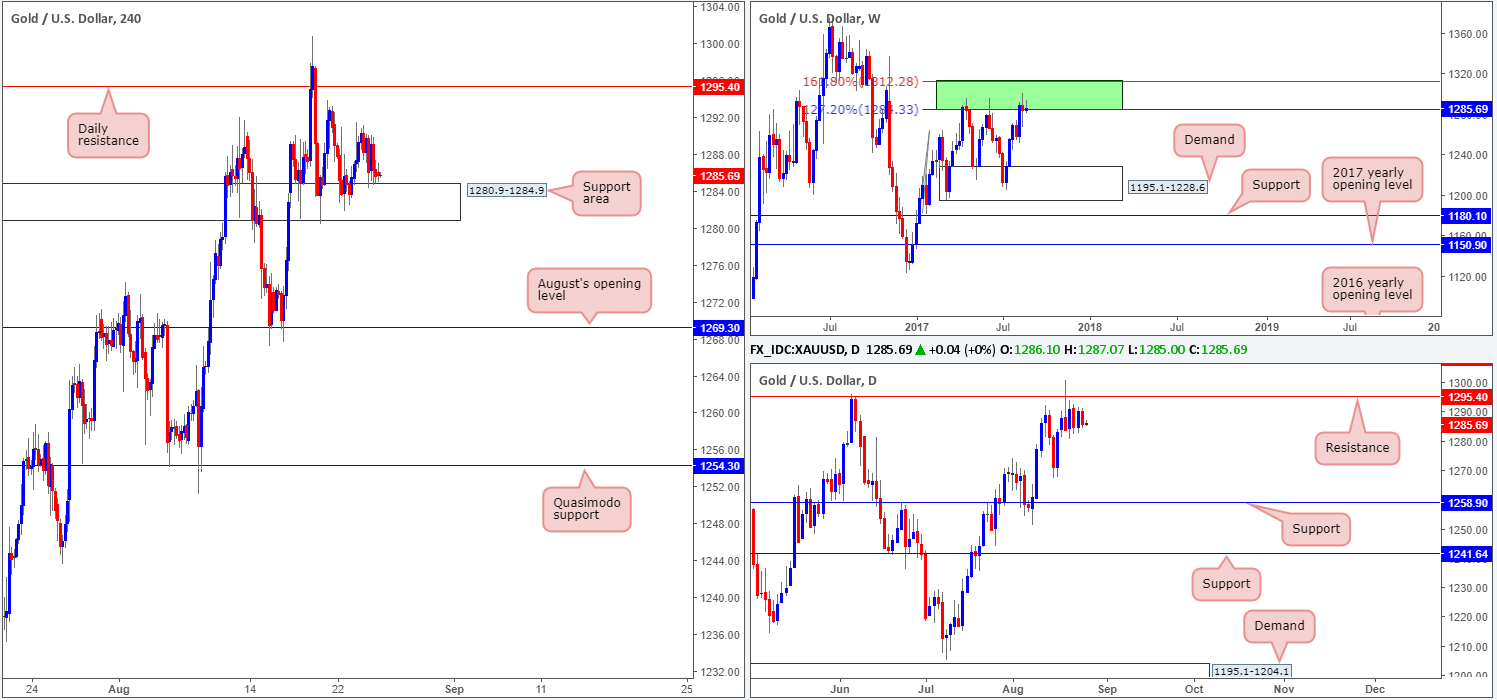
GOLD:
Beginning with the weekly timeframe this morning, it is clear to see that the bears are making an effort to bring price action lower. As you can see, weekly price is currently located within a green weekly resistance area comprised of two weekly Fibonacci extensions 161.8/127.2% at 1312.2/1284.3 taken from the low 1188.1.
The story on the daily chart, nevertheless, shows price trading from a resistance level at 1295.4. Ever since price struck this line back on the 18th August, the daily candles have been trading within a tight consolidation.
Bouncing across to the H4 chart, the support area at 1280.9-1284.9 continues to bolster price. Therefore, for those who are looking to short based on the weekly and daily structures in play right now, we would advise waiting for the current support area to be engulfed. This would not only confirm seller strength from the higher-timeframe structures, but also open the path south down to August’s opening level at 1269.3.
Our suggestions: Watch for the current H4 support area to be engulfed before considering selling this market. A H4 close beyond this area, followed up with a retest and a H4 bearish rotation candle (preferably a full, or near-full-bodied candle) would, in our view, be enough to justify a short, targeting August’s opening level at 1269.3.
Levels to watch/live orders:
- Buys: Flat (stop loss: N/A).
- Sells: Watch for H4 price to engulf 1280.9-1284.9 and then look to trade any retest seen thereafter ([waiting for a H4 bearish rotation candle to form following the retest is advised] stop loss: dependent on where one confirms this area).


