
EUR/USD:
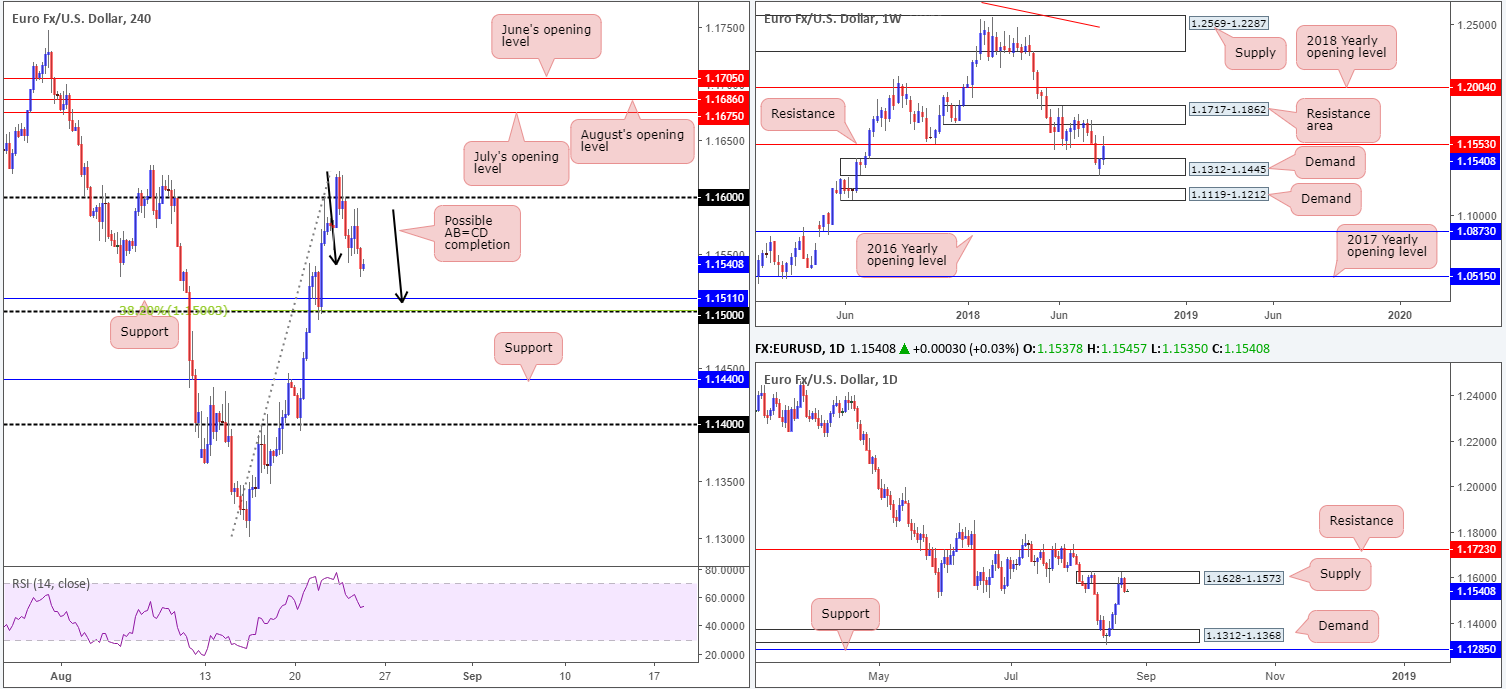
A broad-based USD recovery took shape during Thursday’s session, amid political turmoil seen across the globe. Breaking a five-day bearish phase, the move weighed on the single currency, unable to sustain gains beyond the 1.16 handle plotted on the H4 timeframe. Interestingly, traders may have also noticed recent downside on the H4 scale is taking form in the shape of a possible AB=CD that terminates around H4 support at 1.1511/the 1.15 handle (and a 38.2% H4 Fib support – green line).
Weekly price, despite pushing to highs of 1.1622 this week, is seen trading back beneath its resistance level at 1.1553. Technically, the pair is likely to continue finding resistance at this barrier, with it having been a reasonably strong support in the past. The next downside target on this scale falls in around demand at 1.1312-1.1445.
In conjunction with weekly movement, daily price sold off from supply at 1.1628-1.1573 yesterday, printing a near-full-bodied bearish candle. Continued selling from this point has demand at 1.1312-1.1368 (an area plotted within the lower limits of the aforementioned weekly demand) to target.
Areas of consideration:
With both weekly and daily charts threatening further downside, a test of the 1.15 region on the H4 scale is likely. An intraday bounce from this psychological barrier is probable, given nearby H4 confluence: a support level, a 38.2% Fib support and a possible AB=CD completion. Ultimately, though, the market should respect higher-timeframe structure and eventually search for levels beyond 1.15: the H4 support at 1.1440 and the 1.14 handle.
If you intend on attempting to fade 1.15, traders are urged to consider entering on lower-timeframe candle confirmation: a bullish pin-bar formation or engulfing formation, given where we’re coming from on the higher timeframes.
A H4 close beyond 1.15, as the higher timeframes suggest, followed up with a retest in the shape of a full or near-full-bodied H4 bear candle would likely be enough to draw in sellers, targeting H4 support at 1.1440. Stop-loss orders best placed beyond the rejecting candle’s wick.
Today’s data points: US durable goods orders m/m; Fed Chair Powell speaks; Jackson Hole symposium (day 2).
GBP/USD:
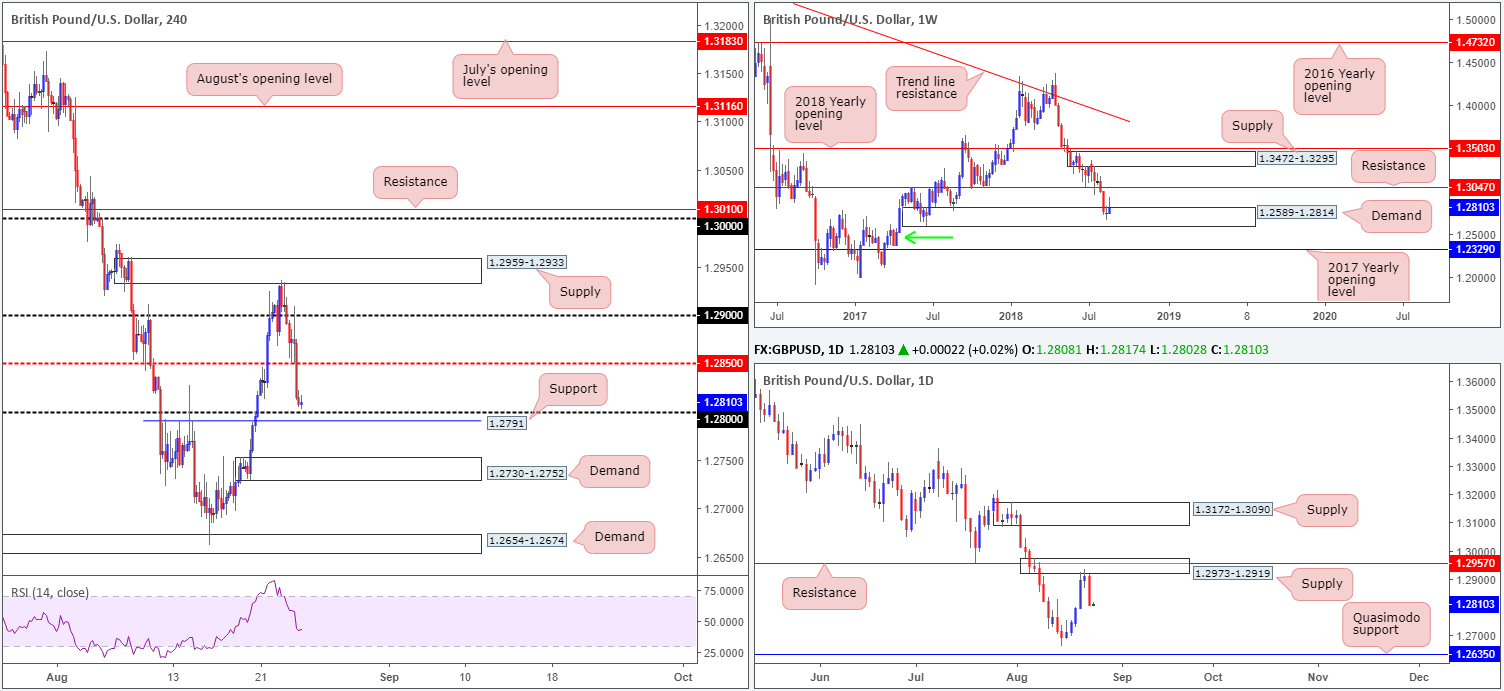
The British pound is seen trading with a reasonably strong downside bias this morning, following yesterday’s precipitous selloff. Renewed Brexit concerns emerged on Thursday, forcing the pair towards the 1.28 handle/nearby support at 1.2791 marked on the H4 timeframe. While a rejection off 1.2791/1.28 is possible, it may be worth penciling in the H4 demand area seen just beneath it at 1.2730-1.2752, in case we push lower.
Meanwhile on the higher timeframes, upward momentum out of weekly demand at 1.2589-1.2814 has diminished, close to forming a bearish pin-bar formation at this point. The story on the daily timeframe shows price came within striking distance of resistance at 1.2957 before selling off. If one includes the supply enveloping this level at 1.2973-1.2919, however, you’ll notice this area held beautifully. The next downside support to be aware of on this scale can be found around the Quasimodo support level fixed at 1.2635.
Areas of consideration:
On the one hand, weekly price remains trading within the walls of demand, while on the other hand daily price is seen trading from supply with room to stretch lower. A long from the 1.28 region on the H4 timeframe, therefore, is in-line with weekly flow but against daily selling!
Should you believe 1.28 is to hold ground, consider waiting for additional confirmation before pulling the trigger. Drilling down to the lower timeframes in search for a bullish candlestick signal could be an option, as this will increase risk/reward exponentially, given the initial upside target rests around H4 mid-level resistance at 1.2850.
Today’s data points: US durable goods orders m/m; Fed Chair Powell speaks; Jackson Hole symposium (day 2).
AUD/USD:
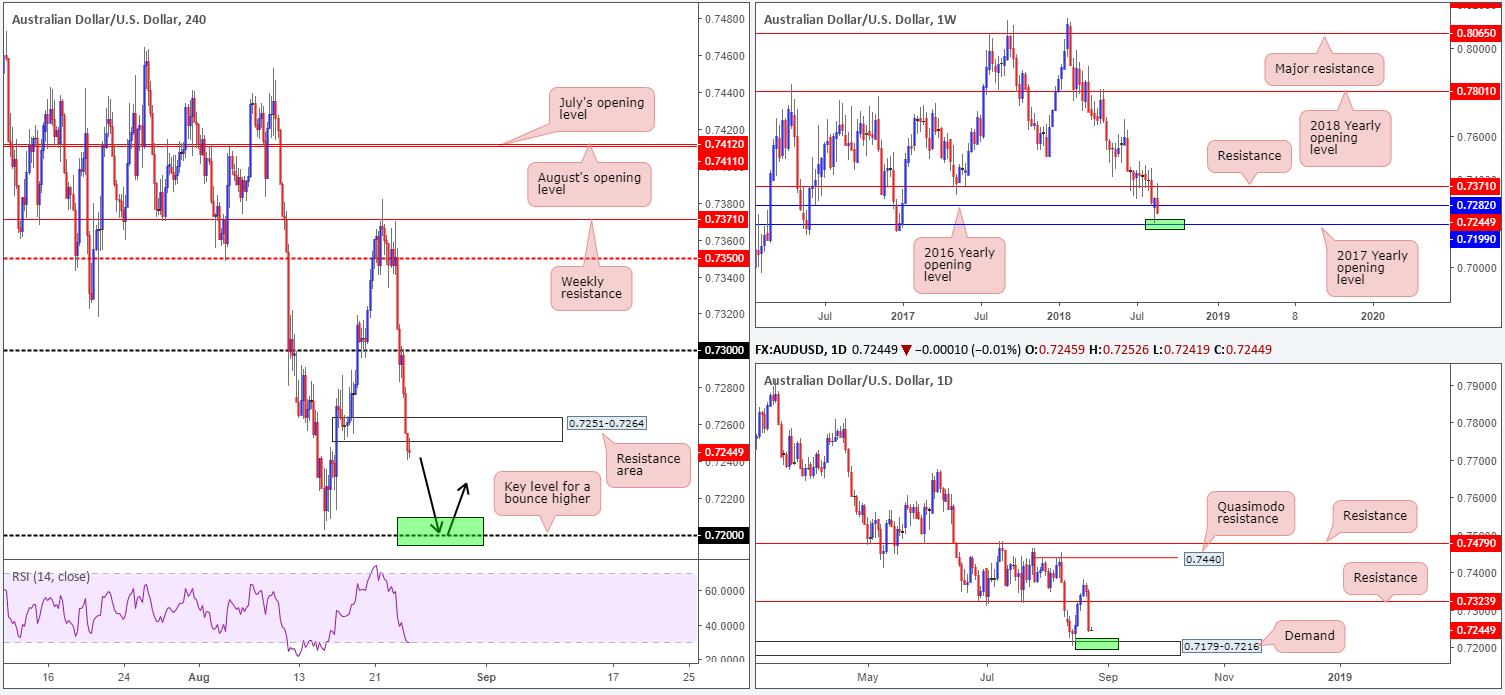
Down 1.43% on the day against its US counterpart, the commodity currency suffered an absolute beating on Thursday amid high-profile government resignations and challenges to PM Turnbull. The day concluded with H4 price breaking demand at 0.7251-0.7264 (acting resistance area), potentially opening the door for a test of the 2018 lows at 0.7202.
From a technical perspective, recent selling emerged off the back of weekly resistance seen printed at 0.7371. On this scale, the market observed a break of the 2016 yearly opening level at 0.7282, consequently freeing the path south for a possible test of the 2017 yearly opening level at 0.7199. On the other side of the spectrum, daily demand at 0.7179-0.7216, an area that encapsulates the aforementioned 2017 yearly opening level on the weekly timeframe, is poised to re-enter the fold thanks to yesterday’s precipitous selloff.
Areas of consideration:
To our way of seeing things, the 0.72 handle is a key support. Not only is it positioned within the current daily demand zone, it also represents (1-pip difference) the 2017 yearly opening level on the weekly timeframe at 0.7199. For that reason, should the market test 0.72 today and hold by way of a H4 full or near-full-bodied bull candle, a rotation to the upside is probable. Entry on the close of the bull candle is an option, with the stop-loss order positioned beyond the candle’s rejecting tail.
Today’s data points: US durable goods orders m/m; Fed Chair Powell speaks; Jackson Hole symposium (day 2).
USD/JPY:
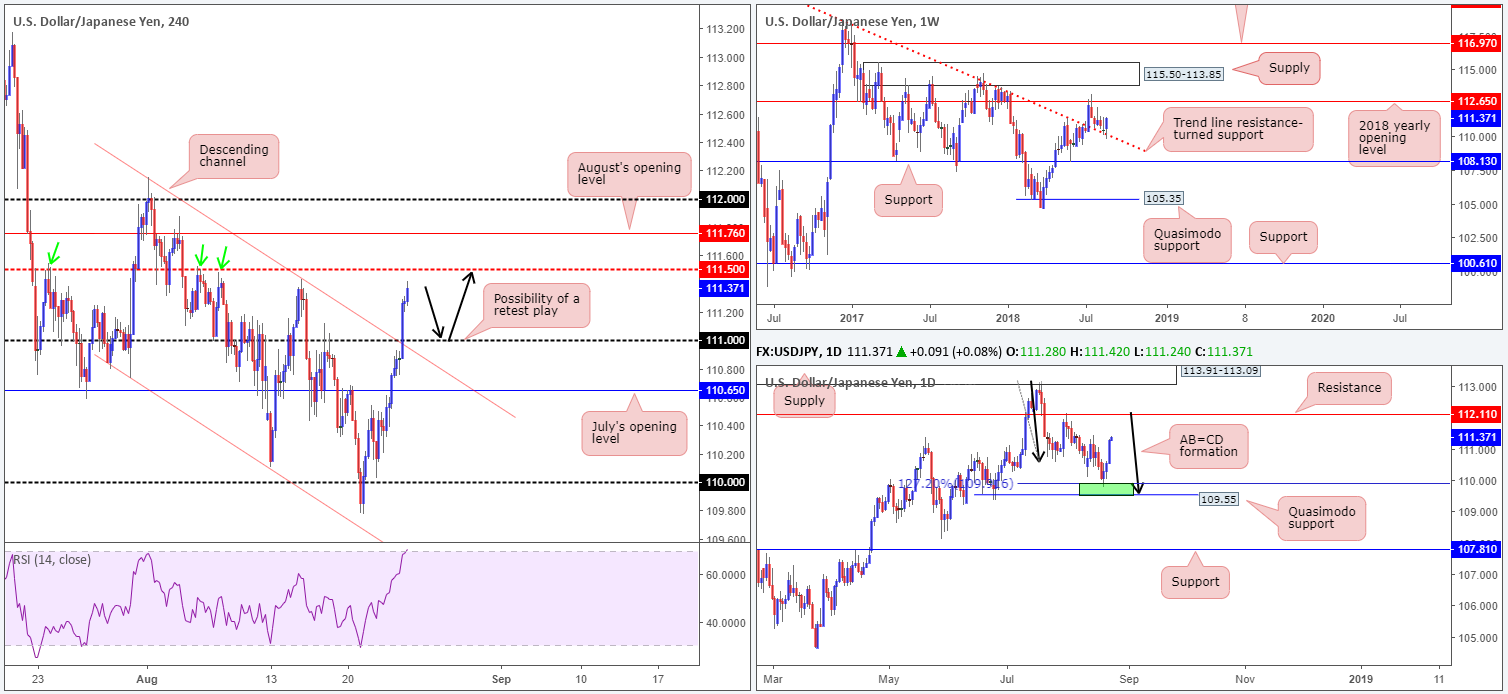
In recent movement, the USD/JPY chalked up its third consecutive daily gain. Breaking through a number of key resistances on the H4 scale, the pair is currently seen nearing the 111.50 point: a mid-level resistance that boasts reasonably strong history (see green arrows). Beyond this angle, eyes are likely fixed on August’s opening level at 111.76, followed by the 112 handle.
On the other side of the spectrum, both weekly and daily price continue to emphasize a bullish presence. Weekly price, as you can see, is respecting a trend line resistance-turned support (taken from the high 123.57). Having seen this line hold firm as resistance on a number of occasions in the past, it’s likely to remain a defensive barrier going forward. In conjunction with weekly flow, an AB=CD formation (black arrows) recently completed around the 127.2% Fib ext. point at 109.91, which happens to be positioned nearby a Quasimodo support at 109.55 (green area). The next obvious upside target on this scale does not come into view until resistance at 112.11.
Areas of consideration:
Keeping it simple this morning, a retest play off the 111 handle may come into view today, owing to the room seen to move higher on the bigger picture. Upside targets from 111 fall in at 111.50, August’s opening level, the 112 handle, followed closely by daily resistance mentioned above at 112.11.
In regard to entry, aggressive traders will likely enter at market, placing stops 10-15 pips beneath 111. While this could work out, conservative traders may prefer to wait and see how H4 action responds before engaging. A H4 bullish candlestick formation printed off this number would be ideal to confirm buyer intent.
Today’s data points: US durable good orders m/m; Fed Chair Powell speaks; Jackson Hole symposium (day 2).
USD/CAD:
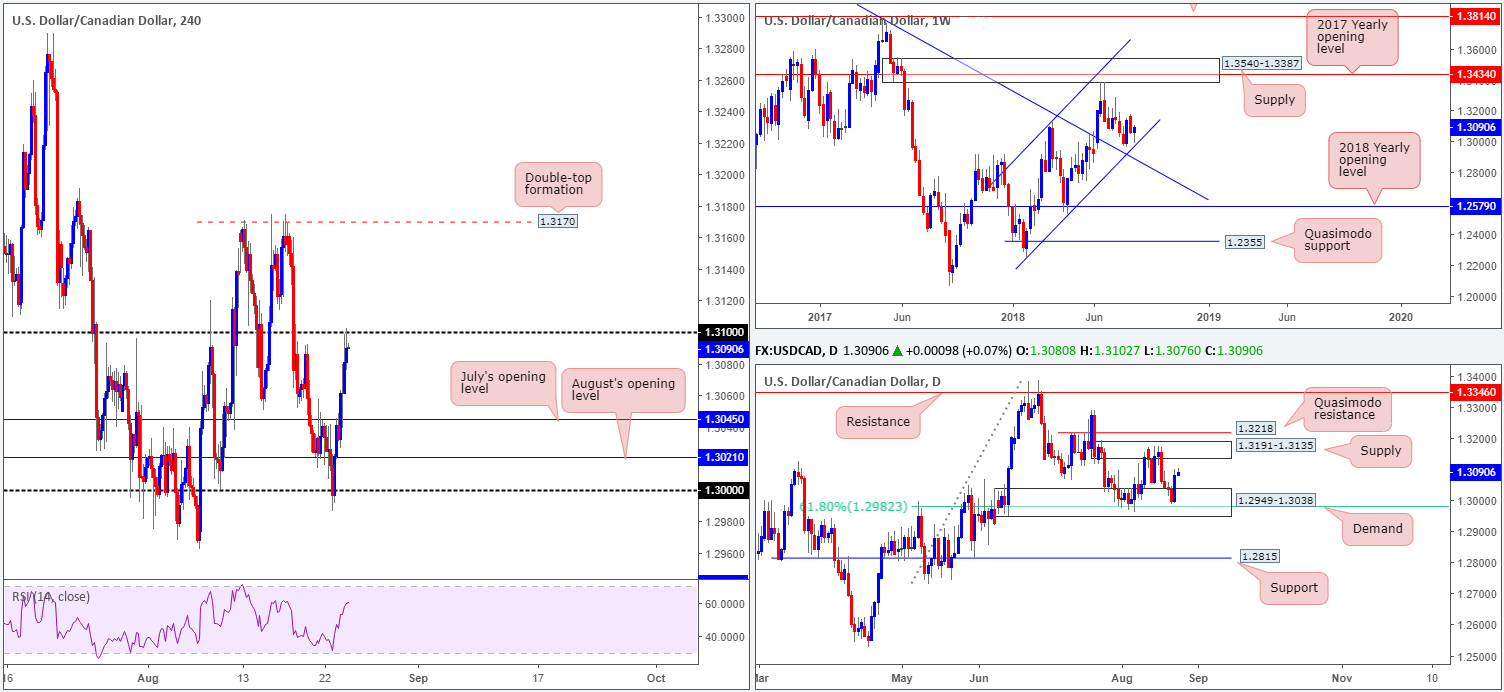
The USD/CAD sported a healthy recovery candle on Thursday, consequently erasing weekly losses. Largely bolstered by US tariffs on Chinese goods recently coming into effect, the H4 candles shook hands with the 1.31 handle going into the day’s close. Beyond this psychological boundary, traders may want to pencil in the double-top formation seen around the 1.3170 point.
Before 1.3170 can be achieved, though, the market will have to contend with the lower edge of daily supply at 1.3191-1.3135, an area that has capped price action since August 10. Should the unit reach 1.3170, knowing this level is situated within the upper limits of the noted daily supply, shorts from this angle are an option.
In terms of weekly movement, channel support (extended from the low 1.2247 – a line that’s supported upside since the beginning of the year) has been left unchallenged, with the current weekly candle poised to close the week out in the shape of a bullish pin-bar formation.
Areas of consideration:
Selling 1.31 today is clearly on the radar for traders this morning. Caution is warranted, however, given the daily candles threatening to test supply at 1.3191-1.3135, along with weekly price showing little sign of resistance on the horizon. Longs above 1.31 are also limited to a small intraday bounce, given how close daily supply is!
The only area that really jumps out this morning is the H4 double-top resistance mentioned above at 1.3170. Owing to this level being housed within daily supply at 1.3191-1.3135, stop-loss orders can be positioned above this area, though there is a chance we may not see this level enter the fight today unfortunately.
Today’s data points: US durable goods orders m/m; Fed Chair Powell speaks; Jackson Hole symposium (day 2).
USD/CHF:
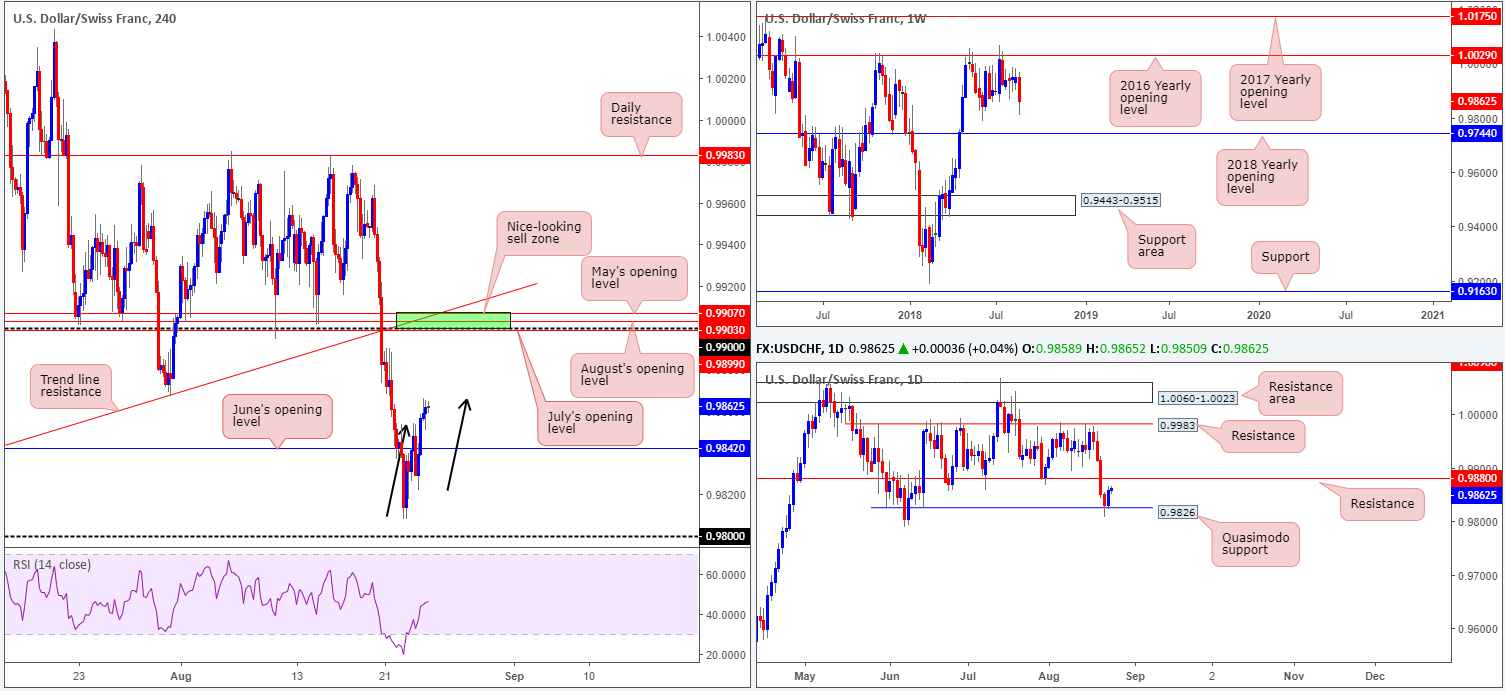
Following four consecutive days of dominant selling, the USD/CHF staged a healthy comeback on Thursday just north of the 0.98 handle seen on the H4 timeframe. As you can see, upside broke through June’s opening level at 0.9842 and topped around the 0.9866 mark in the shape of a H4 AB=CD formation (black arrows).
The recent move higher, technically speaking, was bolstered by a daily Quasimodo support level at 0.9826. Despite this, daily resistance seen nearby at 0.9880 is likely to hinder upside. As highlighted in yesterday’s report, weekly price still exhibits space to probe lower, targeting June’s low 0.9788, followed by the 2018 yearly opening level at 0.9744.
Areas of consideration:
Although daily resistance at 0.9880 is likely to cause a problem for buyers, the team has noted to keep eyes on the 0.9907/0.9899 H4 (green) zone for possible selling opportunities. Comprised of May’s opening level at 0.9907, August’s opening level at 0.9903, July’s opening level at 0.9899 and a trend line support-turned resistance (taken from the low 0.9788), this zone has a healthy chance of holding price action lower should it be tested today/next week.
Today’s data points: US durable goods orders m/m; Fed Chair Powell speaks; Jackson Hole symposium (day 2).
Dow Jones Industrial Average:
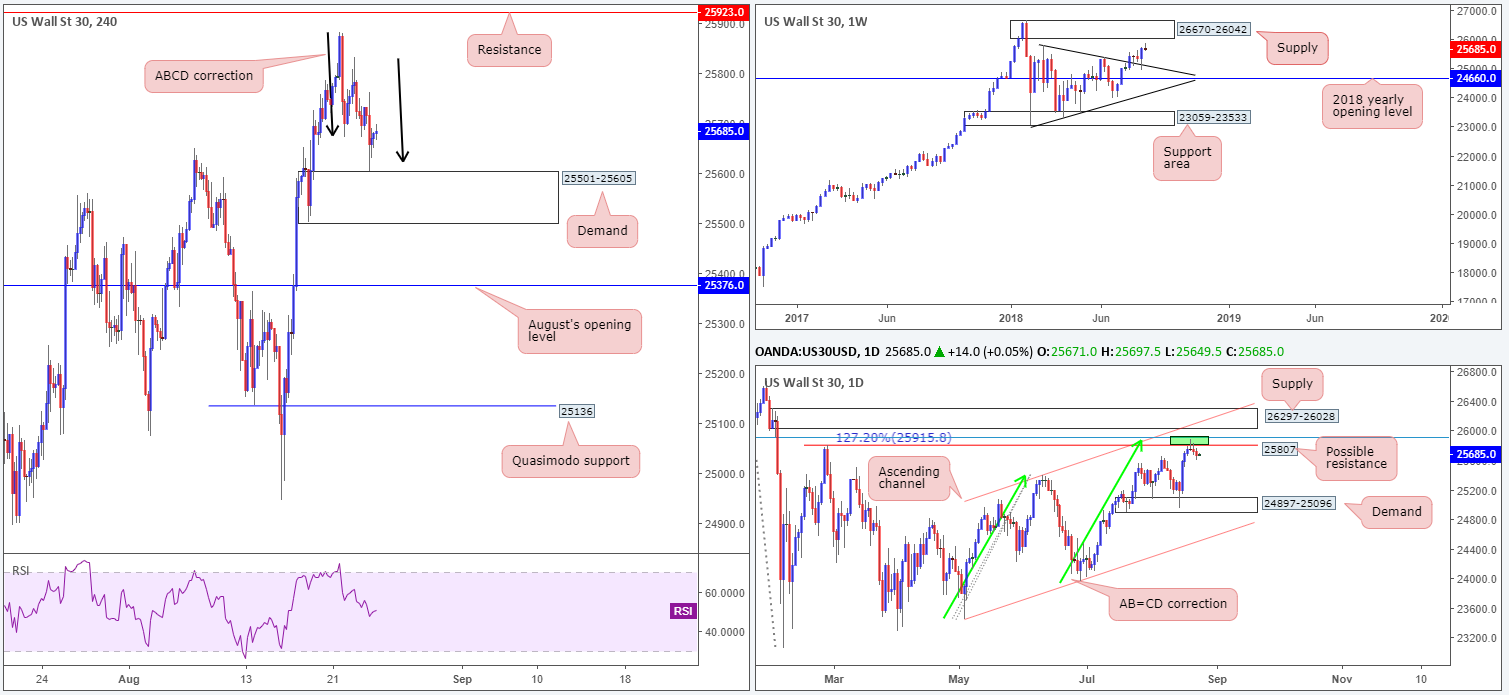
US equities ended the day lower on Thursday, bringing H4 demand at 25501-25605 into the picture. What’s also notable on the H4 timeframe is the recently completed ABCD formation (black arrows). If you look closely, there was also a lower timeframe ABCD pattern completing around this point as well! As is evident from the chart, demand responded almost to the pip and traded to highs of 25697.
While buying from the current H4 demand may seem appealing, this week has seen daily price trade south after touching gloves with a small area of confluence at 25915/25807 (green zone – comprised of a resistance level at 25807 [Feb 27 high], a 127.2% AB=CD [green arrows] correction point at 25915 and a 78.6% Fib resistance at 25904).
Also worth highlighting is weekly action showing room to press as far north as supply coming in at 26670-26042, following a strong retest off a trend line resistance-turned support (etched from the high 25807) last week.
Areas of consideration:
Though the H4 candles sport reasonably bullish confluence at the moment, buying at a point when daily price is seen exiting a sell zone is not a setup we’d label high probability.
In regards to selling this market at current price based on the daily bearish pin-bar formation, waiting for at least the current H4 demand to be engulfed is advised. Beyond here, downside targets are seen around August’s opening level at 25376, followed by Quasimodo support at 25136.
The H4 resistance at 25923 is also still an area worth watching for shorts. Positioned between the daily area of (green) confluence and supply at 26297-26028, a response from this angle is likely. Yet, do not go into this full throttle! There’s a chance this level could break as the index may want to test the underside of the aforementioned daily supply or even bring the market towards weekly supply at 26670-26042.
Today’s data points: US durable goods orders m/m; Fed Chair Powell speaks; Jackson Hole symposium (day 2).
XAU/USD (Gold)
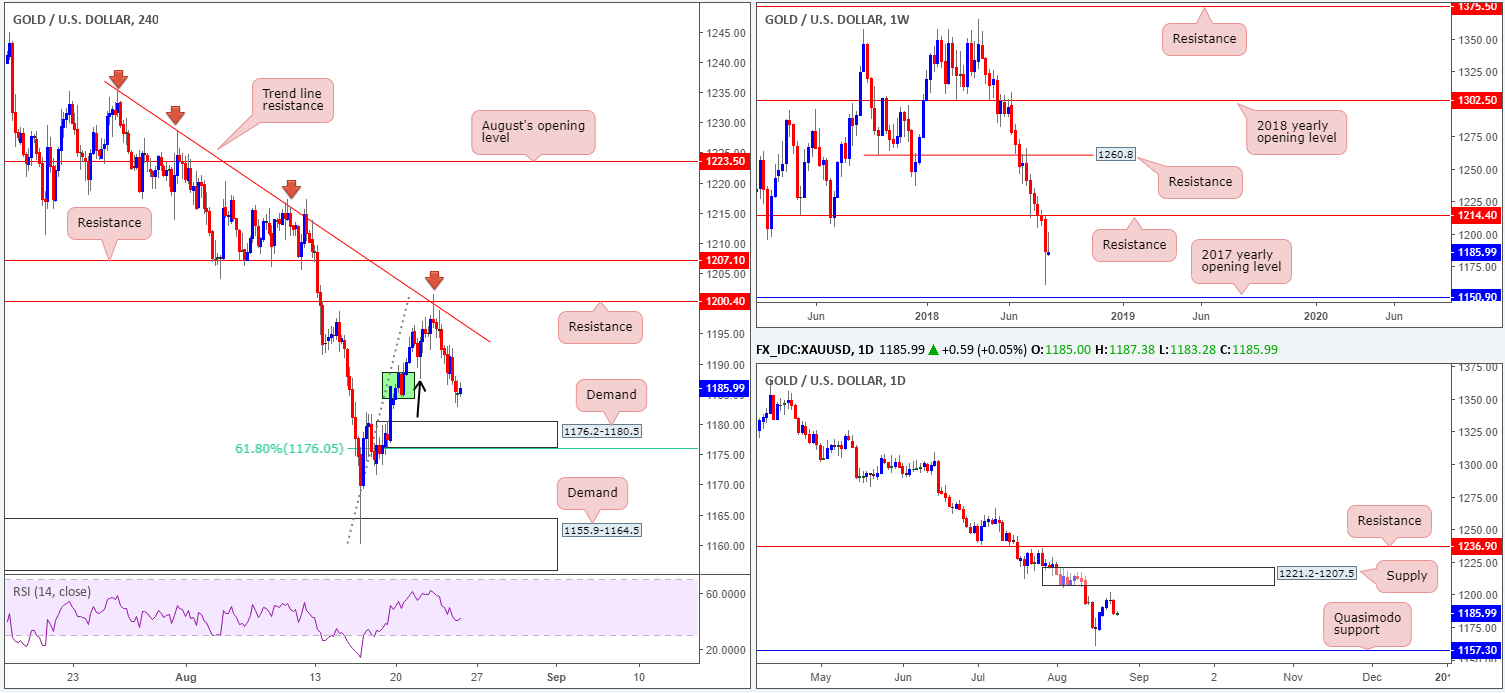
As expected, the price of gold continued to depreciate on Thursday, attacking and eventually engulfing the green H4 demand at 1184.4-1188.5, given the majority of its buyers were likely picked up on the consumption tail seen marked with a black arrow at 1187.4. The next port of call on the H4 scale can be seen at demand drawn from 1176.2-1180.5. A break beyond this barrier – we are likely looking at a move down to a considerably sized demand base at 1155.9-1164.5.
In terms of higher-timeframe movement, both weekly and daily activity remains trading in no man’s land. Weekly price is currently loitering between resistance at 1214.4 and the 2017 yearly opening level at 1150.9. On the daily timeframe, however, supply is seen at 1221.2-1207.5 (encases the current weekly resistance) along with a Quasimodo support at 1157.3.
Areas of consideration:
Not really a lot jumping out at us this morning in terms of potential areas to trade. The current H4 demand at 1176.2-1180.5, although bolstered by a 61.8% H4 Fib support at 1176.0, will likely provide a bounce, though with limited higher-timeframe convergence, we would not consider this a high-probability buy zone.
Unless we get below the current H4 demand today down to the larger H4 demand mentioned above at 1155.9-1164.5 (a possible area to consider longs from), which happens to encase the daily Quasimodo support at 1157.3, we do not see much to hang our hat on today.
The use of the site is agreement that the site is for informational and educational purposes only and does not constitute advice in any form in the furtherance of any trade or trading decisions.
The accuracy, completeness and timeliness of the information contained on this site cannot be guaranteed. IC Markets does not warranty, guarantee or make any representations, or assume any liability with regard to financial results based on the use of the information in the site.
News, views, opinions, recommendations and other information obtained from sources outside of www.icmarkets.com.au, used in this site are believed to be reliable, but we cannot guarantee their accuracy or completeness. All such information is subject to change at any time without notice. IC Markets assumes no responsibility for the content of any linked site. The fact that such links may exist does not indicate approval or endorsement of any material contained on any linked site.
IC Markets is not liable for any harm caused by the transmission, through accessing the services or information on this site, of a computer virus, or other computer code or programming device that might be used to access, delete, damage, disable, disrupt or otherwise impede in any manner, the operation of the site or of any user’s software, hardware, data or property.


