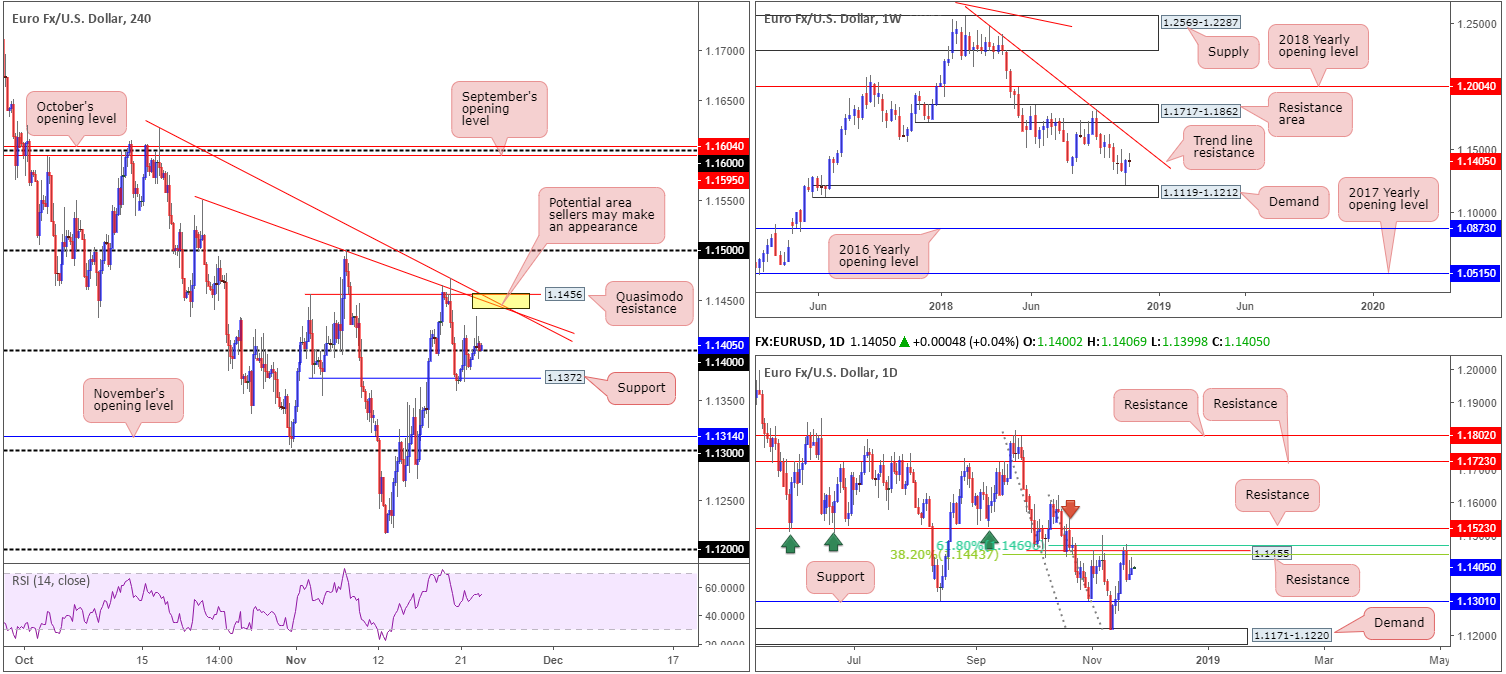
EUR/USD:
Up 0.14% on the day, the shared currency concluded the session stabilizing just north of 1.14. Unaffected by the latest publication of the ECB’s meeting minutes, trade was relatively thin as US banks closed in observance of Thanksgiving Day.
Above 1.14, two nearby converging trend line resistances (taken from highs of 1.1550/1.1621) decorate the H4 timeframe, followed closely by a Quasimodo resistance level at 1.1456. These areas remain of interest due to its connection with daily resistance plotted at 1.1455/two daily Fibonacci resistances: 38.2%/61.8% at 1.1443 and 1.1469, respectively. Beneath 1.14, support rests close by at 1.1372, while beyond this barrier room to press as far south as November’s opening level at 1.1314/1.13 is observed.
As for the weekly timeframe, the current candle is seen pivoting indecisively between a notable trend line resistance (extended from the high 1.2476) and a demand zone coming in at 1.1119-1.1212. Both areas are of equal weighting, according to our technical studies.
Areas of consideration:
The two aforementioned H4 trend line resistances, along with the closely converging H4 Quasimodo resistance (yellow) is a point where intraday sellers may attempt to make an appearance today. A move south from this region towards 1.14 is, given the added confluence of daily resistance at 1.1455, a high-probability move.
While aggressive traders are likely looking to enter around the 1.1450ish neighbourhood with stop-loss orders tucked above Tuesday’s high 1.1472, conservative traders may opt to wait and see how price action behaves before pulling the trigger. A bearish candlestick formation on either H4/H1 would not only help confirm seller intent, it’d also provide entry/stop parameters.
Today’s data points: French Flash Manufacturing PMI; German Flash Manufacturing PMI; EUR Flash Manufacturing PMI.
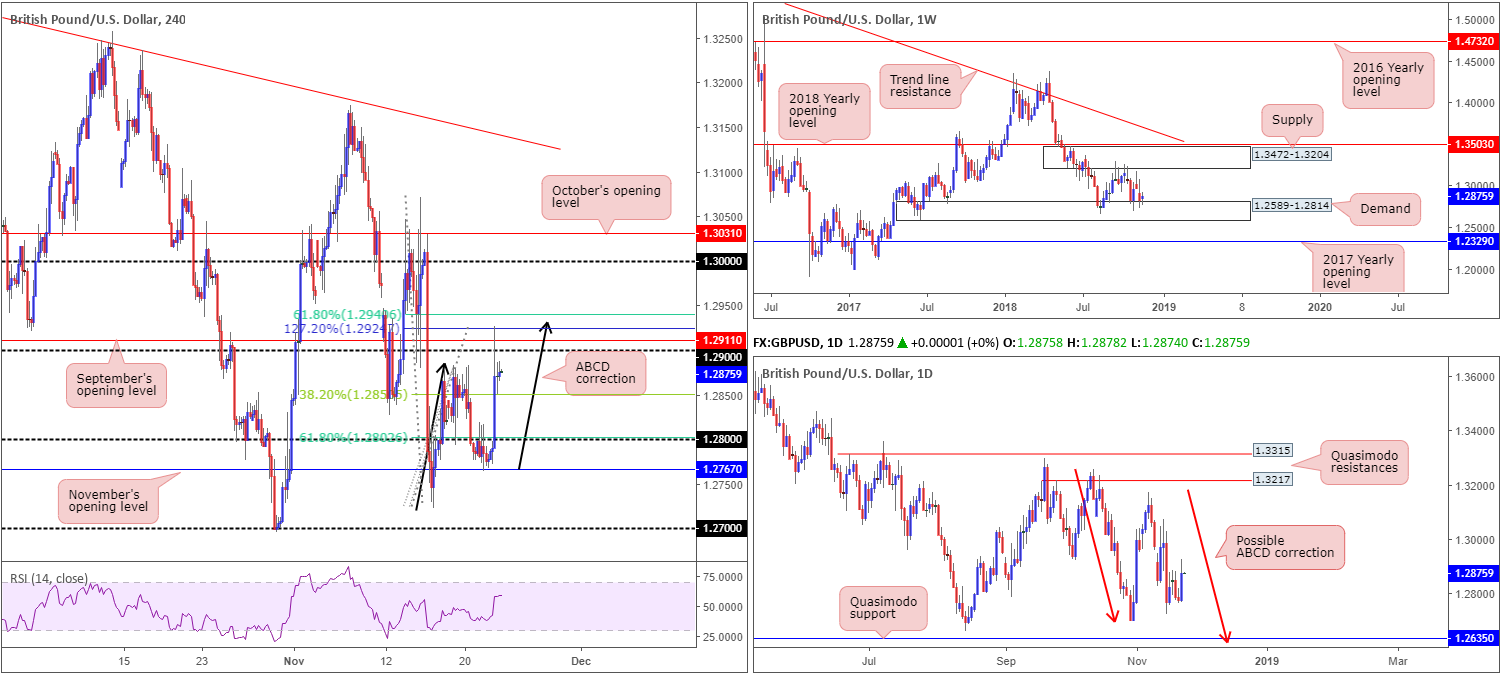
GBP/USD:
As news broke the UK and the EU agreed a draft text setting out a close post-Brexit relationship, the British pound soared against its US counterpart. European Council President Tusk said the text has been agreed at the negotiators level and agreed in principle at political level, subject to the endorsement of the leaders’ ahead of Sunday’s summit.
In the shape of a H4 ABCD (black arrows) bearish formation, the pair cleared 1.28 and only lost momentum through 1.29 after connecting with the chart’s ABCD 127.2% bearish point at 1.2924. According to the H4 timeframe, Downside targets from the recently completed ABCD formation fall in at the 38.2% Fib support drawn from 1.2850 and the 61.8% Fib support at 1.2803. Both targets have already been hit, and therefore could signify we’re likely heading for ground above 1.29 today, possibly targeting the 61.8% Fib resistance value at 1.2941.
On a wider perspective, higher-timeframe structure remains unchanged:
Weekly price, as highlighted in previous reports, remains limited to a consolidation carved from demand at 1.2589-1.2814 and a supply drawn from 1.3472-1.3204 (price is currently testing the lower edge of this range). A closer look at price action on the daily timeframe, nevertheless, shows the unit positioned within close proximity to the 1.2695 Oct 30 low. While a response from this neighbourhood is possible, the Quasimodo support seen at 1.2635 remains an appealing level, given the amount of stop-loss orders likely positioned beneath the said low and the 1.2661 Aug 15 low (taking out these stops provide liquidity for pro money to buy), along with a possible ABCD approach (red arrows) terminating just south at 1.2614.
Areas of consideration:
With the political picture essentially pointing to more of a bullish GBP, along with the weekly chart showing the pair testing demand and H4 action poised to possibly breach 1.29, further upside is likely in store.
Ultimately, before pressing the buy button, traders are urged to wait for the 61.8% H4 Fib resistance value at 1.2941 to be taken out. With this level out of the picture, followed by a retest of 1.29 as support (preferably in the shape of a bullish candlestick pattern – entry/stop parameters can be defined according to this configuration), a long targeting 1.30 would be in the offing.
Today’s data points: Limited.
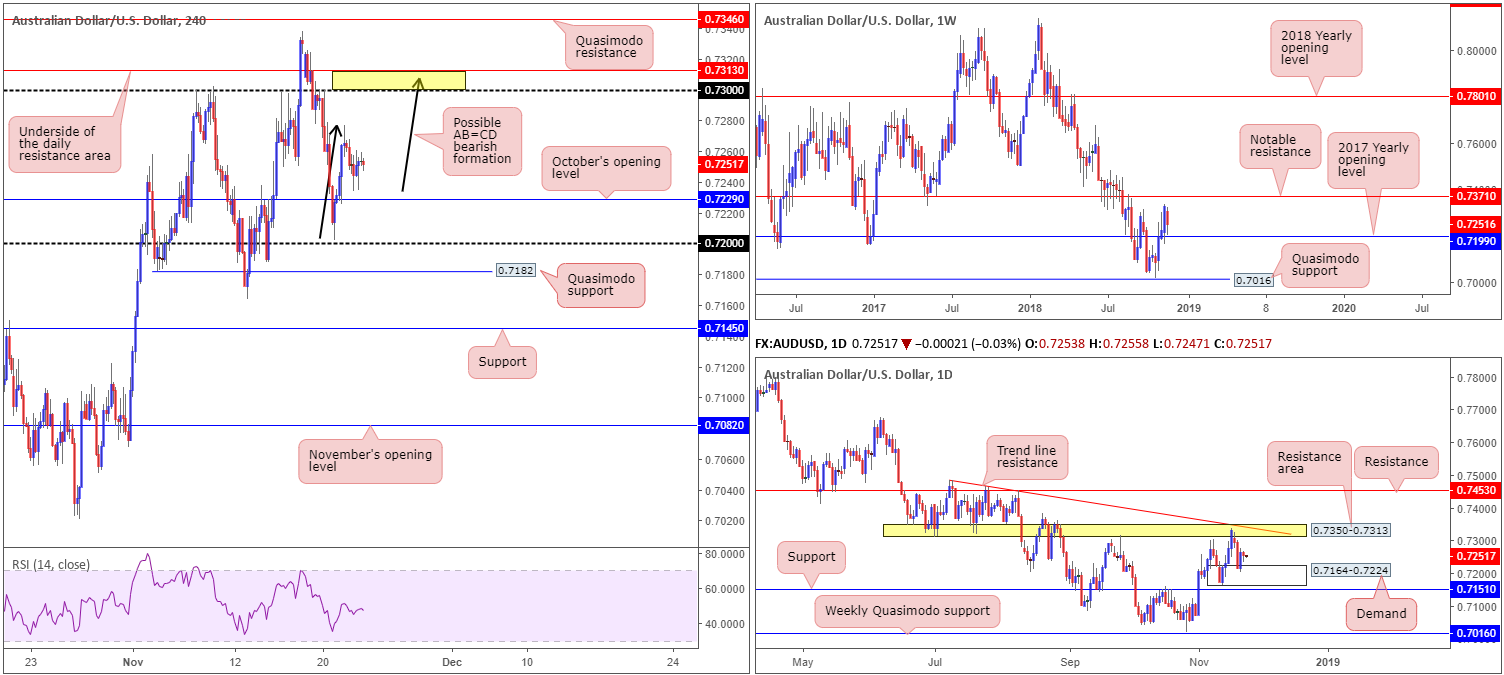
AUD/USD:
In recent sessions, the market observed the H4 candles shuffle their feet just north of October’s opening level at 0.7229 amid thin holiday trade. In the event buyers regain consciousness, the 0.73 handle is in view as the next upside target on the H4 timeframe. Note this psychological level held beautifully as resistance on Nov 8 and 15 and also on Monday after the barrier failed to offer support.
According to our technical studies on the daily timeframe, further buying could be on the table after Wednesday’s decisive recovery candle printed from demand at 0.7164-0.7224. The next area of interest on this scale falls in at a resistance zone drawn from 0.7350-0.7313/trend line resistance (taken from the high 0.7483). On a wider perspective, however, the weekly candles are seen trading between a notable resistance at 0.7371 and the 2017 yearly opening level at 0.7199.
Areas of consideration:
The 0.73 handle is an attractive resistance, not only due to its historical significance but also the potential for a H4 ABCD bearish formation (black arrows) to complete just north of 0.73. In addition to this, 0.73 is sited just south of the current daily resistance area at 0.7350-0.7313.
Therefore, between 0.7313/0.73 (yellow) is a worthy area for possible selling opportunities. Given the zone is relatively small, however, traders may want to exercise patience as a fakeout through the area is likely. Waiting and seeing if a H4 bearish candlestick formation takes shape not only helps provide seller intent, it’ll also avoid the likelihood of being stopped on a fakeout, and also offer entry/stop parameters.
Today’s data points: Limited.
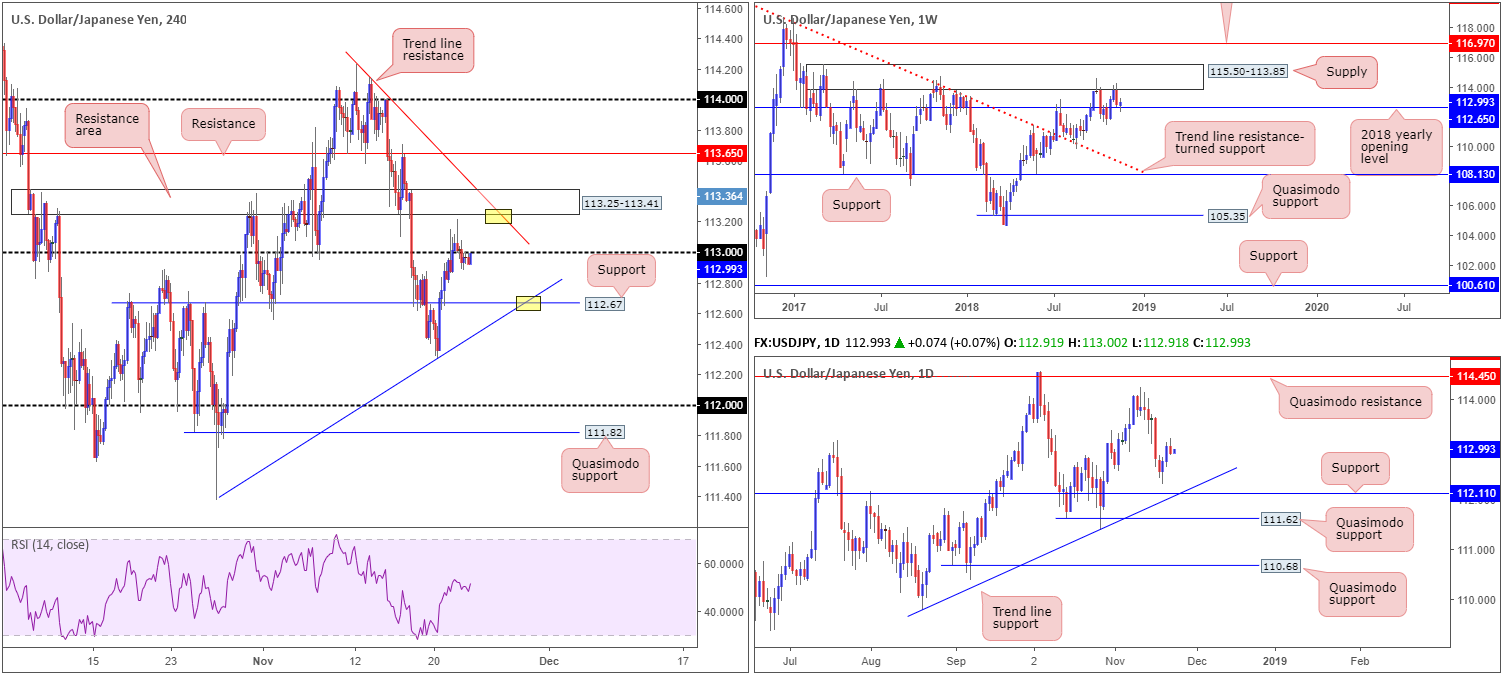
USD/JPY:
Lifeless around its 1.13 level, the USD/JPY pair gained little traction either way Thursday, thanks to the closure of US banks in observance of Thanksgiving Day. In light of recent movement, the research team’s outlook remains unchanged.
Although weekly price indicates further upside could be in store from its 2018 yearly opening level at 112.65 towards notable supply priced in at 115.50-113.85, a hefty H4 resistance area is seen lurking above 113 at 113.25-113.41. Note the H4 zone also merges closely with a trend line resistance (extended from the high 114.23).
In terms of daily structure, areas worth keeping an eyeball on are support at 112.11, which, as you can see, merges nicely with trend line support (extended from the low 109.77).
Areas of consideration:
With a reasonably strong resistance area planted directly above 113 on the H4 scale at 113.25-113.41, entering long in this market is challenging despite where we’re trading from on the weekly timeframe at the moment.
On the whole, the only areas offering a possible bounce today are marked in yellow:
- H4 support at 112.67 that converges with trend line support (taken from the low 111.95).
- H4 resistance area at 113.25-113.41 that merges with trend line resistance (extended from the high 114.23).
Today’s data points: Japanese banks closed in observance of Labor Thanksgiving Day.
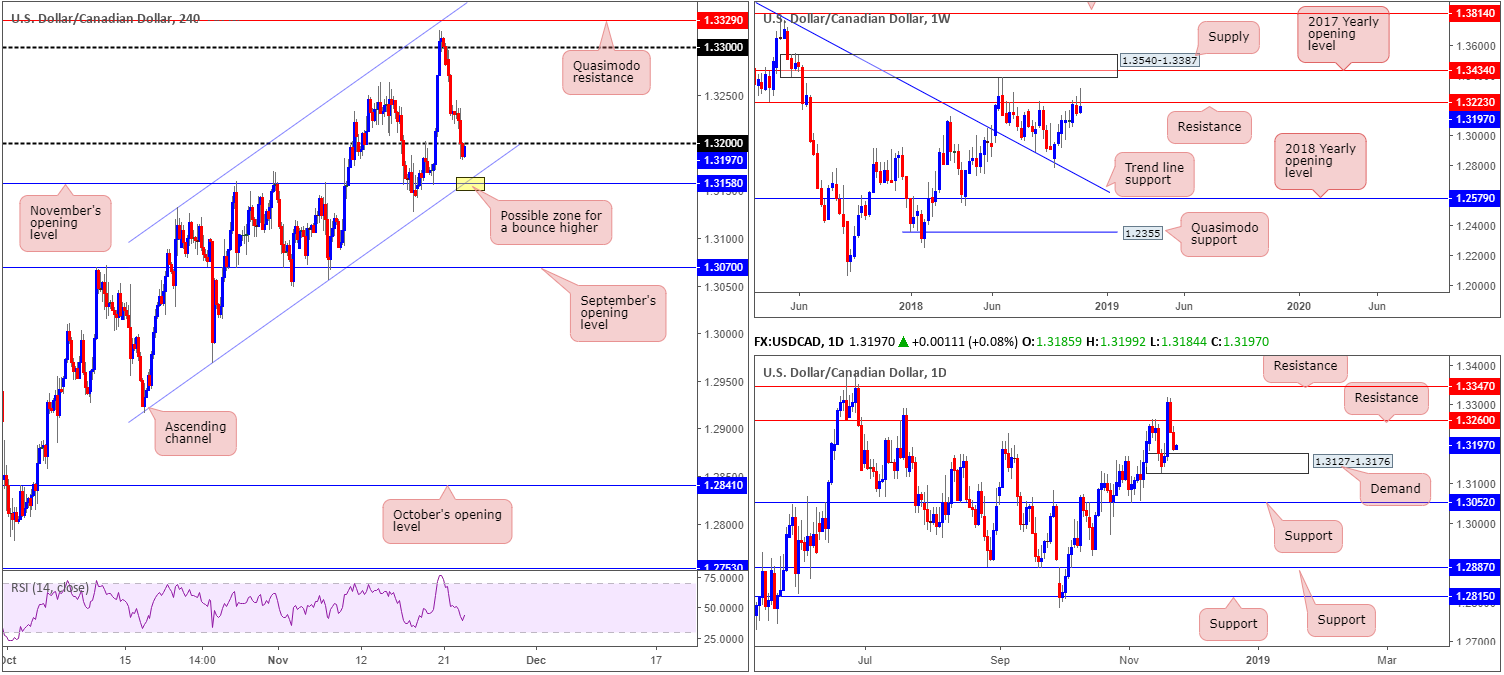
USD/CAD:
In spite of US banks closing in observance of Thanksgiving Day, the US dollar ceded further ground to the Canadian dollar Thursday. This has firmly positioned the current weekly candle back beneath its resistance level coming in at 1.3223, trading in the shape of a bearish pin-bar candlestick formation. Downside support from this region is limited, with the next base not visible until trend line resistance-turned support (taken from the high 1.4689).
Recent selling also brought the H4 candles sub 1.32, potentially clearing the river south towards November’s opening level at 1.3158, which happens to converge with channel support (extended from the low 1.2916). Traders may also want to acknowledge daily price is seen trading within striking distance of demand at 1.3127-1.3176, which encases November’s opening level mentioned above on the H4 timeframe at 1.3158.
Areas of consideration:
Having observed daily price hovering just north of demand, entering short on any retest of 1.32 on the H4 scale is a challenge despite weekly price establishing ground beneath resistance.
The research team continues to eye November’s opening level mentioned above at 1.3158 as a possible base for longs. Not only does it converge with H4 channel support, it is positioned within the walls of daily demand at 1.3127-1.3176. The only grumble, of course, is the fact we may have weekly sellers in the mix.
Should 1.3158 be of interest for longs, conservative traders may look to position stop-loss orders beyond daily demand (1.3127), providing over a 1:1 ratio in terms of risk/reward towards 1.32 (the initial upside target from 1.3158).
Today’s data points: Canadian inflation and retail sales figures.
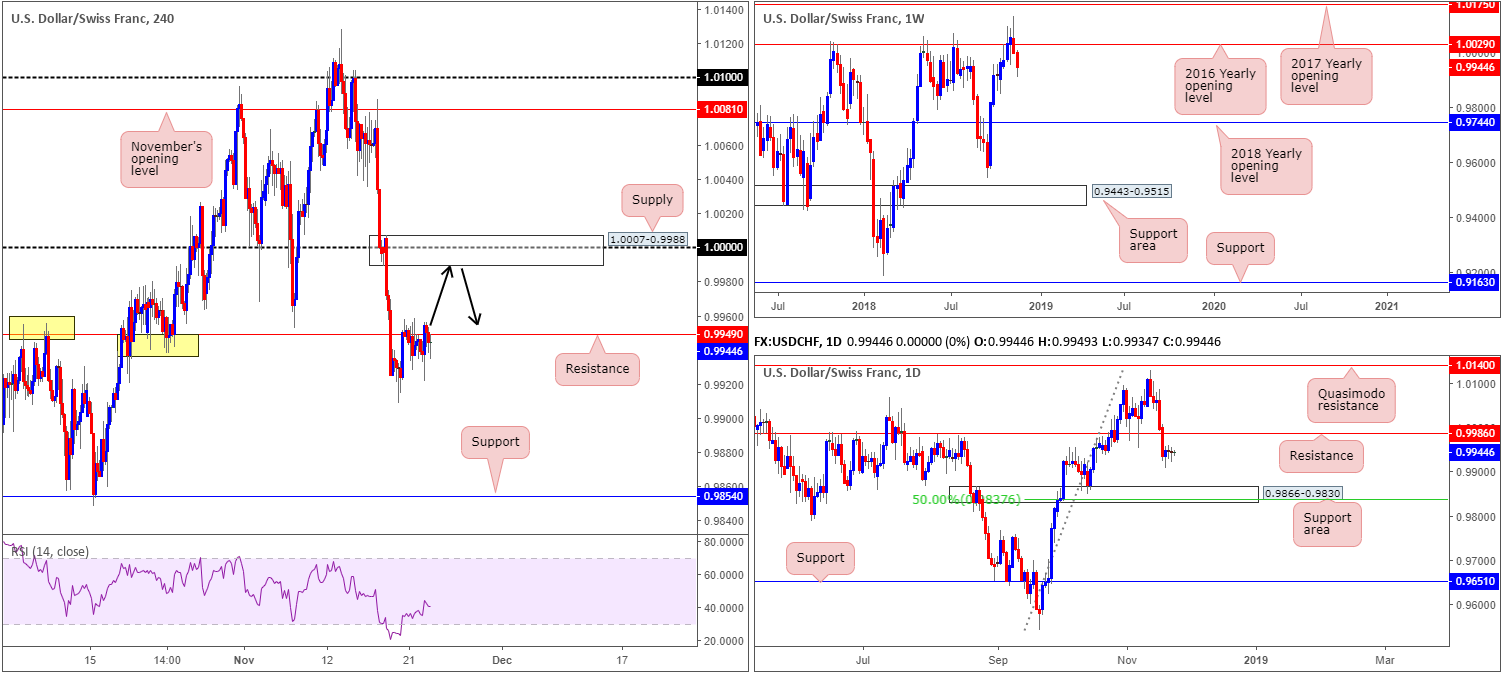
USD/CHF:
USD/CHF price is effectively unchanged for a second consecutive day this morning, as H4 action continues hugging the underside of resistance priced in at 0.9949. Given the lackluster performance, much of the following analysis remains similar to yesterday’s briefing…
Though the current H4 resistance level is holding ground, 1.0000 (parity) is seen lurking directly above it, which, as you can see, happens to be encased within a rather attractive H4 supply area at 1.0007-0.9988. On a wider perspective, however, weekly movement continues to reflect a bearish stance beneath its 2016 yearly opening level at 1.0029, with the possibility of price pushing as far south as the 2018 yearly opening level at 0.9744. Daily flow, on the other hand, shows resistance resting nearby at 0.9986, and a support area posting up below at 0.9866-0.9830.
Areas of consideration:
1.0000, in particular the H4 supply area surrounding the number at 1.0007-0.9988, remains attractive for shorts. The lower edge of the H4 supply is seen sited two pips above daily resistance at 0.9986, making it a prime location for active sellers to make an appearance.
As for stop-loss placement, above the aforementioned H4 supply appears reasonable. With respect to an initial take-profit target, the top edge of a daily support area at 0.9866-0.9830 appears logical, followed closely by H4 support at 0.9949.
Today’s data points: Limited.
Dow Jones Industrial Average:
Coming in from the top this morning, weekly price remains trading beneath its 2018 yearly opening level at 24660, though is still supportive off nearby trend line support (extended from the low 23055).
A closer read brings in the daily candles, which, as you can see, are loitering just north of a Quasimodo support level at 24224. Note this level has already proven itself as a valid base, given the reaction observed back in late October.
Lower down on the curve, the H4 candles are seen establishing mild support off a 127.2% Fib extension point at 24351, positioned just north of a channel support (extended from the low 24769). In addition to this, the RSI indicator is currently displaying a divergence/oversold reading.
Areas of consideration:
In view of the overall market picture, a break beyond the 127.2% H4 Fib extension point at 24351 towards the daily Quasimodo support at 24224 is likely before any serious buyers make a show. A test of 24224 in the shape of a H4 bullish candlestick formation (entry/stop parameters can be defined according to this configuration) would, according to our studies, likely be sufficient enough to draw in buyers and push higher.
Today’s data points: Limited.

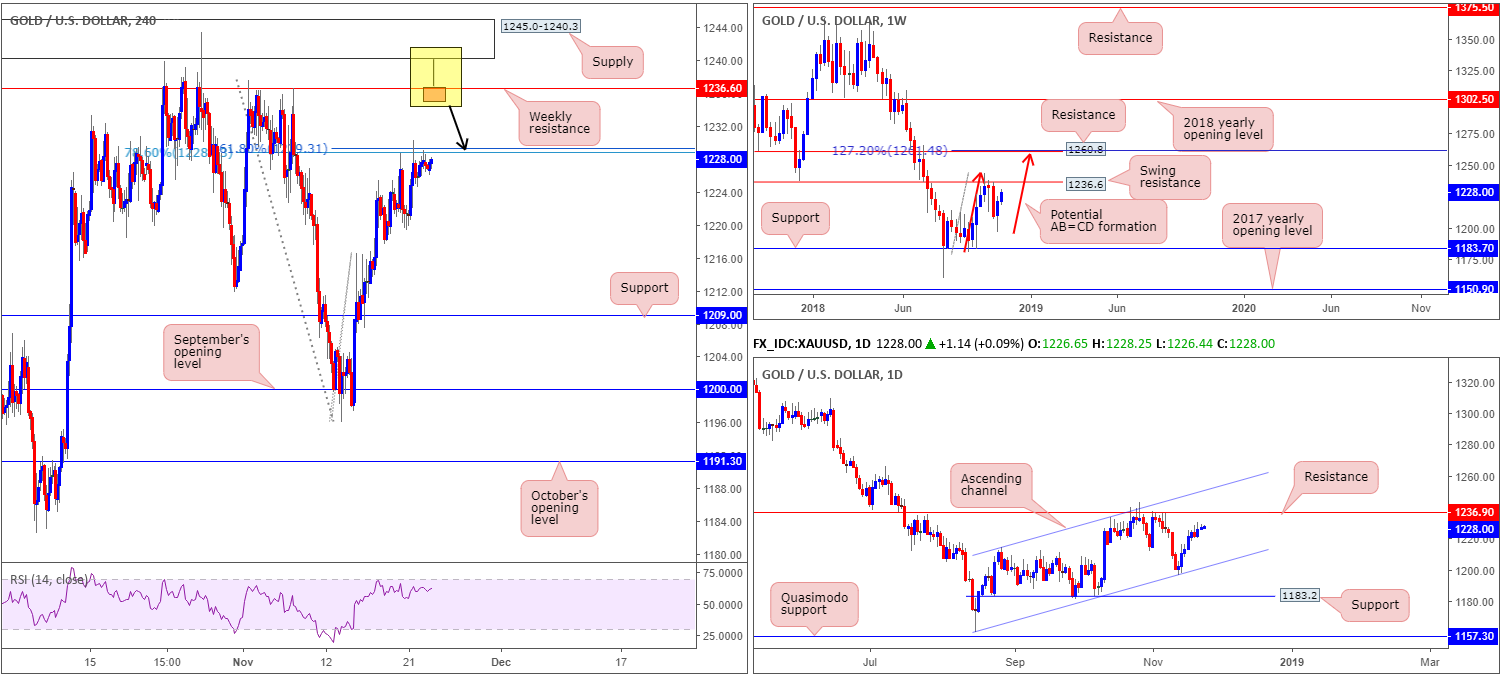
XAU/USD (Gold):
Ranging no more than $4 on the day, Thursday’s action witnessed subdued movement as the H4 candles continued hugging the underside of a 78.6% Fib resistance at 1228.7/161.8% Fib ext. point at 1229.3.
Whether additional selling will take place from the noted Fibonacci levels remains difficult to judge. We say this simply because both weekly and daily timeframes exhibit room to track higher ground:
- Weekly price shows space to maneuver until swing resistance priced in at 1236.6 is brought into the mix. Another consideration worth noting on the weekly timeframe is the potential for an AB=CD (red arrows) 127.2% bearish formation to complete just north of another layer of resistance (1260.8) at 1261.4.
- Looking at this market in more detail, we can see the yellow metal is currently compressing within an ascending channel formation (1160.3/1214.3) on the daily timeframe, with the candles possibly working their way towards a test of resistance at 1236.9 (essentially representing the weekly swing resistance mentioned above at 1236.6).
Areas of consideration:
With the above in mind, the research team still feels bullion is likely to press higher.
While a bounce from the current H4 Fib levels has taken form, the majority of traders will still likely be honing in on the weekly resistance level at 1236.6. With H4 supply at 1245.0-1240.3 positioned just north of this weekly line, traders should prepare for the possibility of a fakeout play. Therefore, in the event a H4 bearish pin-bar formation take shape that pierces through the weekly resistance and tests the H4 supply (see H4 chart for a visual), this would be considered a high-probability shorting opportunity (stop-loss orders can be positioned either beyond the noted H4 supply or a few pips above the pin-bar’s wick).
The use of the site is agreement that the site is for informational and educational purposes only and does not constitute advice in any form in the furtherance of any trade or trading decisions.
The accuracy, completeness and timeliness of the information contained on this site cannot be guaranteed. IC Markets does not warranty, guarantee or make any representations, or assume any liability with regard to financial results based on the use of the information in the site.
News, views, opinions, recommendations and other information obtained from sources outside of www.icmarkets.com.au, used in this site are believed to be reliable, but we cannot guarantee their accuracy or completeness. All such information is subject to change at any time without notice. IC Markets assumes no responsibility for the content of any linked site. The fact that such links may exist does not indicate approval or endorsement of any material contained on any linked site.
IC Markets is not liable for any harm caused by the transmission, through accessing the services or information on this site, of a computer virus, or other computer code or programming device that might be used to access, delete, damage, disable, disrupt or otherwise impede in any manner, the operation of the site or of any user’s software, hardware, data or property.