
A note on lower timeframe confirming price action…
Waiting for lower timeframe confirmation is our main tool to confirm strength within higher timeframe zones, and has really been the key to our trading success. It takes a little time to understand the subtle nuances, however, as each trade is never the same, but once you master the rhythm so to speak, you will be saved from countless unnecessary losing trades. The following is a list of what we look for:
- A break/retest of supply or demand dependent on which way you’re trading.
- A trendline break/retest.
- Buying/selling tails – essentially we look for a cluster of very obvious spikes off of lower timeframe support and resistance levels within the higher timeframe zone.
- Candlestick patterns. We tend to only stick with pin bars and engulfing bars as these have proven to be the most effective.
For us, lower timeframe confirmation starts on the M15 and finishes up on the H1, since most of our higher timeframe areas begin with the H4.
EUR/USD:
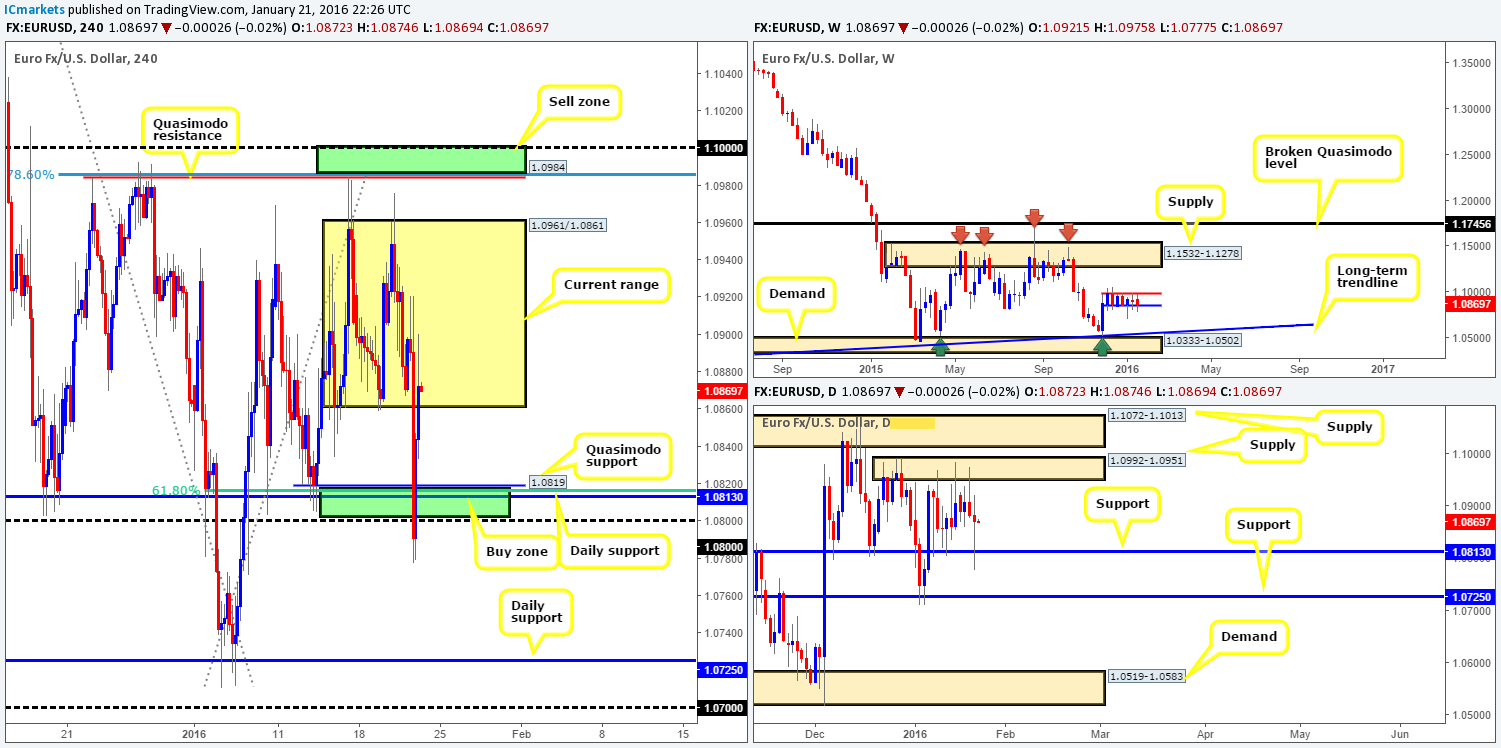
Following Draghi’s comments regarding the possibility of further easing in March, the EUR currency dropped liked a box of lemmings! Price aggressively broke below the current H4 range between 1.0961/1.0861, whipsawed through our H4 buy zone below at 1.0800/1.0819, and pulled back up to within the aforementioned range to close the day relatively unchanged. We hope none of our readers got burnt by this aggressive move.
Granted, one could now come to the conclusion that stops were triggered beneath both the H4 range and the lower H4 buy zone freeing the path south for further selling. However, due to how quickly price moved here, whipsaws such as these often leave behind unfilled buy orders thus once again potentially formulating a concentration of bids at the above said zones.
Therefore, since price saw little change at the close, copied from yesterday’s report here is what we’ll be keeping an eye on in today’s trade:
For buys:
One can look to buy from the H4 range support at 1.0861 since this barrier converges nicely with the lower weekly band support perfectly (see above). Nevertheless, we would still advise waiting for the lower timeframes to prove buying strength exists here before risking capital. Reason being is below sits a H4 a Quasimodo support at 1.0819, a psychological support at 1.0800, a 61.8% Fibonacci support at 1.0815 and daily support at 1.0813, consequently forming a key buy zone to keep a tab on.
For sells:
Shorts from the H4 range resistance 1.0961 is certainly a possibility due to it converging nicely with daily supply at 1.0992-1.0951 (lower timeframe confirmation required). Despite this, a fakeout above this line is highly likely in our opinion, as directly above hangs a H4 Quasimodo resistance level at 1.0984, a Fibonacci level at 1.0985 and a psychological resistance barrier at 1.1000. All of this coupled with price sitting within the extremes of the aforementioned daily supply, and also fusing beautifully with the weekly upper band at 1.0983 makes this a key sell zone to keep an eye on.
Levels to watch/live orders:
- Buys: 1.0861 [Tentative – confirmation required] (Stop loss: dependent on where one confirms this level). 1.0819/1.0800 [Tentative – confirmation preferred] (Stop loss: dependent on where one confirms this area).
- Sells: 1.0961 [Tentative – confirmation required] (Stop loss: dependent on where one confirms this level). 1.0984/1.1000 [Tentative – confirmation preferred] (Stop loss: dependent on where one confirms this area).
GBP/USD:
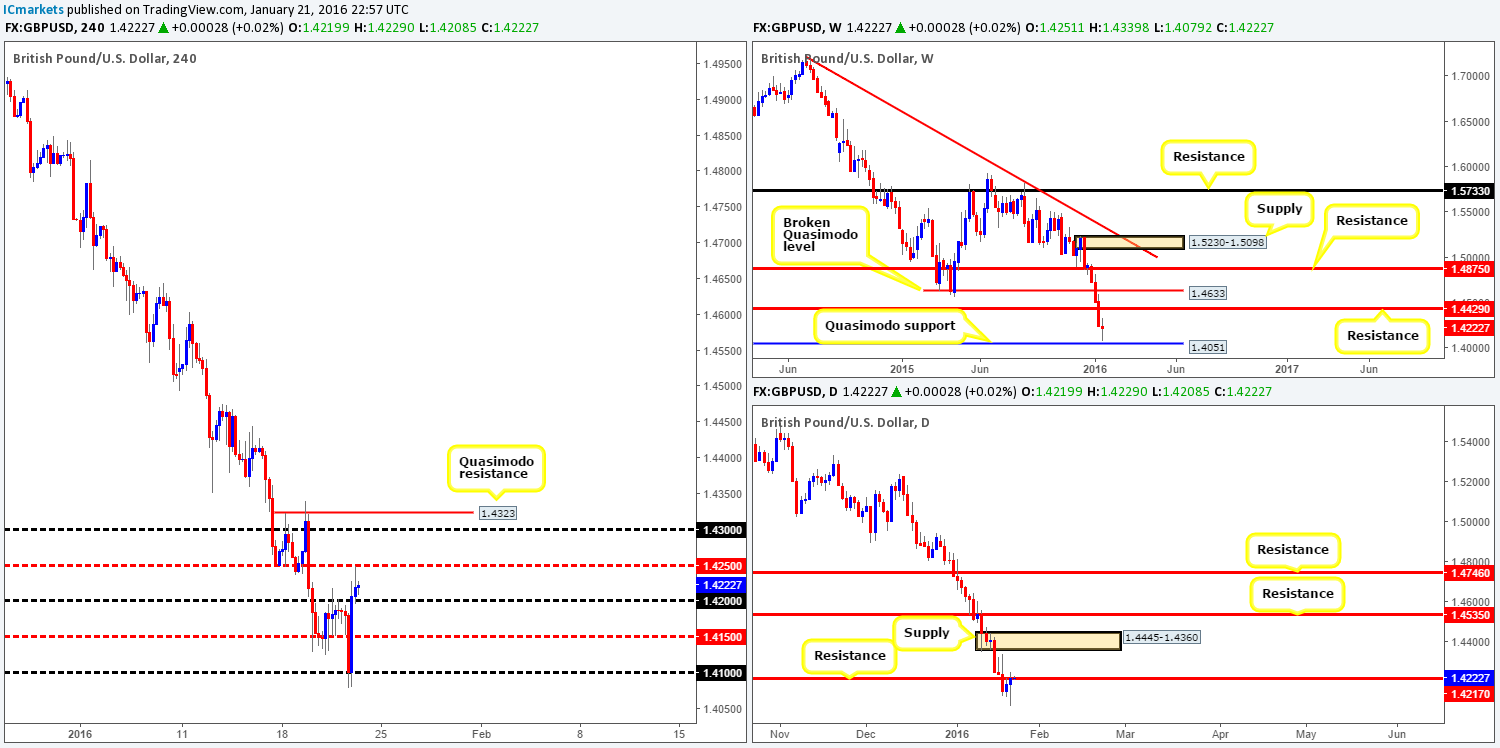
Kicking off this morning’s analysis with a peek at the weekly timeframe shows that price came so very close to connecting with the Quasimodo support barrier at 1.4051 in recent trade, before advancing higher. In the event that weekly bids were triggered here, there is a possibility that Cable could extend its arms up to resistance coming in at 1.4429 in the near future. Despite this, daily action reveals that although yesterday’s movement produced a beautiful buying tail, it is now lodged beneath the underside of resistance drawn from 1.4217. As such, until this road block is cleared, the GBP has (at least technically) little chance of reaching the above said weekly resistance.
Turning our attention to the H4 timeframe, we can see that the market whipsawed lower mid-way through yesterday’s London morning trade. This brought about an aggressive 100-pip decline into psychological support 1.4100, which, just as aggressively saw price bounce back over 100 pips, pushing this market above psychological resistance 1.4200 and into offers around mid-level resistance 1.4250 by the day’s end.
This, at least for us, really is a tricky one to pick today. On the one hand we have possible longs coming in from the weekly timeframe, and on the other hand, price is seen trading at resistance on both the daily and H4 timeframes (see above). For us personally, technical elements are too mixed at the moment, leaving us with little choice to remain flat for now.
Levels to watch/live orders:
- Buys: Flat (Stop loss: N/A).
- Sells: Flat (Stop loss: N/A).
AUD/USD:
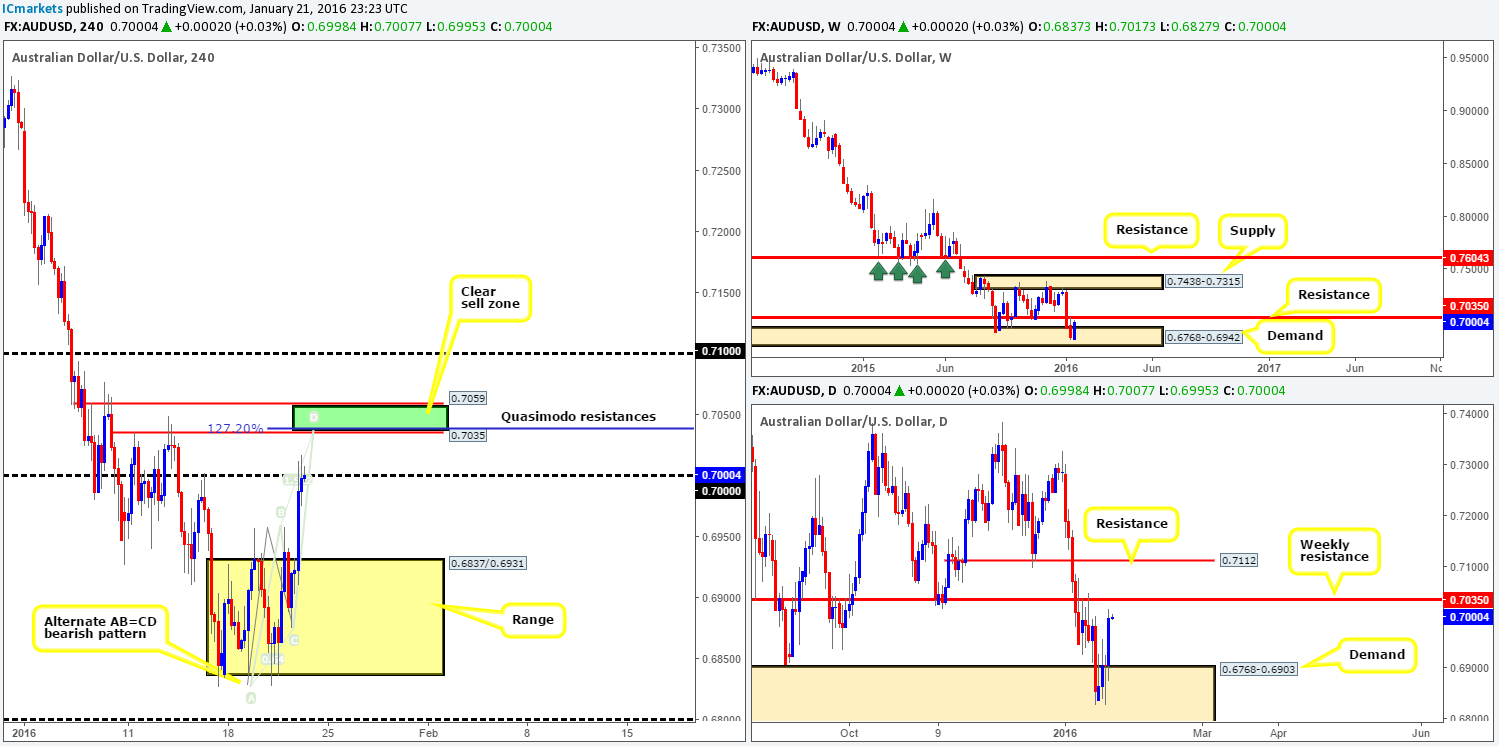
Early on in U.S. trade yesterday, the Aussie was heavily bid above the H4 range resistance 0.6931 up to the large psychological resistance 0.7000. Given the selling wicks currently being printed here on the H4, would we consider this a viable platform to short today? Well, as much as we love our round numbers, no we would not. The reasons for why are as follows:
- Directly above 0.7000 sits two H4 Quasimodo resistances at 0.7059 and 0.7035.
- 0.7035, the lower of the two Quasimodo levels happens to also be a weekly resistance level.
- The approach seen on the H4 is very close to completing a near-perfect H4 alternate AB=CD bearish pattern (0.7039).
- In between also sits mid-level resistance 0.7050.
Due to the collection of structures forming here, our team is going to place a pending sell order at 0.7034, with a stop at 0.7066 (above the upper Quasimodo high). Yes, this is a rather large stop, but considering that this setup contains weekly resistance, the move from here could be quite substantial.
Levels to watch/live orders:
- Buys: Flat (Stop loss: N/A).
- Sells: 0.7034 [Pending order] (Stop loss: 0.7066).
USD/JPY:
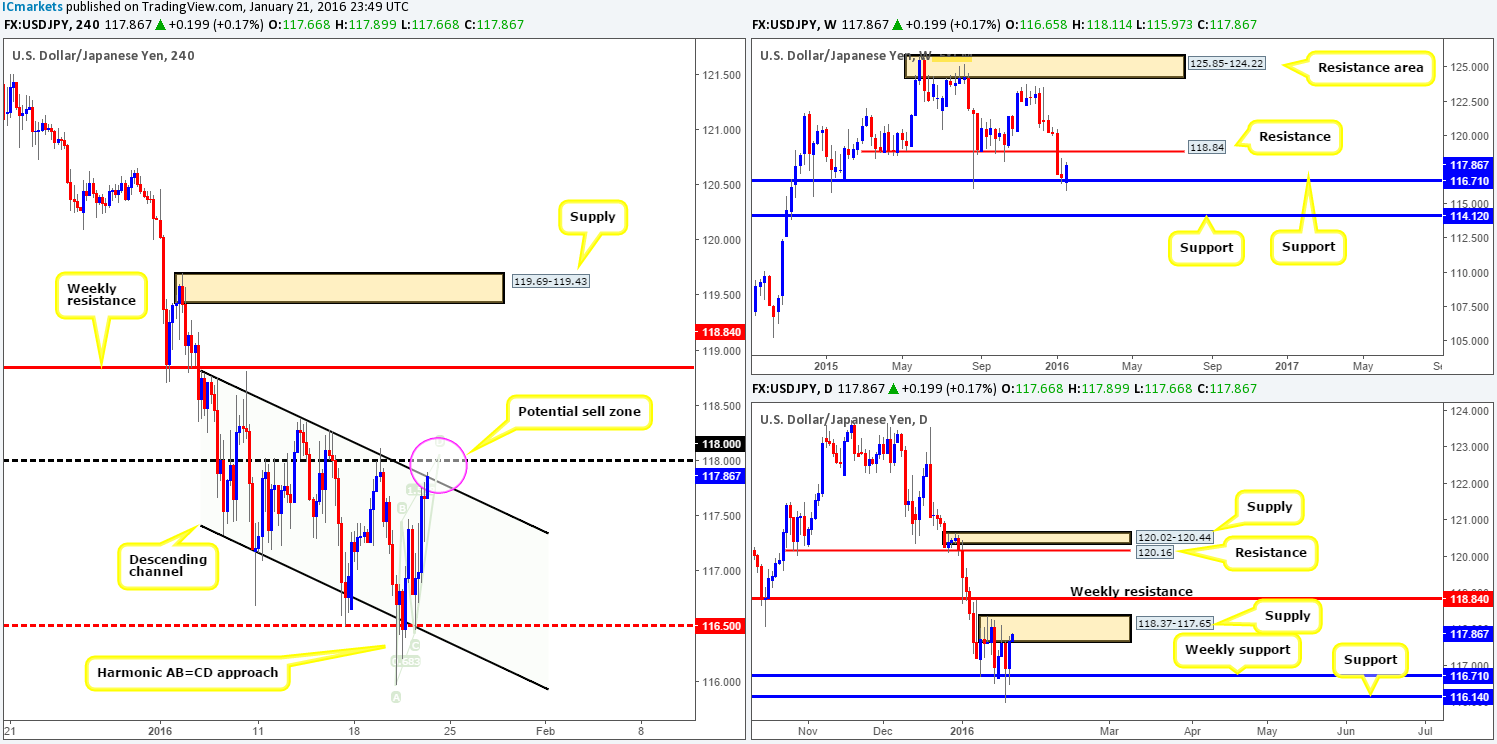
The USD/JPY shows that early morning trade in London was well-bid from mid-level support 116.50. This buying, as you can see, continued throughout the London session and into U.S. trade as well, resulting in price colliding with the H4 channel resistance line extended from the high 118.81.
For traders who are contemplating a sell from this barrier today, there is, at least technically, a good chance of a bounce being seen from here. Not only is there a psychological resistance looming just above at 118.00, it is also seen encapsulated by a daily supply zone drawn from 118.37-117.65. In addition to this, the approach to this sell zone is in the form of a very tasty Harmonic AB=CD bearish pattern completing just above 118.00 at 118.02.
However, before placing a pending order here, you may want to check out where price is coming from – a weekly support at 116.71! Therefore, there is a possibility that the market may ignore this sell zone completely. As such, waiting for lower timeframe confirmation before committing capital to this sell may be the best bet.
Should this market remain well-bid today and close above 118.00, however, this would, as far as we see, consume the majority of offers residing within the current daily supply and open up the gates for prices to challenge weekly resistance at 118.84. In the event that this comes to fruition, and lower timeframe buying confirmation is seen following the retest, we would look to jump in long here targeting the weekly resistance.
Levels to watch/live orders:
- Buys: Watch for offers to be consumed around 118.00 and look to trade the any retest seen thereafter (lower timeframe confirmation required).
- Sells: 118.00 [Tentative – confirmation required] (Stop loss: dependent on where one confirms this level).
USD/CAD:
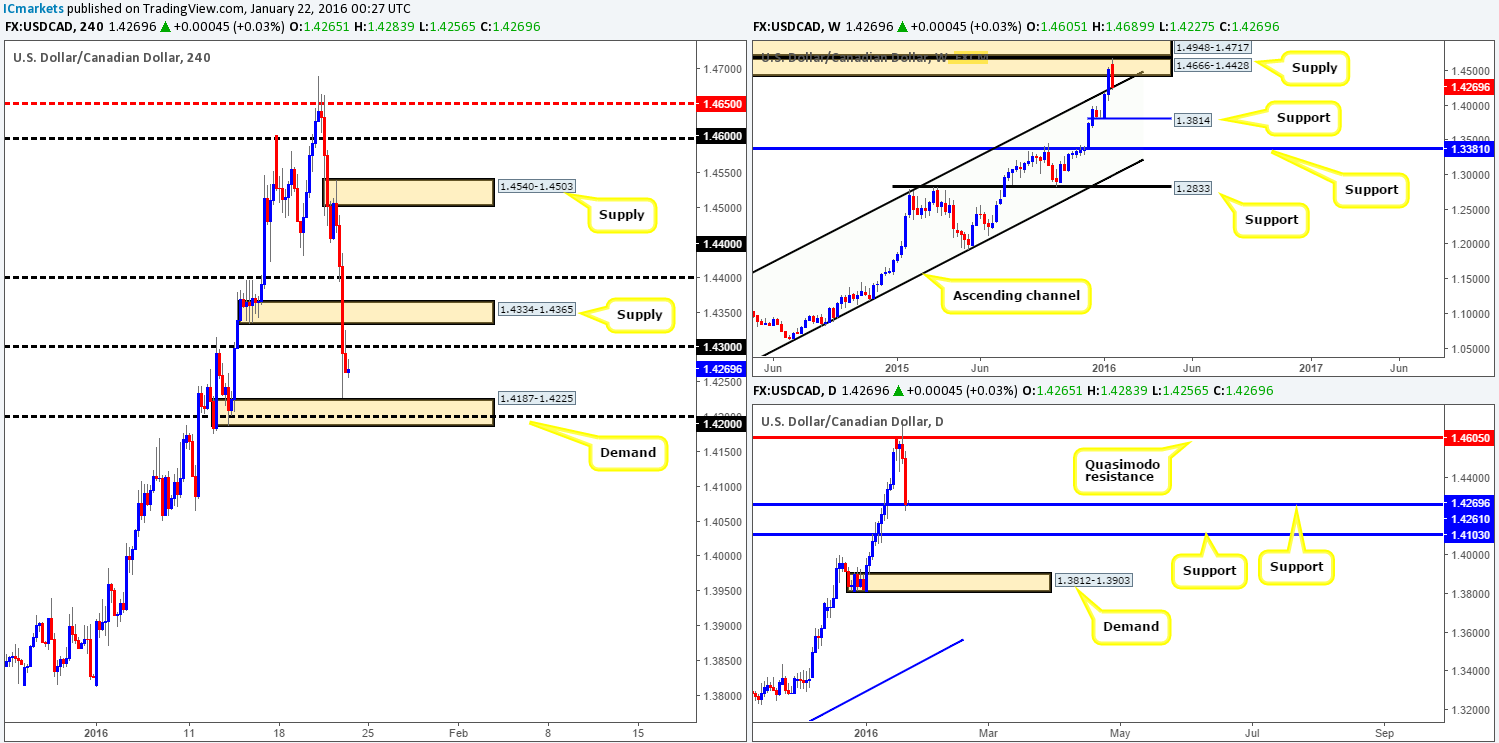
The U.S. dollar continued to sink against the Canadian dollar on Thursday losing close to 240 pips in value! Several technical barriers of support were taken out during this bearish onslaught and it was only once price connected with H4 demand at 1.4187-1.4225 did we see things begin to slow down. By and large, it should not come as much of a surprise as to why prices stabilized here, at least from a technical standpoint that is. Weekly action is now kissing the recently broken channel resistance (1.1173) as support, and down on the daily timeframe buyers are seen testing support at 1.4261.
Despite this recent selling, the Loonie is still in an incredibly strong uptrend at present. To that end, could longs be possible from this region today? They could, but, in our opinion, not at current prices. As far as we’re concerned, price is now lurking mid-range between the above said H4 demand and psychological resistance 1.4300 and to buy right now would skew risk/reward due to the large stop loss being required. Before we begin looking for confirmed longs into this market, we’d require price to drop and touch base with the H4 demand once again, preferably hitting psychological support 1.4200.
Levels to watch/live orders:
- Buys: 1.4187-1.4225 [Tentative – confirmation required] (Stop loss: dependent on where one confirms this area).
- Sells: Flat (Stop loss: N/A).
USD/CHF:
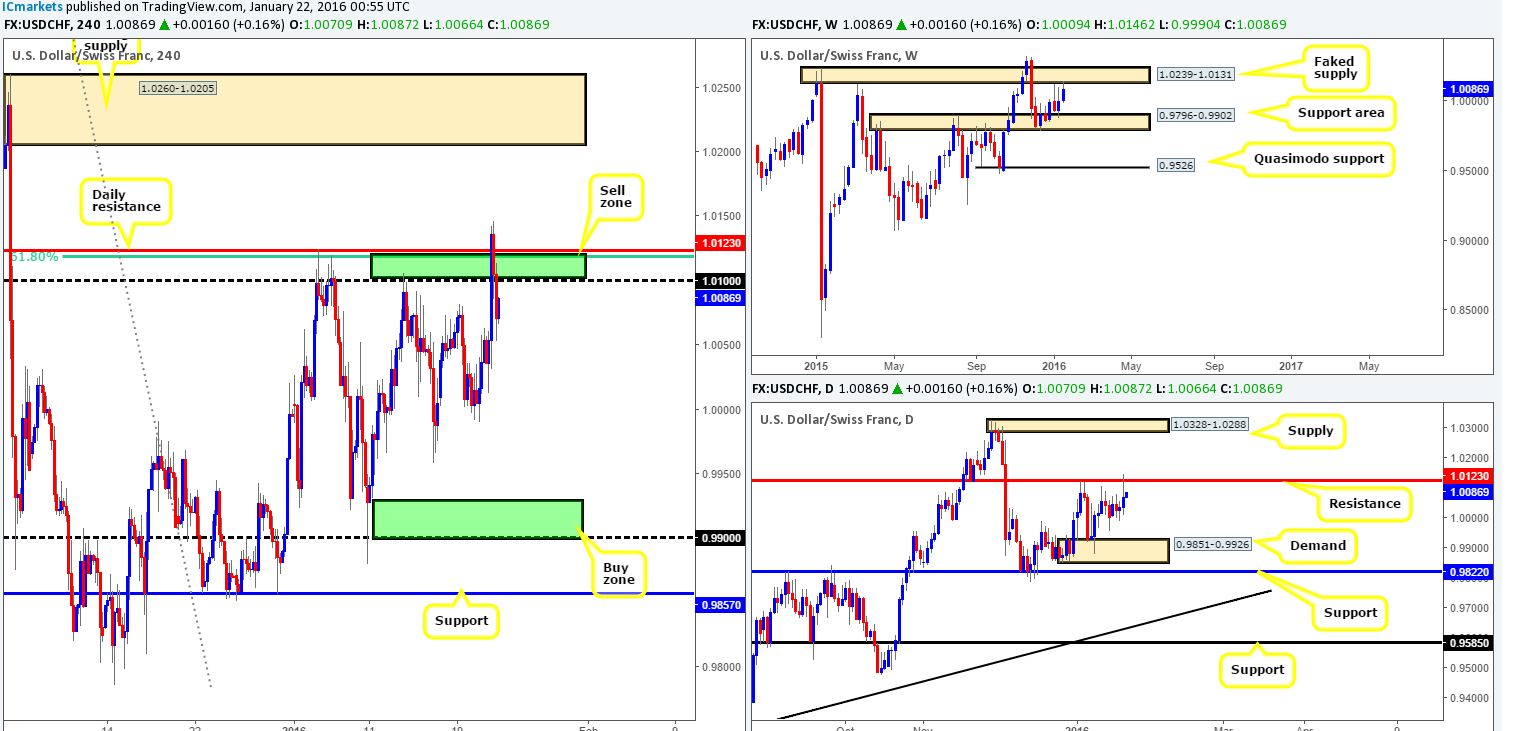
Beginning with the weekly timeframe this morning, it’s clear to see that price connected with the underside of a faked supply zone at 1.0239-1.0131 in recent trade. In-line with the weekly timeframe, the daily timeframe also shows price sold off from the underside of resistance coming in at 1.0123, consequently printing a relatively strong-looking selling wick.
Zooming in and looking at the H4 timeframe, we can see that following Draghi’s speech regarding the possibility of further easing, the USD/CHF rallied north whipsawing through our sell zone between 1.0100/1.0123, and closing the day at 1.0070.
Given where price is positioned on the higher timeframes right now (see above), our team believes there is still further downside to be seen from this pair yet. Yesterday’s fakeout above 1.0123 likely triggered in a ton of stops, but what it also did was likely leave behind unfilled sell orders as price moved so quick. Therefore, should price retrace to our H4 sell zone today, and print a lower timeframe sell setup (break of demand, selling wicks at lower timeframe resistance etc…), we’d look to short this market in hope of joining in on a move from the above said higher-timeframe resistances.
Levels to watch/live orders:
- Buys: Flat (Stop loss: N/A).
- Sells: 1.0100/1.0123 region [Tentative – confirmation required] (Stop loss: dependent on where one confirms this area).
DOW 30:
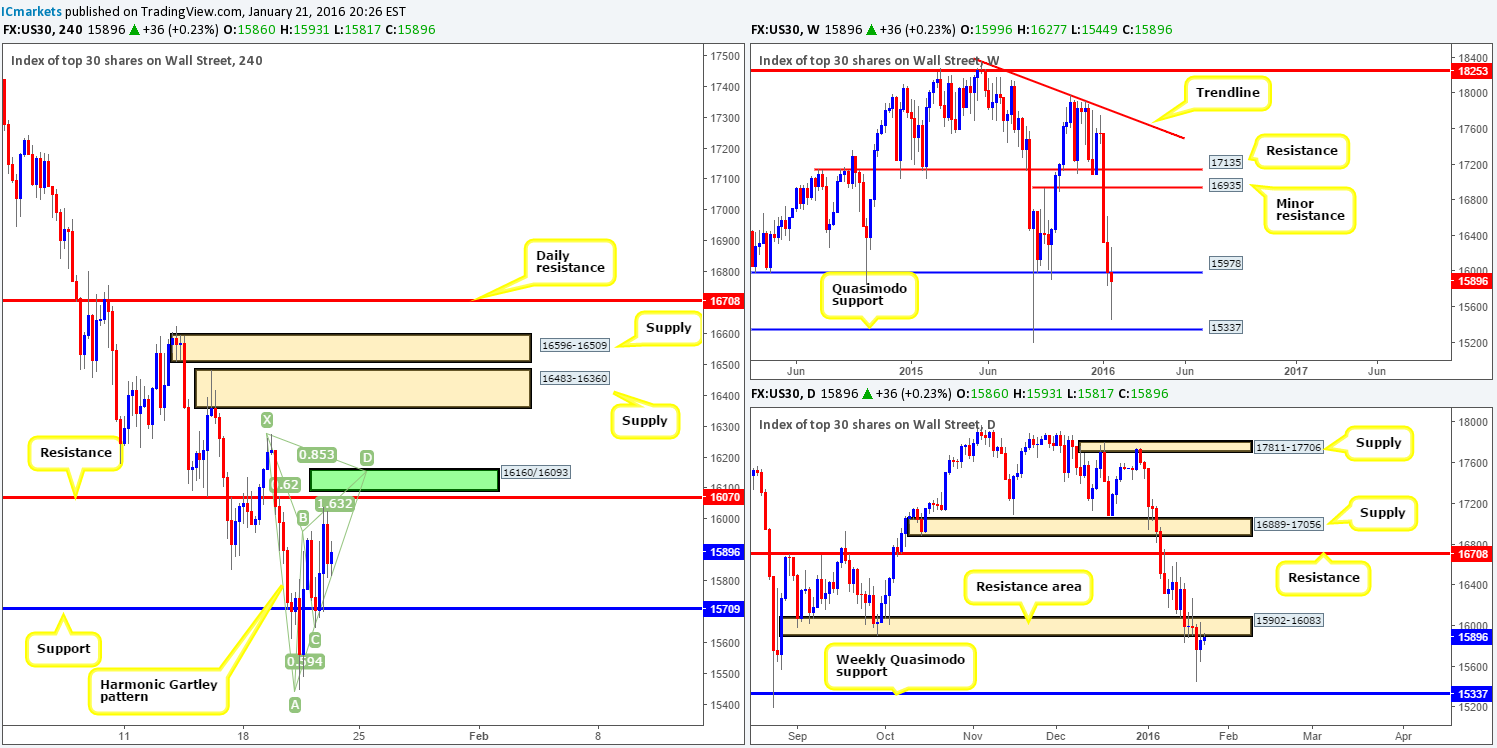
Based on recent H4 action, the DOW appears to be chalking up a nice-looking Harmonic Gartley pattern completing around the 16160/16093 area (green box). What is more, sitting just beneath this beauty is a H4 resistance level coming in at 16070, coupled with added support from the daily resistance area seen at 15902-16083.
Despite this Harmonic sell zone being a relatively strong-looking reversal zone, the only grumble we have is weekly action came quite close to connecting with a Quasimodo support at 15337 yesterday. Furthermore, it’s difficult, without seeing the weekly close, to know whether the 15978 weekly level will remain support or switch to resistance.
On account of the above, we feel the best way to approach this is to only enter short at the Harmonic H4 zone IF and only if there is corresponding lower timeframe confirmation seen.
Levels to watch/live orders:
- Buys: Flat (Stop loss: N/A).
- Sells: 16160/16093 [Tentative – confirmation required] (Stop loss: dependent on where one confirms this area).
XAU/USD: (Gold)
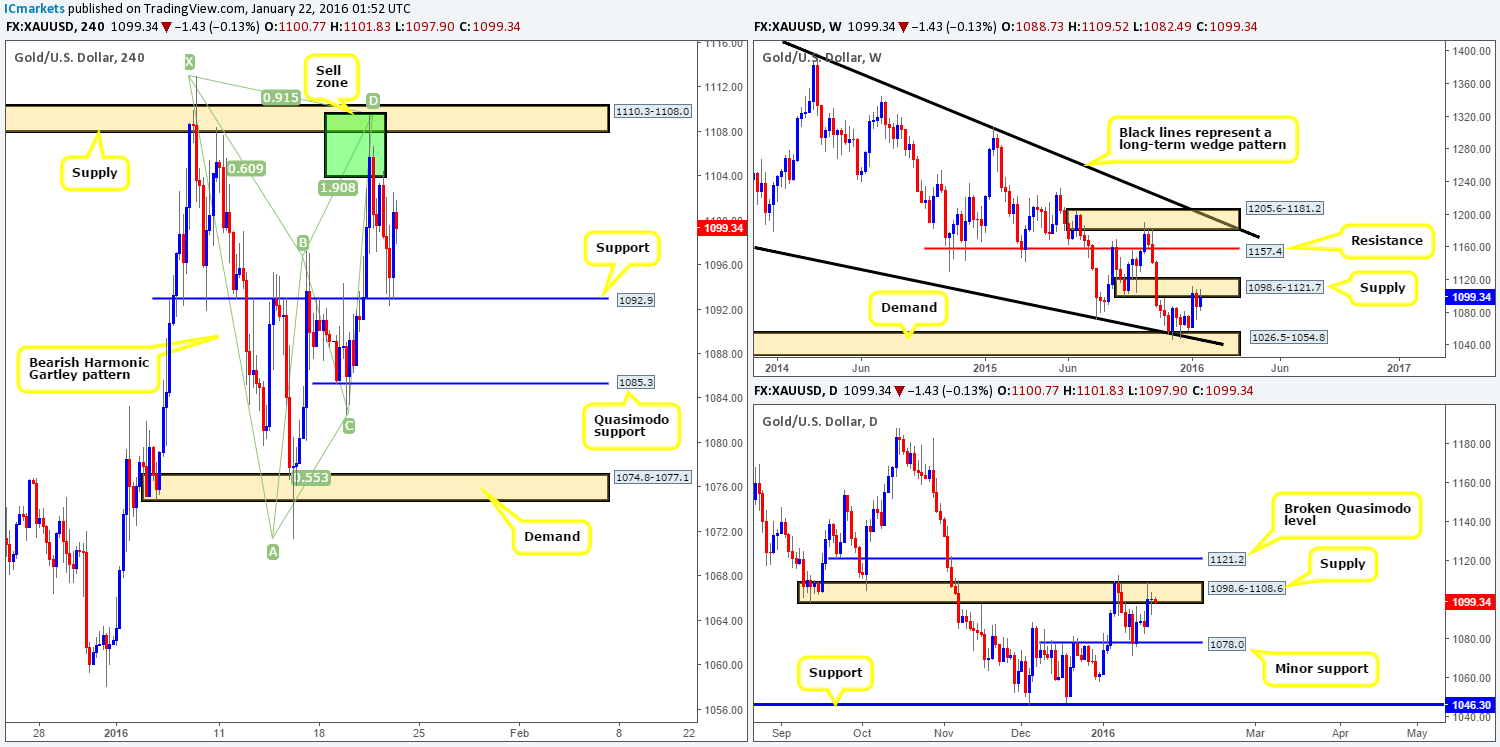
For those who read Wednesday’s report on Gold (http://www.icmarkets.com/blog/wednesday-20th-january-action-packed-day-of-news-on-the-docket-today-remain-vigilant/), you may recall us mentioning to keep an eye on the Harmonic Gartley reversal zone seen on the H4 between 1103.8/1110.3. As can be seen from the chart, price responded wonderfully to this reversal zone and has far dropped over $16 in value down to H4 support coming in at 1092.9. Well done to any of our readers who managed to lock in some green pips from this move.
Going forward, with the yellow metal still seen loitering at the underside of both weekly supply drawn from 1098.6-1121.7 and its partner supply on the daily timeframe at 1098.6-1108.6, buying this market is not something we’d be comfortable with. Therefore, unless you’re one of the traders who managed to short the Gartley reversal zone on Wednesday, the only opportunity available today, as far as we see, is on a break below and confirmed retest of the above said H4 support. Should this move come to fruition and we manage to get filled, we’ll immediately be targeting the H4 Quasimodo support below at 1085.3, followed by H4 demand seen just below it at 1074.8-1077.1.
Levels to watch/live orders:
- Buys: Flat (Stop loss: N/A).
- Sells: Watch for bids to be consumed around 1092.9 and look to trade any retest of this number seen thereafter (lower timeframe confirmation required).


