
A note on lower timeframe confirming price action…
Waiting for lower timeframe confirmation is our main tool to confirm strength within higher timeframe zones, and has really been the key to our trading success. It takes a little time to understand the subtle nuances, however, as each trade is never the same, but once you master the rhythm so to speak, you will be saved from countless unnecessary losing trades. The following is a list of what we look for:
- A break/retest of supply or demand dependent on which way you’re trading.
- A trendline break/retest.
- Buying/selling tails/wicks – essentially we look for a cluster of very obvious spikes off of lower timeframe support and resistance levels within the higher timeframe zone.
- Candlestick patterns. We tend to only stick with pin bars and engulfing bars as these have proven to be the most effective.
For us, lower timeframe confirmation starts on the M15 and finishes up on the H1, since most of our higher timeframe areas begin with the H4. Stops usually placed 5-10 pips beyond your confirming structures.
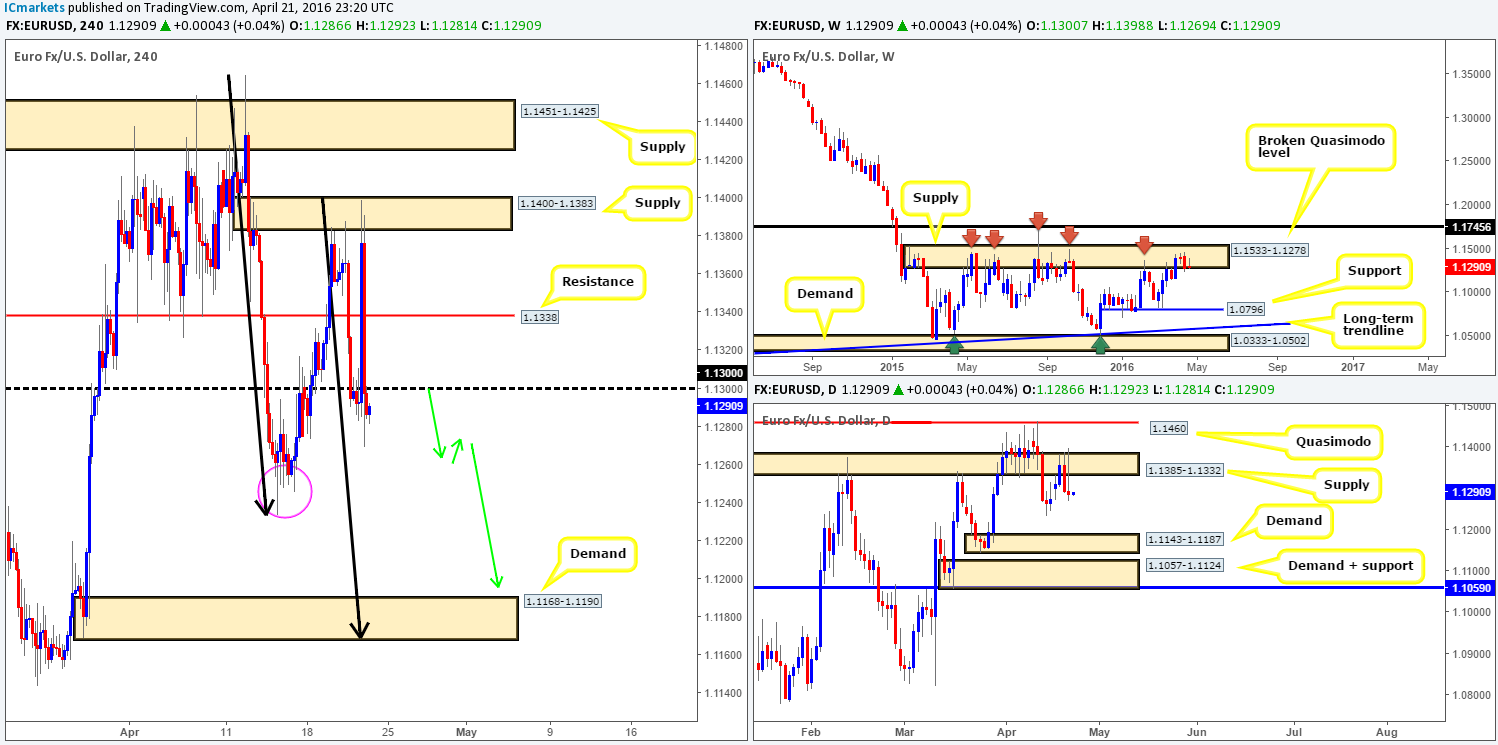
EUR/USD:
In recent H4 action, we can see that the single currency whipsawed to highs of 1.1398 (the extremes of a H4 supply at 1.1400-1.1383) before collapsing to lows of 1.1269. Fundamentally, this moment of volatility was largely derived from both the ECB’s decision to keep interest rates at 0.00%, and the following press conference. Technically, however, we’ve seen little difference to the overall structure of this market… Weekly action continues to trade within the confines of supply at 1.1533-1.1278, as well as daily supply drawn from 1.1385-1.1332 holding firm despite it suffering a slight breach yesterday.
Consequent to the above, we still feel that the EUR may try for at least the 1.1248 lows made on 14/15th April today (pink circle). To take advantage of this potential move, nevertheless, we’d need to see price retest the 1.1300 handle together with lower timeframe confirmation (for confirmation techniques, please see the top of this report). Assuming that this trade comes to fruition and price hits its first target, 1.1248, we’d then be looking down to the H4 demand drawn from 1.1168-1.1190 as our final destination (sits on top of daily demand coming in at 1.1143-1.1187) which would essentially complete a nice-looking 1:1 move (see black arrows).
Levels to watch/live orders:
- Buys: Flat (Stop loss: N/A).
- Sells: 1.1300 region [Tentative – confirmation required] (Stop loss: dependent on where one confirms this area).
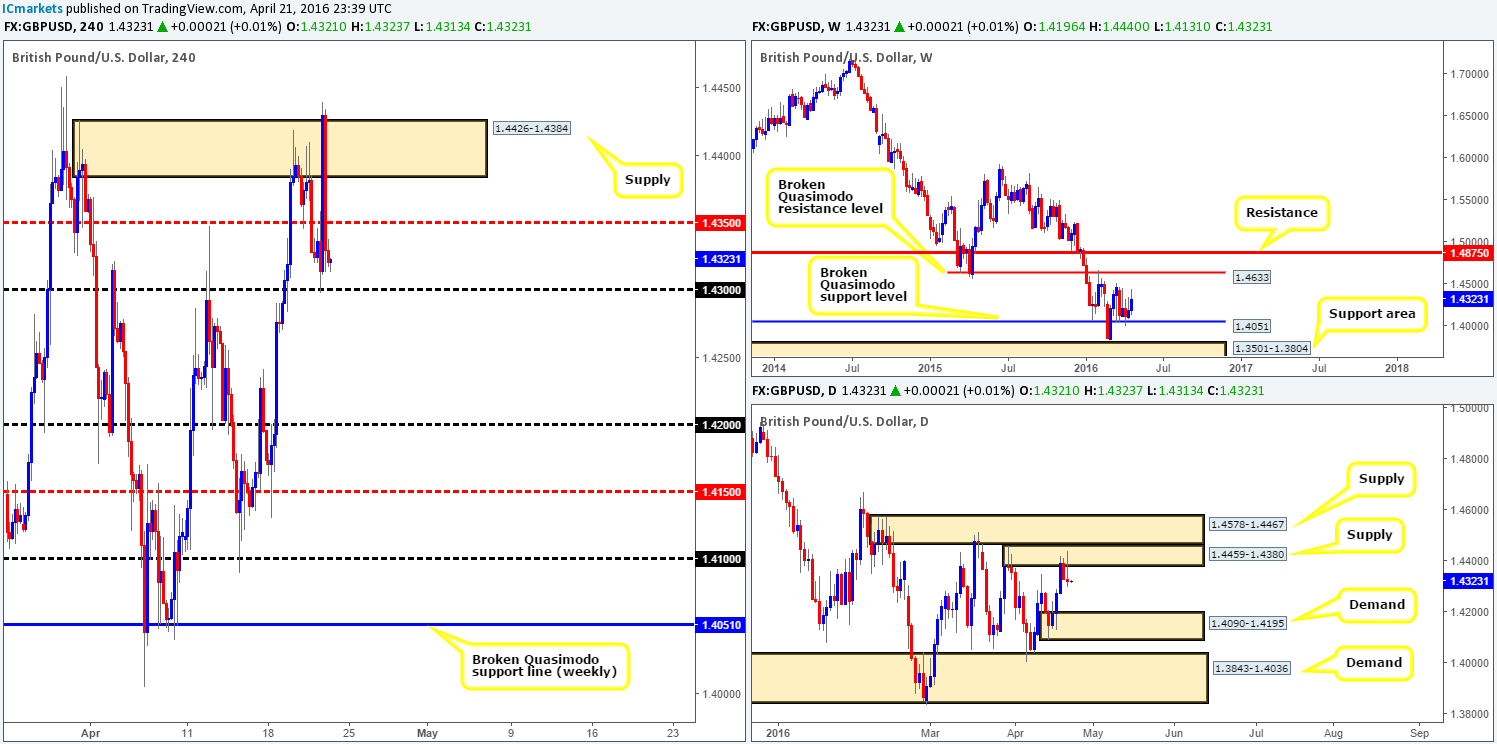
GBP/USD:
In a similar fashion to the EUR, recent trading on Cable saw price whipsaw to highs of 1.4440, which, as you can see, pierced the top-side of H4 supply at 1.4426-1.4384, before crashing back down to lows of 1.4313. Therefore, despite yesterday’s volatility price remains trading nearby the prior day’s close. Consequent to this, our outlook for this pair remains unchanged…
Starting from the top, weekly buyers remain holding ground above the broken Quasimodo support at 1.4051. If we were solely trading this timeframe, current structure suggests that this pair could punch as high as the broken Quasimodo resistance line coming in at 1.4633. On the other side of the field, however, daily action printed a neat-looking selling wick off the back of supply coming in at 1.4459-1.4380, with potential seen for further downside towards demand sitting at 1.4090-1.4195.
Given that the higher timeframes are clearly not trading in unison right now, in order for us to sell we’d need to see price close below the 1.4300 handle. This would not only likely confirm bearish strength from the daily supply mentioned above at 1.4459-1.4380, but also establish a solid footing for a sell on any retest seen at 1.4300 down to 1.4200 (conveniently sits just above the aforementioned daily demand). For us personally, if price were to break/retest 1.1300 and hold firm, this would be sufficient enough to short this market with a stop placed above 1.1300. We would trail this position relatively aggressively, nevertheless, since let’s not forget where price is positioned on the weekly timeframe (see above). In regard to buying this pair on the basis of weekly structure, we see little space for price to run north unfortunately due to closely-formed structure lurking above.
Levels to watch/live orders:
- Buys: Flat (Stop loss: N/A).
- Sells: Watch for price to consume 1.4300 and look to trade any retest seen thereafter (lower timeframe confirmation required).
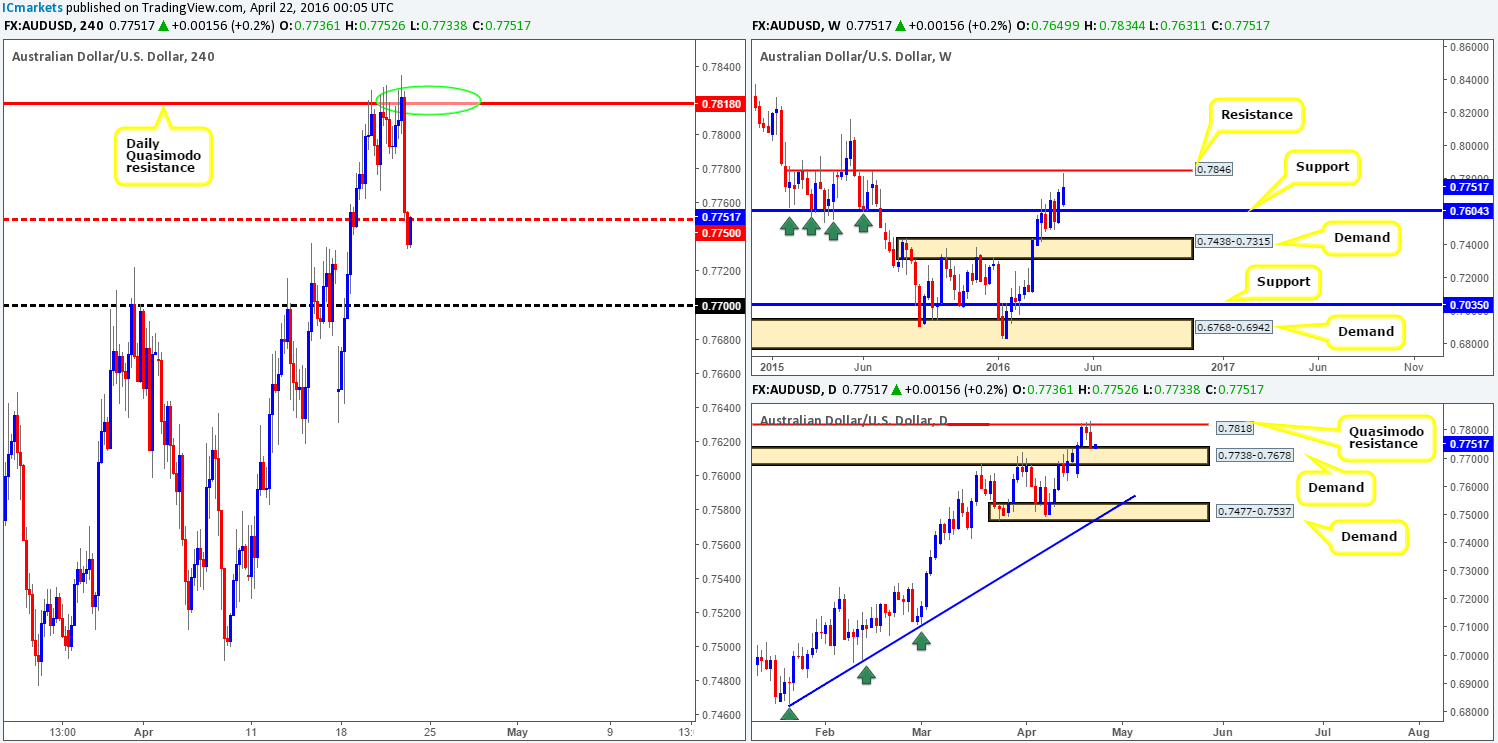
AUD/USD:
In our previous report (see link below) we mentioned to keep an eye on lower timeframe selling opportunities around the daily Quasimodo line at 0.7818 (green circle). As you can see from yesterday’s action, price eventually sold-off from this barrier ending the day closing beyond the H4 mid-level support 0.7750, which was the first take-profit target. Unfortunately, we found little price action to short from 0.7818 – well done to any of our readers who managed to board this train before it departed!
Looking solely at the H4 chart, price is showing room to continue lower towards the 0.7700 handle, and when one includes the fact that weekly price is selling-off from just below resistance coming in at 0.7846, a somewhat bearish tone is presented. However, after eyeballing the daily chart which now sits at the top-side of demand drawn from 0.7738-0.7678, selling pressure could still struggle here. Furthermore, let’s also not forget that the Aussie is in a relatively well-established uptrend at present.
In view of the points made above, the H4 mid-level number 0.7750 is going to be key for us today. Simply put, as we’re unable to gauge any clear higher-timeframe convergence right now, we’re going to watch how the lower timeframe price action behaves at 0.7750 today before deciding whether this pair is tradable. The upside target from this number can be seen back up at 0.7818, while to the downside, we’d be hunting 0.7700.
Levels to watch/live orders:
- Buys: 0.7750 region [Tentative – confirmation required] (Stop loss: dependent on where one confirms this area).
- Sells: 0.7750 region [Tentative – confirmation required] (Stop loss: dependent on where one confirms this area).
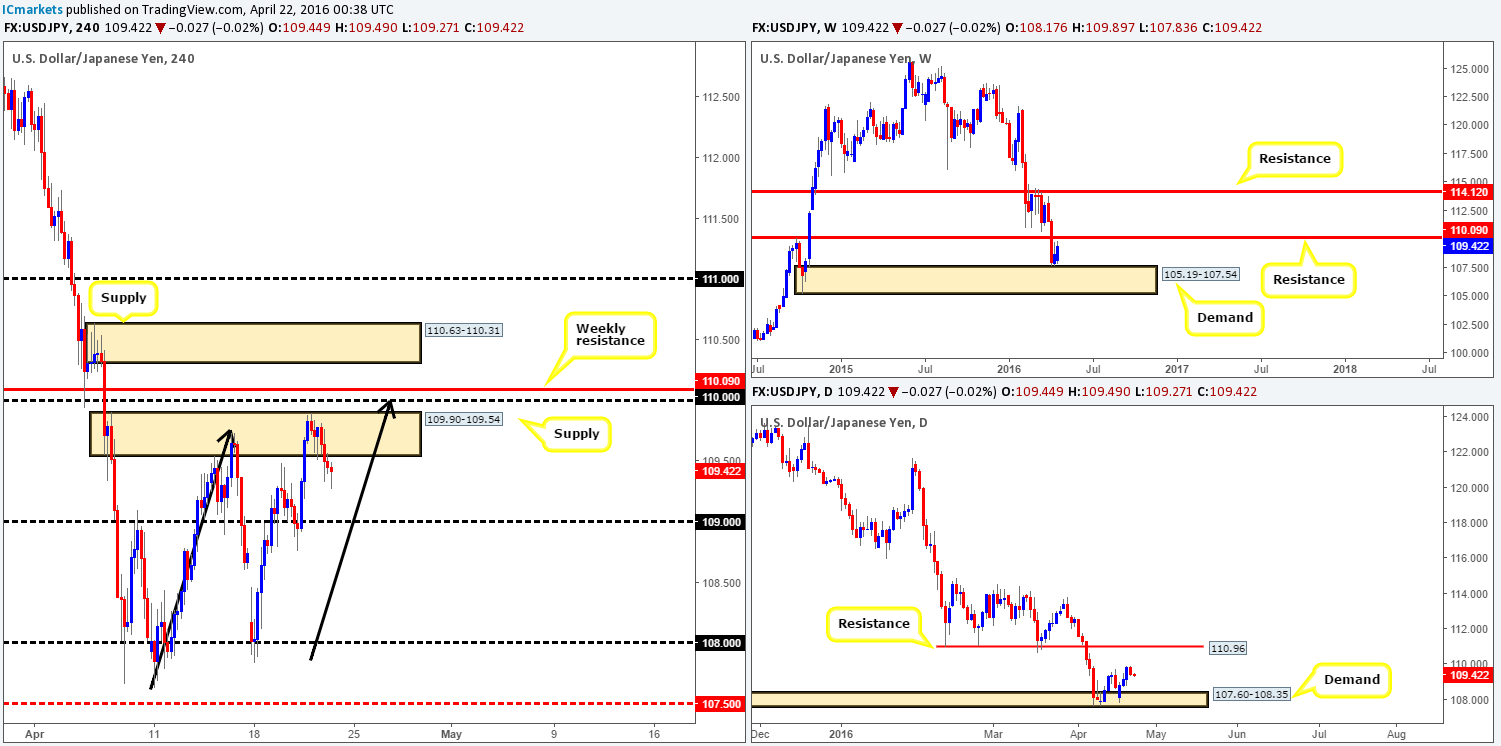
USD/JPY:
Starting from the top this morning, weekly price came within twenty pips of connecting with resistance chalked up at 110.09, before slightly retracing. Sliding down to the daily chart, the USD/JPY is seen trading mid-range between resistance given at 110.96 and demand drawn from 107.60-108.35.
Stepping across to the H4 chart, however, we can see that price sold-off from within the extremes of a H4 supply zone at 109.90-109.54 yesterday, bringing this market to lows of 109.32 on the day. Now, as long as the buyers make an appearance sometime soon, our initial outlook for this pair will remain valid…
With price en-route to completing an AB=CD formation (see black arrows) at the 110.00 handle, and weekly resistance at 110.09 lurking just above, we feel the current H4 supply will cave in to allow price to connect with this higher-timeframe line. Therefore, today’s spotlight will firmly be focused on looking to sell around the 110.09/110.00 region. We would not advise placing pending orders around this area, however, due to the strong possibility that a fakeout up to H4 supply sitting at 110.63-110.31 could potentially take place before sellers step in!
Levels to watch/live orders:
- Buys: Flat (Stop loss: N/A).
- Sells: 110.09/110.00 [Tentative – confirmation required] (Stop loss: dependent on where one confirms this area).
USD/CAD:
A quick peek at the higher-timeframe picture shows weekly support at 1.2833 struggling to hold, which could suggest further downside towards weekly demand at 1.2127-1.2309. Nevertheless, it may be worth waiting for the current weekly candle to close shop before presuming that this support is consumed. Turning our attention to the daily chart, price is currently trading within the confines of a supply at 1.2653-1.2753. Considering the current downtrend this pair is in right now as well as weekly support suffering tremendously, we feel the Loonie will find it difficult to trade above the current daily supply.
With the higher-timeframe picture in mind, let’s dive into the H4 chart! Yesterday’s rally brought price to highs of 1.2749 (considered an extreme point within H4 supply coming in at 1.2717-1.2754), before seeing a slight retracement going into the close. In view of this pair now trading at the 1.2700 boundary, where does one go from here? Well, on account of what we’ve noted above regarding the higher timeframes, we will be looking to see if price can consume 1.2700 and possibly retest it as resistance. Should this come into vision, we’ll look to short (alongside lower timeframe confirmation – please see the top of this report for confirmation techniques) down to mid-level support 1.2650, followed closely by 1.2600.
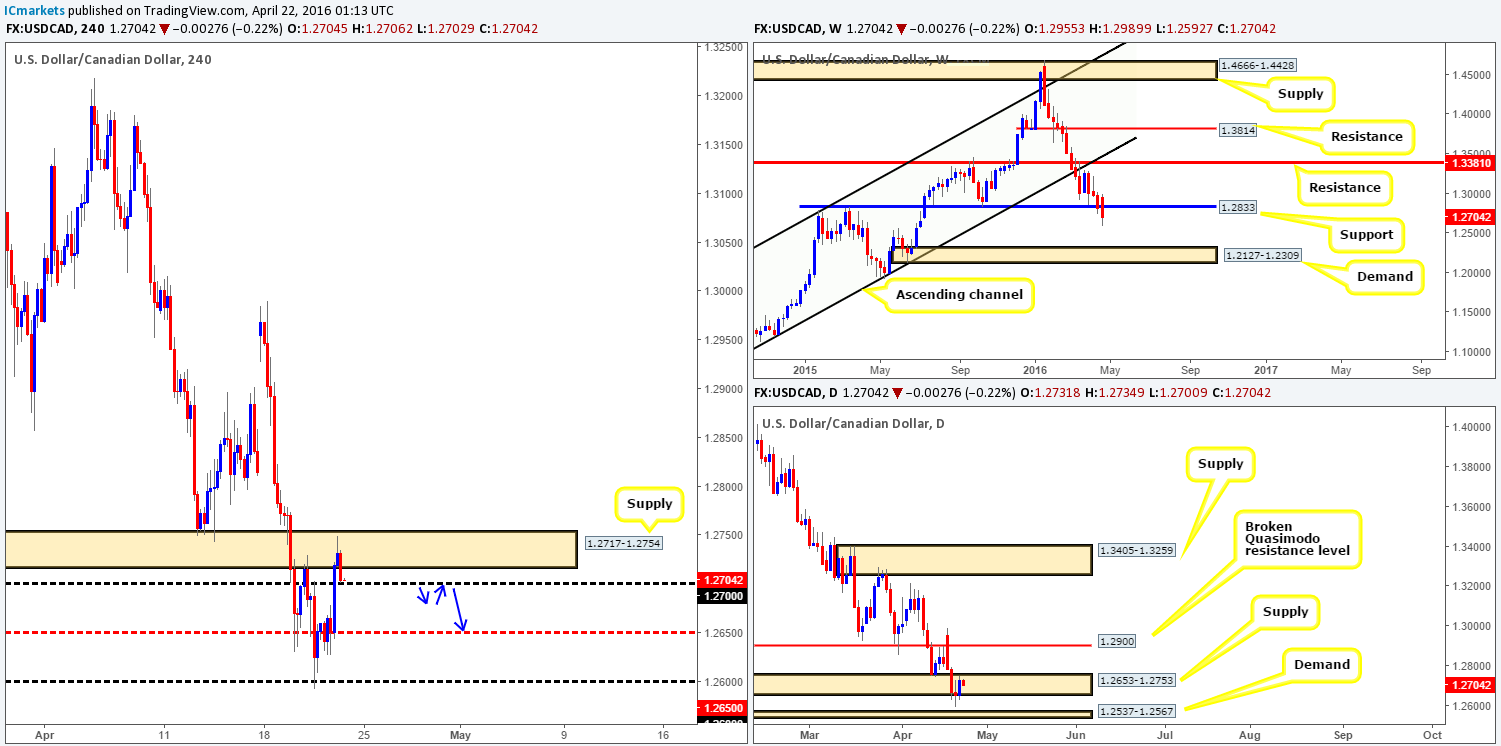
Levels to watch/live orders:
- Buys: Flat (Stop loss: N/A).
- Sells: Watch for price to consume 1.2700 and look to trade any retest seen thereafter (lower timeframe confirmation required).
USD/CHF:
Traders who have been following our recent reports on the Swissy may recall us highlighting a possible selling opportunity around the 0.9750 region. As of this point, our team is currently short from 0.97515 with a stop-loss order placed above at 0.9790.
For those new to this report, we built a case for entry based on the following points:
- Weekly price trading at a small weekly supply marked with a pink circle at 0.9787-0.9695.
- Daily action testing supply at 0.9787-0.9755.
- H4 mid-level resistance seen at 0.9750.
- A near-perfect bearish H4 Harmonic Gartley pattern which converges nicely with the above said daily supply (green circle).
Ultimately, we’re looking to take partial profits between the H4 support coming in at 0.9722 and round-number level just below at 0.9700. Following this, 0.9650 will be the next hurdle on the hit list considering how well it has held as support and resistance over the past few weeks.
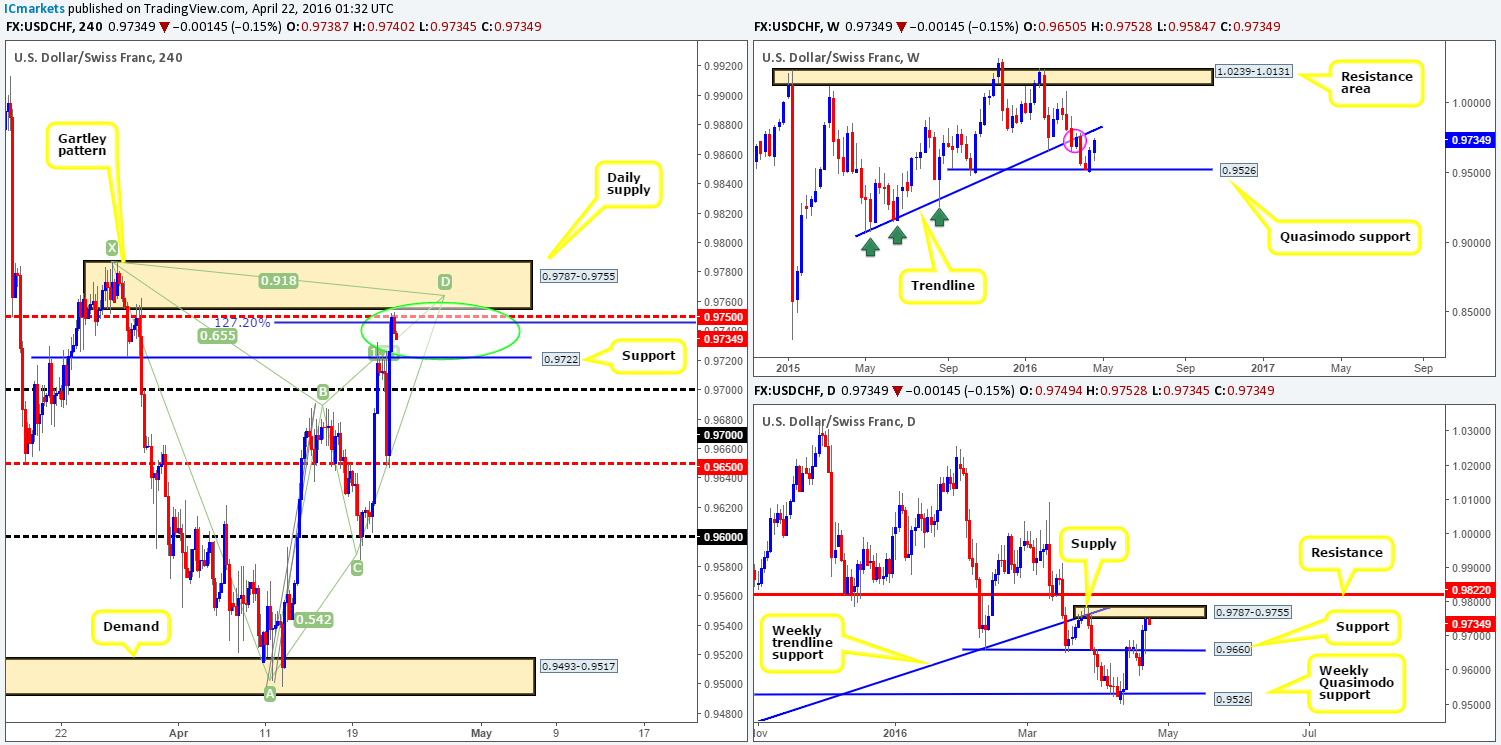
Levels to watch/live orders:
- Buys: Flat (Stop loss: N/A).
- Sells: 0.97515 [LIVE] (Stop loss: 0.9790).
DOW 30:
U.S stocks suffered in recent trading as prices sold-off following a small break through daily supply at 18153-18073. This, as you can see, ended with the DOW whipsawing through a small H4 demand at 17963-17987, which for the time being is seen to be holding firm.
From a higher-timeframe perspective, the weekly chart shows price now trading back within the confines of a weekly resistance area drawn from 17977-17811. Meanwhile, down on the daily timeframe, there’s room seen for this market to continue driving south until it reaches support penciled in at 17876. Beyond here, however, we’d be looking around demand given at 17396-17554. Owing to both the weekly and daily timeframes implying a more bearish tone to this market at the moment, our team has no interest in buying from the current H4 demand zone. On the flip side, nonetheless, selling this market below H4 demand is a relatively tricky one considering a broken Quasimodo support line at 17920 sits directly below!
On the whole, we’re not too impressed with the structure seen here. As such, opting to stand on the sidelines today may be the best path to take.
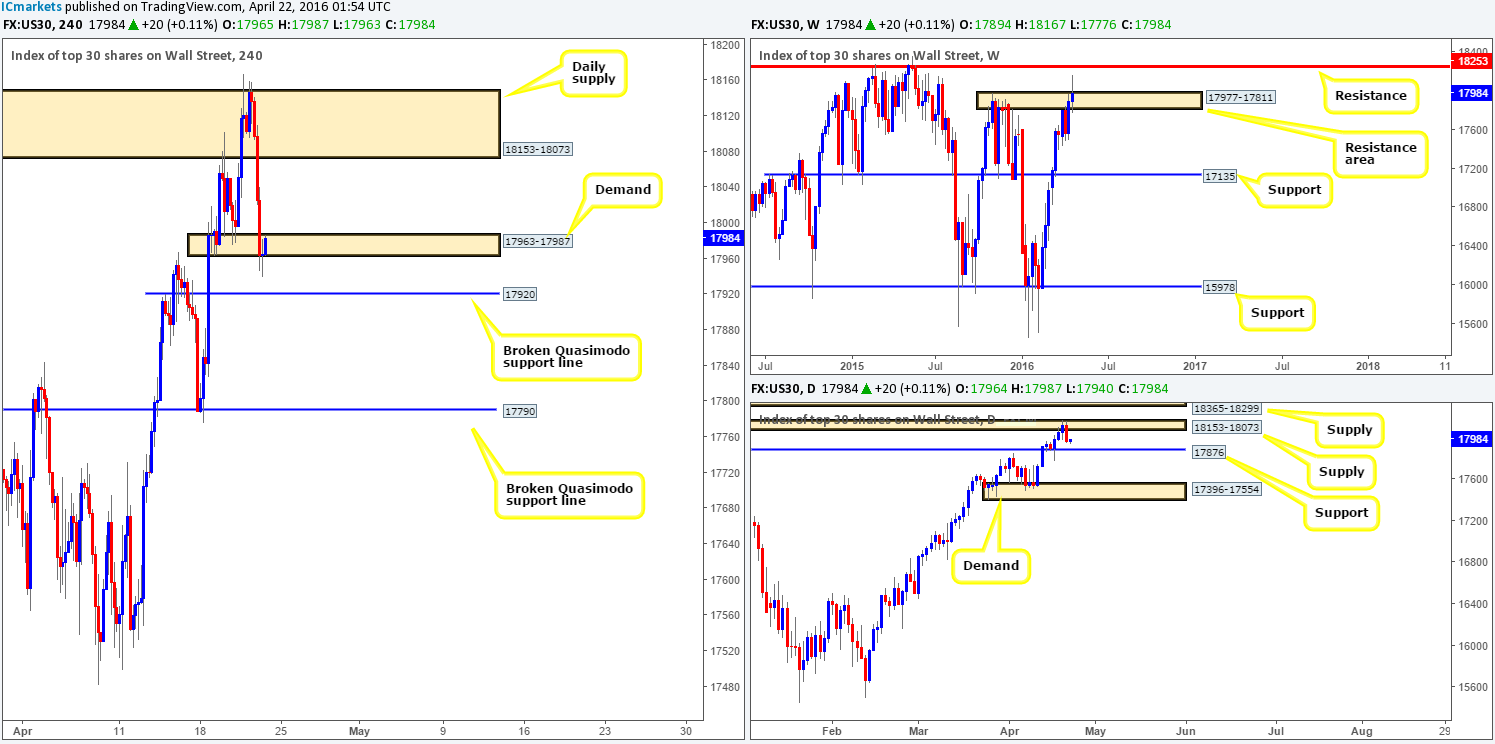
Levels to watch/live orders:
- Buys: Flat (Stop loss: N/A).
- Sells: Flat (Stop loss: N/A).
XAU/USD:
Following a bounce seen from the top-side of the H4 support area at 1240.5-1243.1, yesterday’s action aggressively pushed north to test highs formed back on March 17 at 1270.8, before just as aggressively driving to lows of 1246.8. Despite this surge in volatility, price only clocked up a small $4 gain by the day’s end.
As we already mentioned in previous reports, the weekly chart if offering very little in terms of direction at the moment. To the upside, price is seen capped by supply drawn from 1307.4-1280.0, while to the downside demand at 1205.6-1181.2 continues to hold price higher. As such, the best we can do here is to keep an eyeball on both of these zones for possible future use. On the other side of the field, nevertheless, daily activity is seen trading from within supply from 1270.8-1257.5, which, as you can probably see, shows room to continue lower until at least daily demand penciled in at 1223.7-1233.3.
In light of what we’re seeing on the daily chart, it seems, at least for now, that selling this market may be the more logical path to take. That being the case, here is what we have in mind: in the event that we see price drive below the current H4 support area, the river south should be ‘ripple free’ down to H4 demand at 1227.6-1232.2 as per the green arrows (located within the daily demand mentioned above at 1223.7-1233.3). For us to be given the green light to short following a close lower, nonetheless, we’d need to see price retest this area as supply together with a lower timeframe confirming signal (for confirmation techniques, please check out the bullet points made at the top of this report).
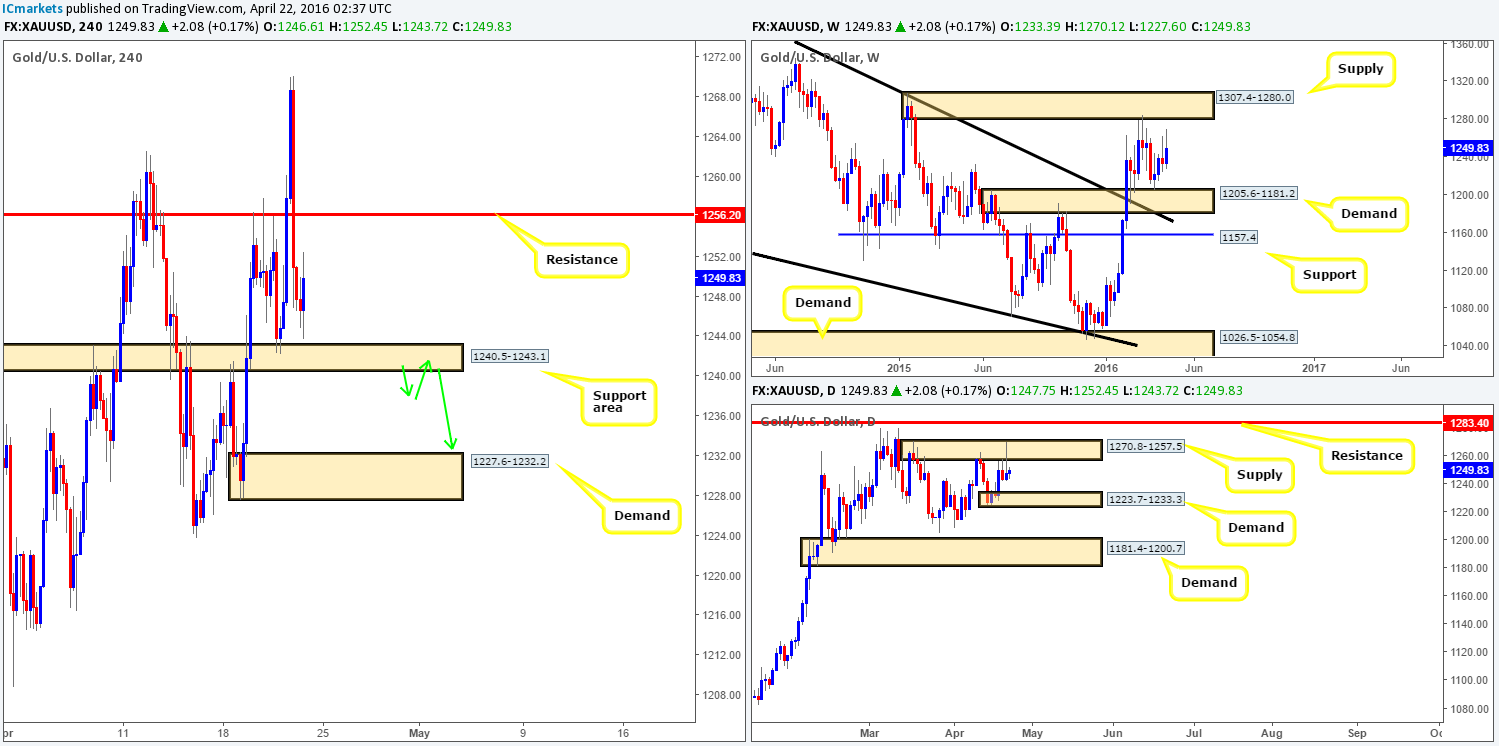
Levels to watch/live orders:
- Buys: Flat (Stop loss: N/A).
- Sells: Watch for price to consume 1240.5-1243.1 and look to trade any retest seen thereafter (lower timeframe confirmation required).


