
EUR/USD:
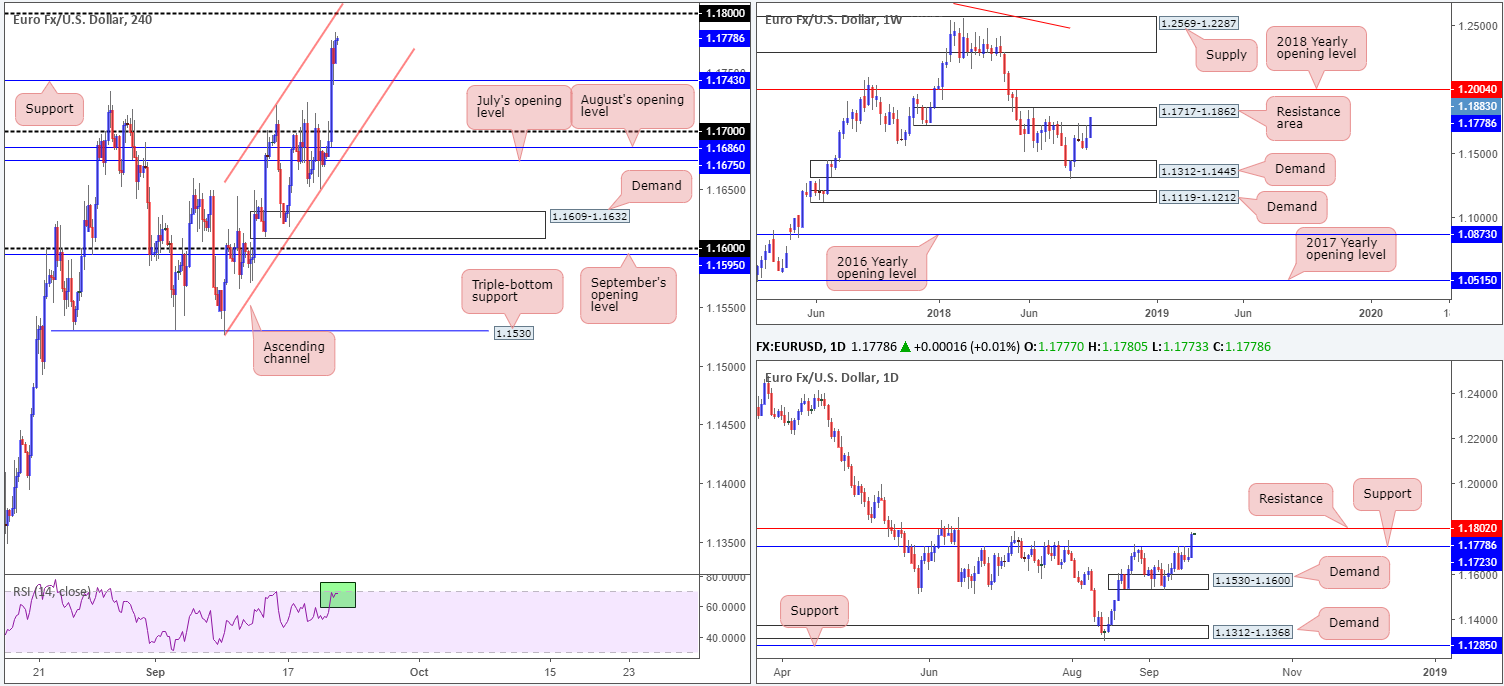
Broad-based US dollar weakness provided fresh impetus to the shared currency on Thursday, up nearly 1.00% on the day. Although weekly jobless claims and Philly Fed Manufacturing data out of the US came in better than expected, the index failed to print a meaningful recovery.
Advancing to highs not seen since July 9, the H4 candles crossed above 1.17 as well as a resistance level at 1.1743 yesterday, and is currently seen poised to challenge the 1.18 handle. Note 1.1743 was also retested as support prior to fresh highs forming. 1.18, as you can see on the daily timeframe, converges beautifully with reasonably strong resistance drawn from 1.1802. This barrier only become visible after strong resistance at 1.1723 was engulfed in strong fashion yesterday. A little higher up on the curve, we can also see a weekly resistance area in play at 1.1717-1.1862. Capping upside in the months of May, June and July of this year, this area certainly has potential!
Areas of consideration:
Seeing weekly price trading within a notable resistance area (1.1717-1.1862) at the moment, along with daily price approaching resistance at 1.1802, the 1.18 handle on the H4 timeframe has ‘fade me’ written all over it. Traders may have also noticed 1.18 fuses with a channel resistance (extended from the high 1.1721), and the H4 RSI indicator is seen hovering just south of its overbought value.
As psychological numbers (1.18) are prone to fakeouts, waiting and seeing if H4 price can chalk up a bearish candlestick formation prior to pulling the trigger is worth considering. Aside from showing seller intent, the candlestick pattern will deliver a location to enter at and a position to place stop-loss orders. In regard to the first take-profit zone, the H4 support at 1.1743 is a valid barrier to have eyes on.
Today’s data points: French, German and Eurozone manufacturing PMIs.
GBP/USD:
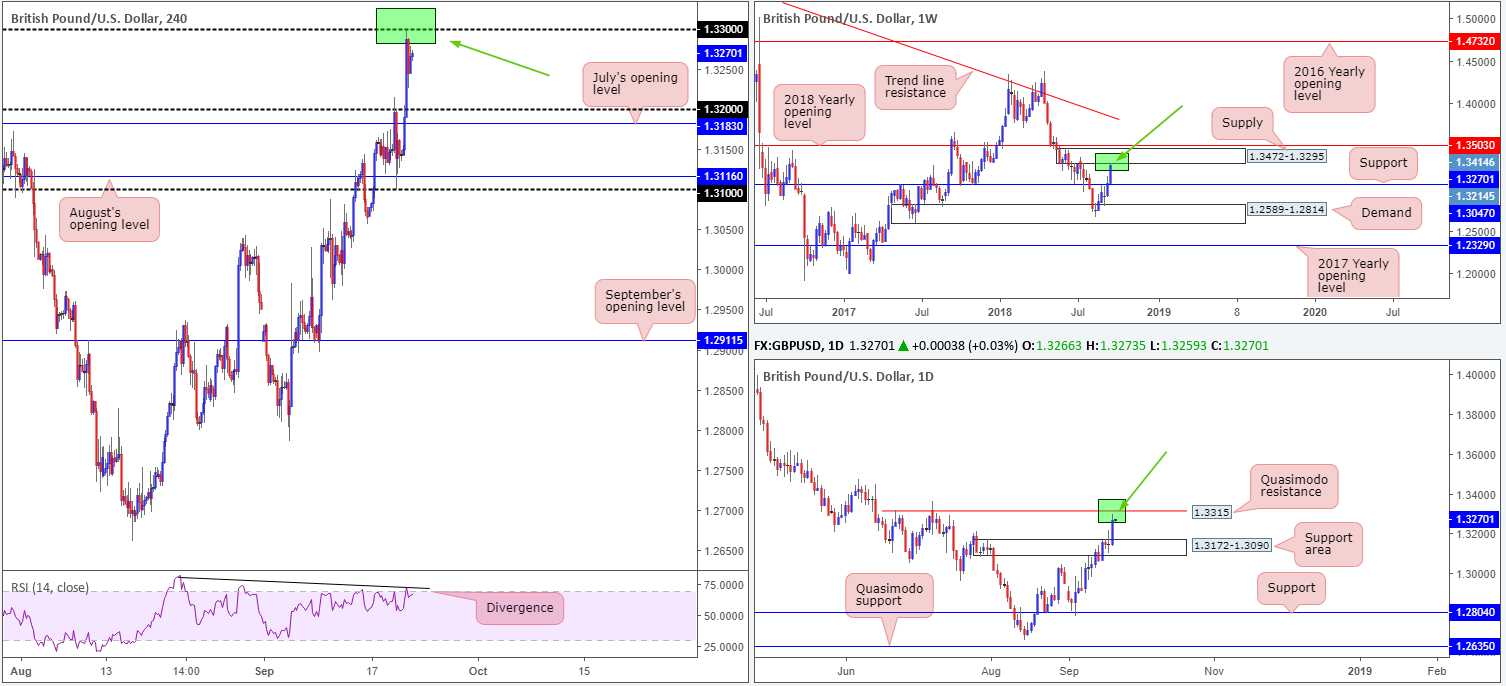
Kicking off from the weekly timeframe this morning, the market has witnessed a strong bout of GBP buying this week, firmly clearing resistance at 1.3047 and recently crossing swords with a supply zone drawn from 1.3472-1.3295. In terms of where we stand on the daily timeframe, however, the pair is seen fast approaching a Quasimodo resistance level coming in at 1.3315, following the removal of supply at 1.3172-1.3090 (now acting support area).
Sterling found support after UK retail sales came in hotter than expected on Thursday, eventually breaking the 1.32 handle. The pound rose to within striking distance of the 1.33 handle on the H4 timeframe, before stabilizing around its 1.3250 point. Yesterday’s advance was cooled down by Brexit headlines, as neither the UK or the EU appear willing to give up on their stances on how to deal with the Irish border issue.
Areas of consideration:
Converging nicely with 1.33 we have the underside of weekly supply at 1.3295 and also a daily Quasimodo resistance plotted at 1.3315. Further to this, the H4 RSI indicator is seen displaying divergence out of its overbought value.
Therefore, between 1.3315/1.3295 is an area traders should keep tabs on this morning for possible shorting opportunities. Ideally, it’d be great to see H4 action print a bearish candlestick formation out of this zone, thus providing seller intent. From this point, the 1.32 handle appears to be a reasonable (initial) downside target.
Today’s data points: UK public sector net borrowing.
AUD/USD:
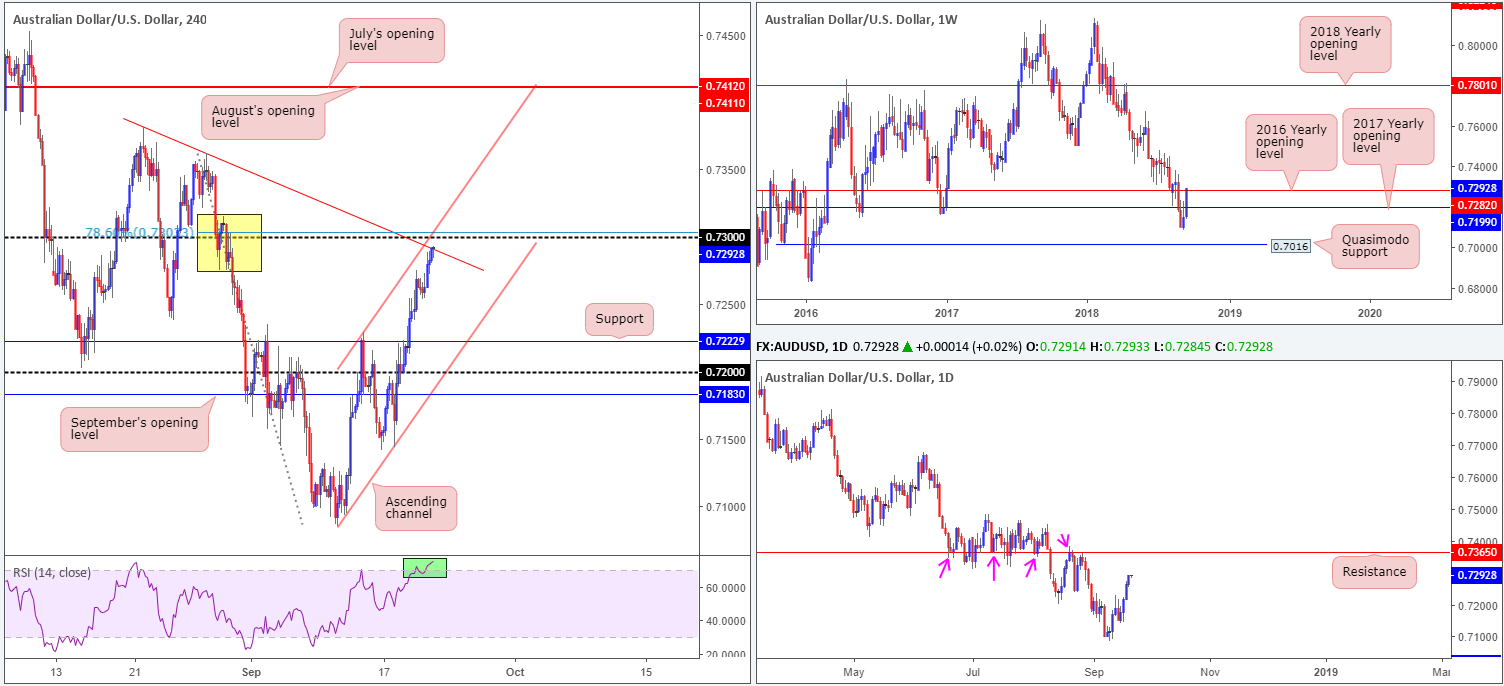
Traders were seen dumping the US dollar on Thursday in favour of riskier assets, as market sentiment is recovering from trade war concerns. Our technical studies, nevertheless, see a possible pause in buying on the horizon. H4 movement recently shook hands with a trend line resistance (extended from the high 0.7381) that’s positioned just south of the 0.73 handle, a 78.6% Fib resistance value at 0.7303, a channel resistance (taken from the high 0.7229) and also a converging overbought RSI reading. What our studies also show, though, is potentially weak supply to the left of current price (marked in yellow), hence why we may only experience a pause at 0.73 as opposed to a correction.
Against the backdrop of intraday flow, however, weekly price is seen engaging with its 2016 yearly opening level at 0.7282. Although price is trading marginally above this number at the moment, it’d be unwise to discount this level just yet! Daily action, on the other hand, shows room to press as far north as resistance coming in at 0.7365.
Areas of consideration:
Shorting from the 0.73 handle is likely on the radar for many traders today, given it has connections to nearby weekly resistance and displays a reasonable amount of H4 confluence. The only grumble, of course, is seeing daily price eyeing higher levels beyond 0.73. For that reason, it may be prudent to wait for additional candlestick confirmation before pulling the trigger. Ultimately, should the sellers come in from 0.73 in force, traders’ crosshairs will likely be fixed on H4 channel support (etched from the low 0.7085) as a take-profit target.
Today’s data points: Limited.
USD/JPY:
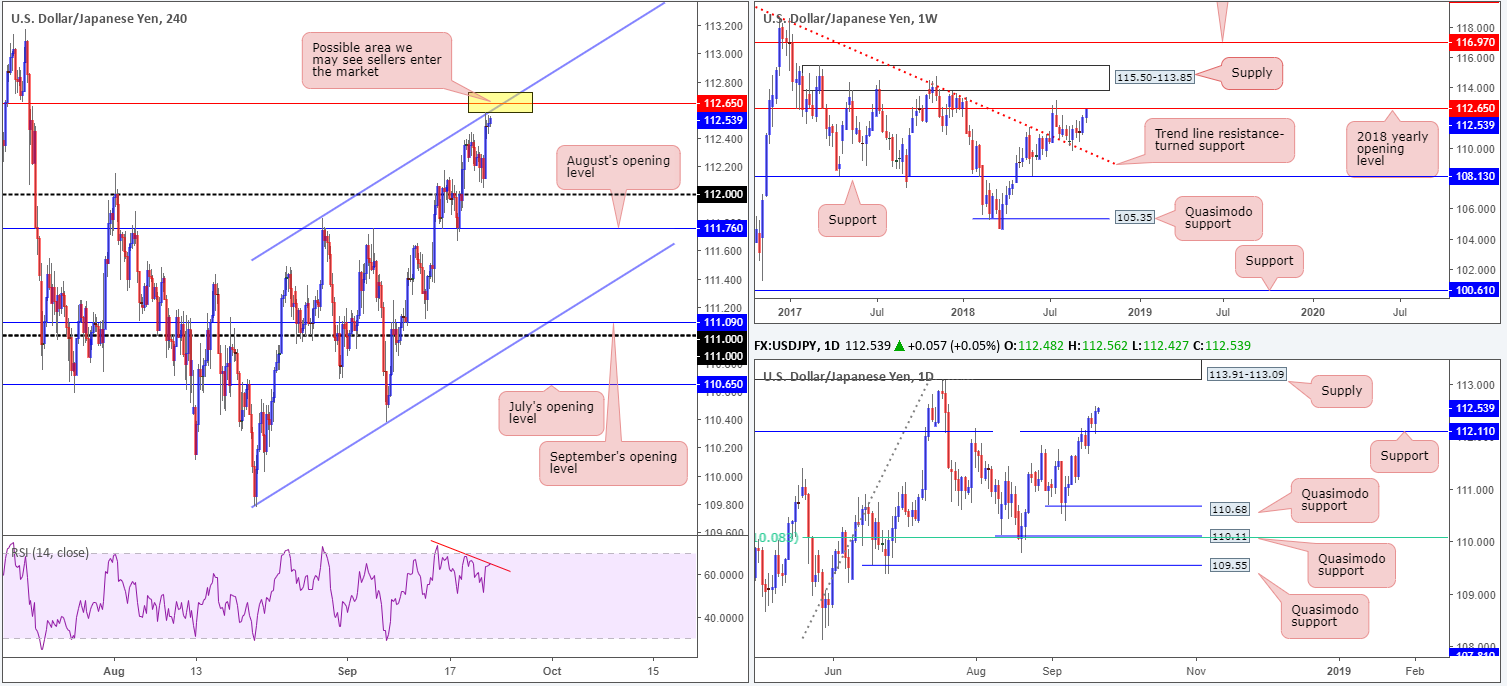
Although the US dollar index tumbled lower on Thursday, the USD/JPY gained traction as the safe-haven yen struggled to find demand in the risk-positive environment. Leaving the 112 handle unchallenged, the pair advanced higher and touched gloves with a H4 channel resistance (etched from the high 111.82). This rally could have something to do with the fact we also retested daily support at 112.11 yesterday!
Despite this, a considerable obstacle lies in the way of further gains: the 2018 yearly opening level at 112.65 seen plotted on the weekly timeframe.
Areas of consideration:
Of particular interest in this market is the weekly level mentioned above at 112.65. Not only is it likely a watched level by and of itself, traders should also note it intersects with the current H4 channel resistance (the yellow range), which happens to be accompanied by RSI divergence. This is likely to draw in sellers today and possibly pull the unit back in the direction of yesterday’s low point 112.04, followed closely by the 112 handle.
As daily price shows room to push as far north as supply coming in at 113.91-113.09, though, waiting for additional candlestick confirmation to form around 112.65 before pressing the sell button is an option.
Today’s data points: Limited.
USD/CAD:
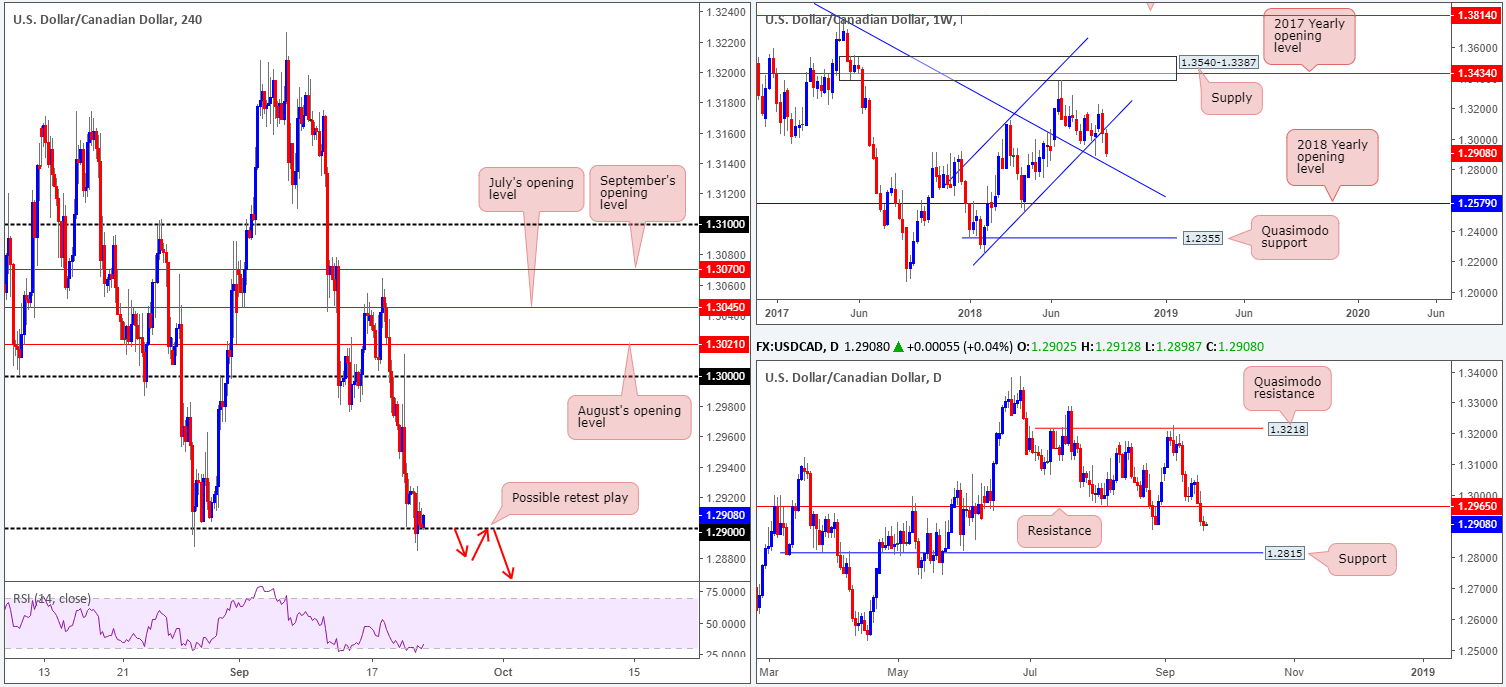
Coming from the top this morning, weekly price is firmly seen pressing south outside of its ascending channel formation (1.2247). The next downside target on this scale can be seen reasonably close by at a trend line resistance-turned support (extended from the high 1.4689).
Turning the focus on the daily timeframe, we can see the unit recently crossed beneath support at 1.2965 (now acting resistance) and is currently testing the August 28 lows at 1.2887. A break beyond this neighborhood has support at 1.2815 to target.
Across on the H4 timeframe the 1.29 handle remains in play, in spite of a number of attempts to push south. With both weekly and daily structure indicating a possible continuation to the downside, 1.29 may give way today and see the candles connect with 1.2836: a Quasimodo support level (not seen on the screen).
Areas of consideration:
As stop-loss orders beneath 1.29 were likely tripped during yesterday’s movement, along with higher-timeframe movement suggesting lower prices, a break/retest play could be on the menu today. A H4 close beneath 1.29 that’s followed up with a retest in the shape of a H4 bearish candlestick formation would, according to our studies, be enough to draw in sellers, targeting 1.2836.
Today’s data points: Canadian inflation figures and core retail sales.
USD/CHF:
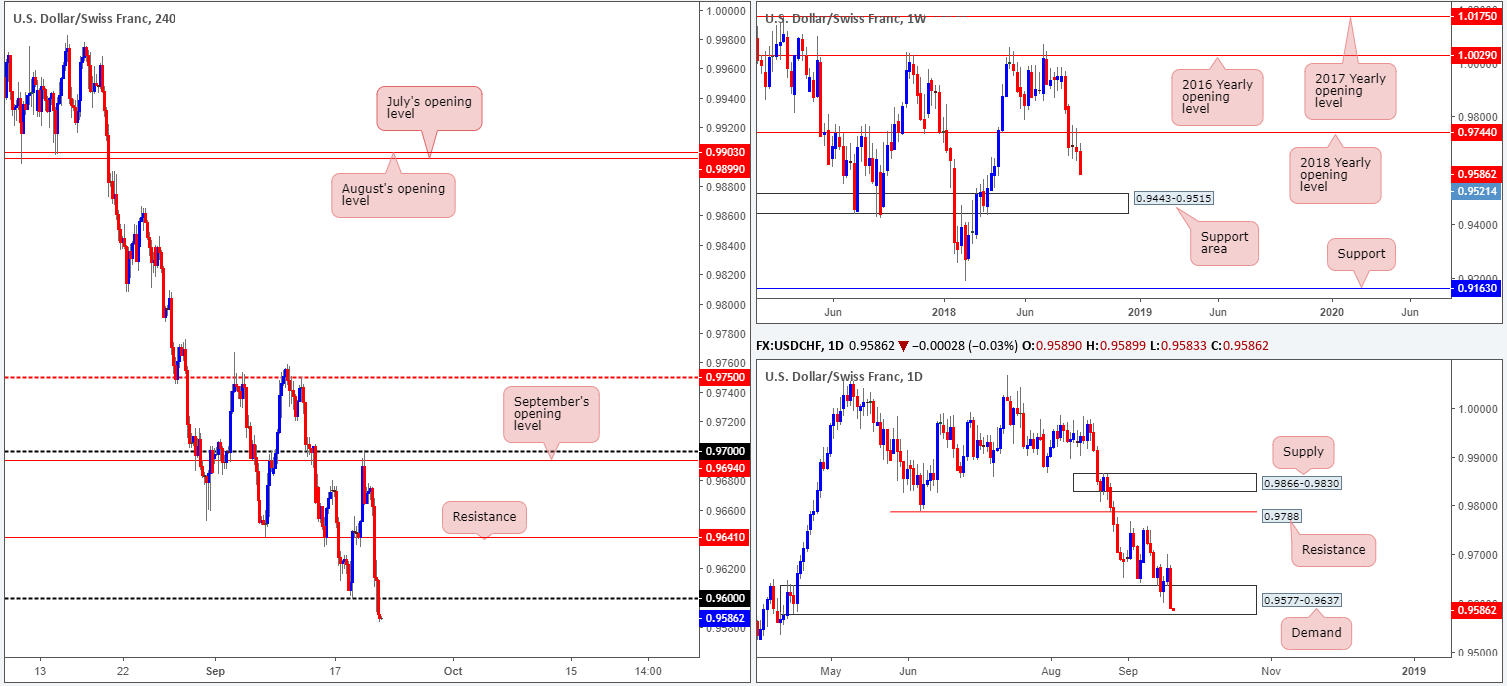
The USD/CHF has come under reasonably heavy selling pressure this week. What’s more, further selling could still be on the cards! Weekly price, after firmly retesting the underside of its 2018 yearly opening level at 0.9744, shows room to stretch as far south as the 0.9443-0.9515 area. A closer look at price action on the daily timeframe, however, still shows the unit trading within the walls of a demand zone coming in at 0.9577-0.9637, albeit by a hair at current price. A break beyond this base, as the weekly timeframe suggests, has 0.9441 to target on the daily scale, the only fresh line of obvious support.
Lower on the curve, the H4 candles recently broke through the 0.96 threshold. From this scale, our studies show limited demand ahead until we reach support at 0.9534 (not seen on the screen).
Areas of consideration:
Seeing as weekly price is in favour of further downside, and daily price is seen registering little in terms of upside presence from demand, shorts beneath 0.96 on the H4 scale could be an option today, targeting 0.9534. Aggressive traders will likely enter at market in the hope price turns at 0.96 with stops positioned a few pips above the number, whereas conservative traders may opt to wait and enter on candlestick confirmation.
Today’s data points: Limited.
Dow Jones Industrial Average:
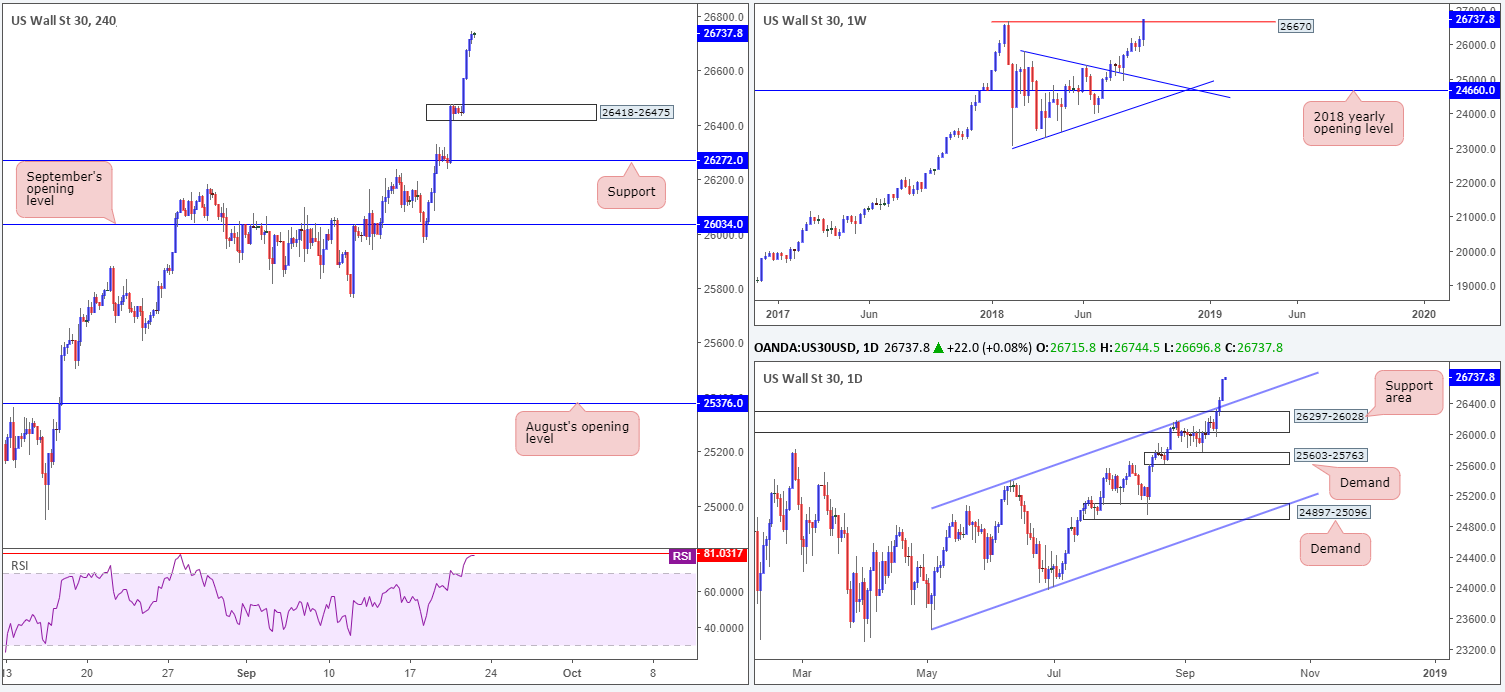
US equities struck fresh record highs of 26716 on Thursday amid easing geopolitical tensions.
On the weekly timeframe, price could potentially find support above the January 29 high of 26670, while on the daily timeframe, there’s a chance we may witness a pullback to retest the channel resistance-turned support (etched from the high 25385). On the H4 timeframe, however, demand at 26418-26475 is the next obvious downside base, seen positioned above the aforementioned daily channel resistance-turned support. Also worth noting from a technical standpoint is the H4 RSI indicator currently displaying a strong overbought reading along with the value seen turning just ahead of RSI resistance at 81.03.
Areas of consideration:
Given the market is seen trading at record highs, buying this market at current price is chancy. A pullback is likely to take shape prior to higher highs forming. Therefore, traders are urged to watch the current H4 demand zone closely today/early next week for possible buying opportunities. A failure of this level, and we will then be looking at a test of the daily channel resistance-turned support mentioned above for potential long opportunities.
Today’s data points: Limited.
XAU/USD (Gold):
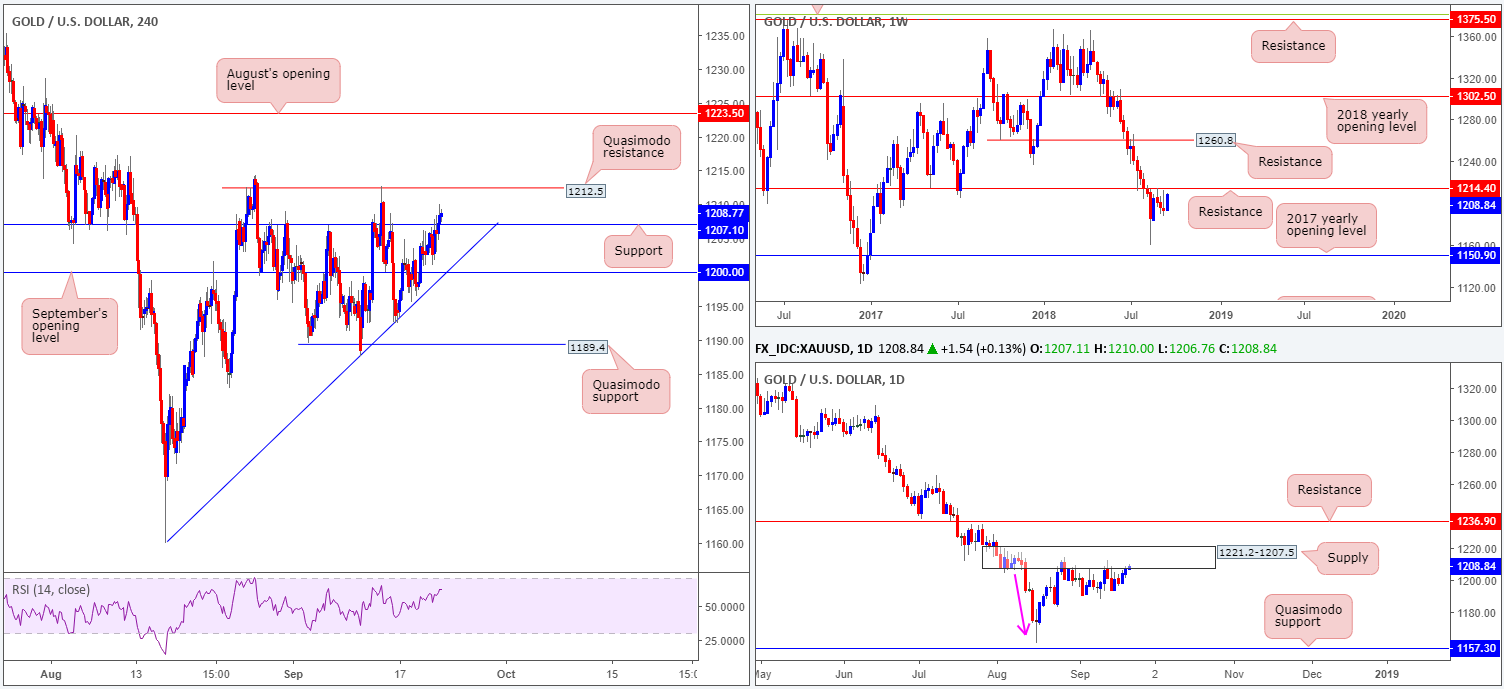
Using a top-down approach this morning, the price of gold is seen hovering just south of a weekly resistance level plotted at 1214.4. This level boasts strong history and, therefore, commands respect. On the daily timeframe, price is seen checking in with a nice-looking supply zone at 1221.2-1207.5. Aside from this zone displaying attractive downside momentum from its base (see pink arrow), it could also be considered the ‘decision point’ to print 2018 yearly lows of 1160.3. Couple this with the fact we remain beneath resistance, we still potentially have ourselves some strong sellers in the mix.
Intraday flows show H4 resistance at 1207.1 was taken out in recent hours. This could set the stage for a continuation move north today towards a H4 Quasimodo resistance level at 1212.5. Note this level has already held price lower last week.
Areas of consideration:
The higher-timeframe resistances, along with nearby H4 Quasimodo resistance mentioned above, cautions against an exuberantly bullish approach today. Unfortunately. There’s not much room to short from the current H4 Quasimodo resistance level at 1212.5, when H4 support at 1207.1 lurks nearby.
At current price we do not see much to hang our hat on in terms of possible trading opportunities. Therefore, opting to remain on the sidelines may be the better path to take right now.
The use of the site is agreement that the site is for informational and educational purposes only and does not constitute advice in any form in the furtherance of any trade or trading decisions.
The accuracy, completeness and timeliness of the information contained on this site cannot be guaranteed. IC Markets does not warranty, guarantee or make any representations, or assume any liability with regard to financial results based on the use of the information in the site.
News, views, opinions, recommendations and other information obtained from sources outside of www.icmarkets.com.au, used in this site are believed to be reliable, but we cannot guarantee their accuracy or completeness. All such information is subject to change at any time without notice. IC Markets assumes no responsibility for the content of any linked site. The fact that such links may exist does not indicate approval or endorsement of any material contained on any linked site.
IC Markets is not liable for any harm caused by the transmission, through accessing the services or information on this site, of a computer virus, or other computer code or programming device that might be used to access, delete, damage, disable, disrupt or otherwise impede in any manner, the operation of the site or of any user’s software, hardware, data or property.


