
EUR/USD:
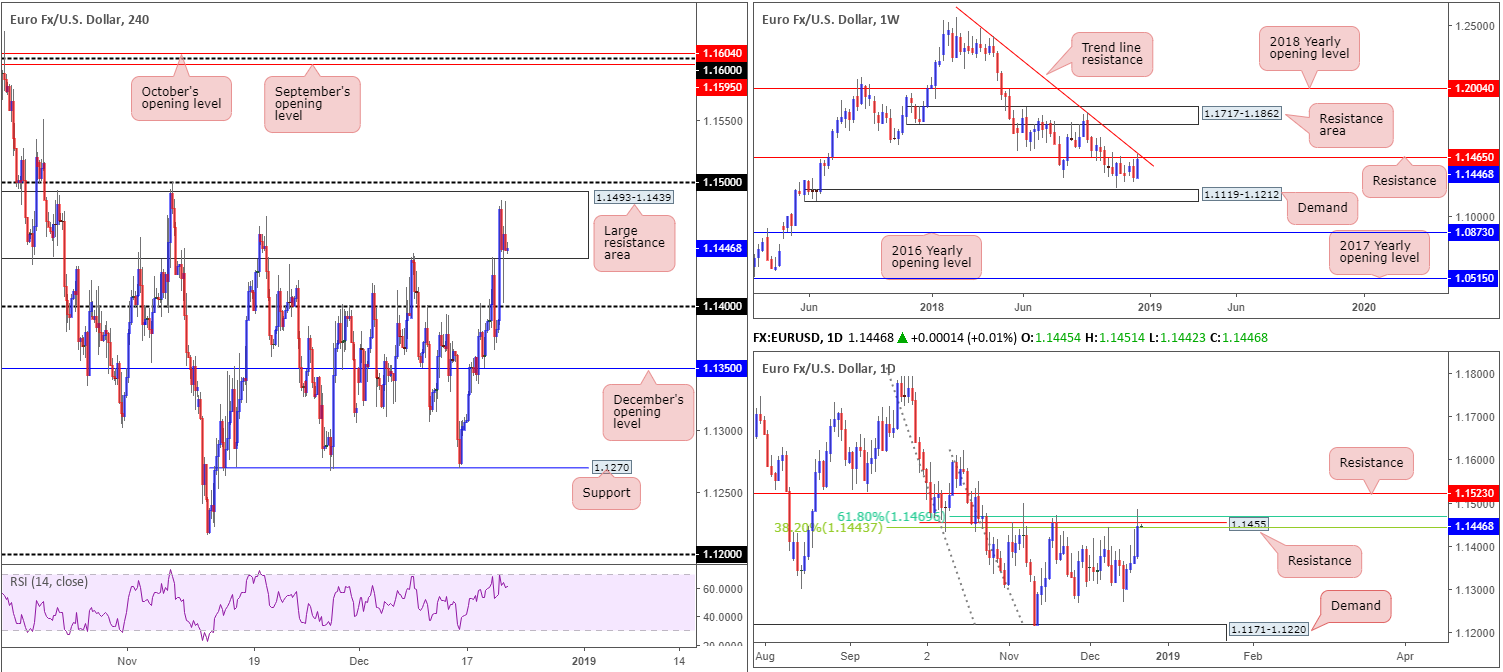
EUR/USD bulls delivered further upside Thursday, consequently registering its fourth consecutive daily gain this week. Up 0.61% on the day, recent buying, backed by an overall weaker USD across the board (despite the 10-year US Treasury yield printing a modest recovery), lifted weekly price into resistance territory: a resistance level priced in at 1.1465 that merges with a trend line resistance (extended from the high 1.2413). A rejection off here could lead to a move south towards demand at 1.1119-1.1212, whereas continued buying pulls a resistance area seen at 1.1717-1.1862 into the spotlight.
A closer reading reveals daily price shaking hands with resistance circulating around the 1.1455 region, which happens to closely converge with two Fibonacci resistances: a 61.8% and a 38.2% at 1.1469 and 1.1443, respectively. A violation of this area, however, has nearby resistance plotted at 1.1523 to target.
Moving down the curve, we can see H4 action entered the walls of a rather large resistance area seen at 1.1493-1.1439, after reclaiming 1.14+ status Thursday. In view of this area being overshadowed by the 1.15 handle directly above, and taking into account the resistances marked on the bigger picture, further buying is likely going to be a challenge.
Areas of consideration:
Although the unit has performed this week, the research team fails to see any evidence, from a technical perspective that is, the EUR/USD wants higher levels. With that being the case, searching for shorting opportunities within the confines of the current H4 resistance area is an option today, targeting 1.14 as the initial take-profit zone.
Conservative traders may opt to enter based on additional bearish candlestick confirmation. That way, not only do we have an indication sellers are active, the candlestick pattern also provides entry/stop parameters.
Today’s data points: US Core Durable Goods Orders m/m; US Final GDP q/q; US Durable Goods Orders m/m; US Core PCE Price Index m/m; US Personal Spending m/m; US Revised UoM Consumer Sentiment.
GBP/USD:
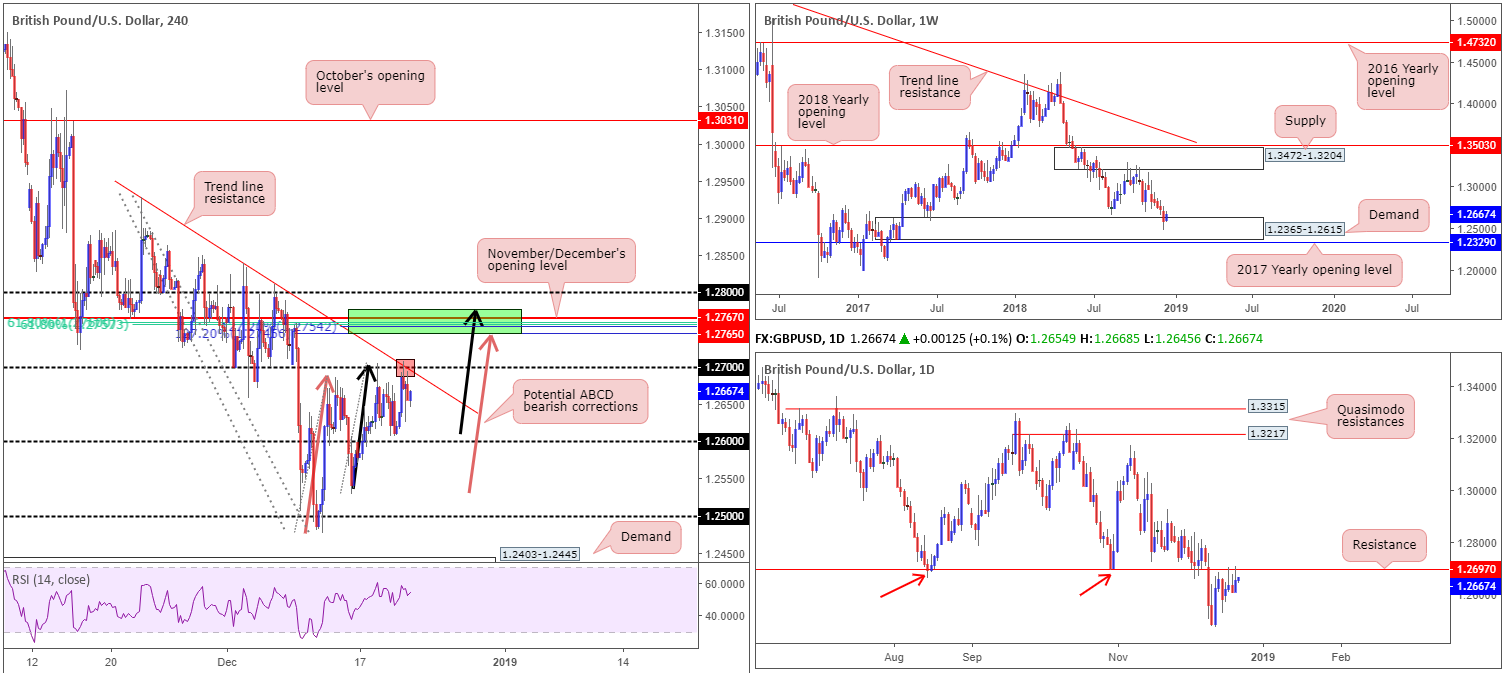
The Bank of England kept rates unchanged Thursday, as expected. Guidance was also untouched as the bank reiterated ongoing tightening of monetary policy at a gradual pace. UK retail sales rose 1.4% in November, reporting a higher-than-expected reading. This – coupled with a waning US dollar – allowed the GBP/USD to record gains of 0.35% on the day.
For those who read Thursday’s briefing you may recall the piece highlighting two possible H4 sell zones:
- A bounce is likely to be observed from 1.27 (red), given the converging H4 trend line resistance (taken from the high 1.2927). Also bear in mind daily resistance is seen close by at 1.2697.
- A failure of 1.27 will likely bring in 1.2777/1.2745 (green).This zone holds two potential H4 AB=CD (orange and black arrows) 127.2% bearish patterns and also happens to encompass November and December’s opening levels at 1.2767/1.2765. In addition to this, we can also see a 61.8% H4 Fibonacci resistance value at 1.2761.
The only grumble is the fact weekly price is seen testing the top edge of demand coming in at 1.2365-1.2615.
Well done to any of our readers who managed to secure some profits from 1.27 yesterday, as price clocked a low of 1.2625.
Areas of consideration:
With respect to higher-timeframe structure, conflicting signals clearly remain: we have weekly price trading from demand, though at the same time we also have daily price languishing just south of resistance, signaling further selling could be in the offing.
In terms of the H4 structure, both sell zones highlighted above remain a possibility today, in our humble view:
- 27 (red), given the converging H4 trend line resistance (taken from the high 1.2927). Also bear in mind daily resistance is seen close by at 1.2697.
- A failure of 1.27 will likely bring in 1.2777/1.2745 (green). As highlighted above, this zone holds ample H4 confluence to support sellers.
In regard to buying, the research team unfortunately sees very little to hang their hat on at the moment. This is largely due to the lackluster performance being seen out of the current weekly demand area.
Today’s data points: UK Current Account; UK Final GDP q/q; UK Public Sector Net Borrowing; US Core Durable Goods Orders m/m; US Final GDP q/q; US Durable Goods Orders m/m; US Core PCE Price Index m/m; US Personal Spending m/m; US Revised UoM Consumer Sentiment.
AUD/USD:
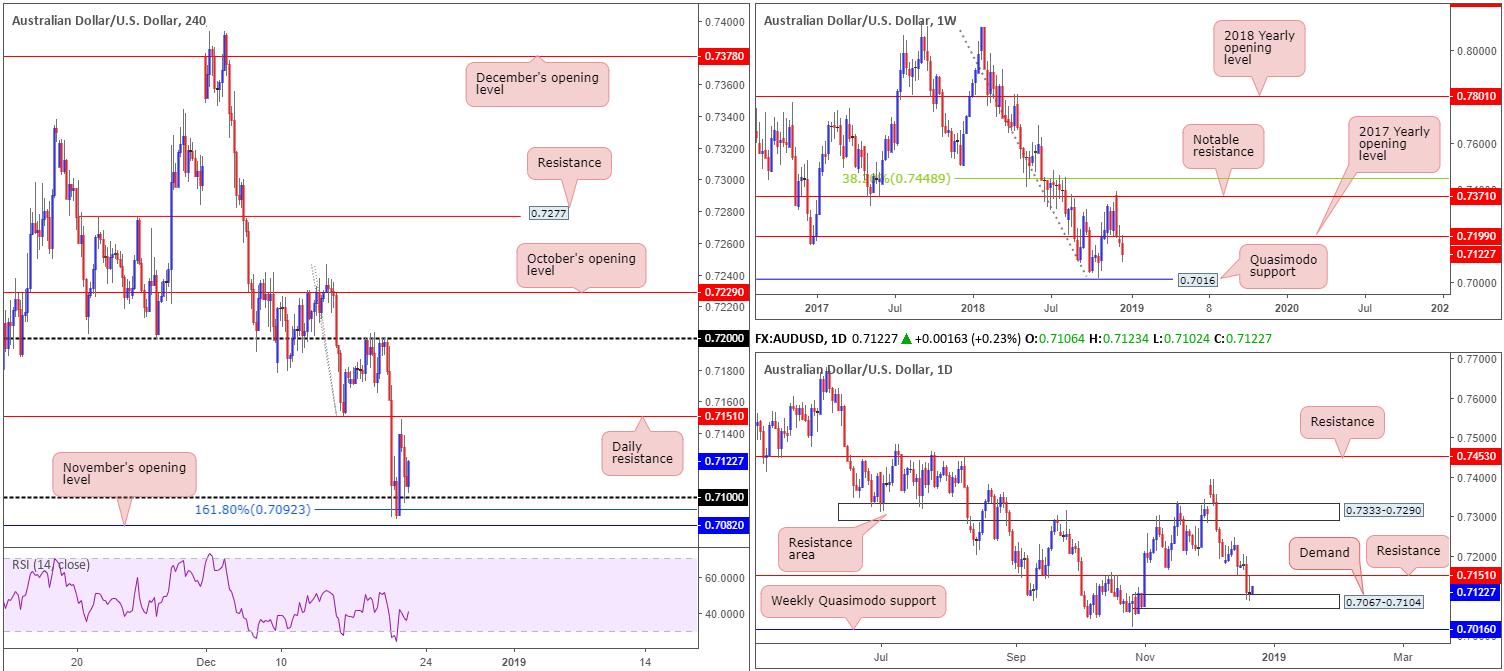
Despite a reasonably upbeat Australian employment reading printed in the early hours of Asia Thursday, the release failed to spark much in terms of buying. However, following a dip beneath 0.71 to bring in buyers from a 161.8% H4 Fibonacci ext. point at 0.7092, the pair recovered strongly as we moved into European trading hours. As is evident from the charts, price action came within striking distance of daily resistance at 0.7151 before retreating lower and ending the day all but unchanged. The research team notes the move higher, although backed by an overall weaker greenback, was likely aided by daily demand seen in play at 0.7067-0.7104.
From the perspective of weekly structure, further selling remains a strong possibility. Last week witnessed a close form beneath the 2017 yearly opening level at 0.7199 in the shape of a bearish pin-bar formation. In addition to this, room is seen for the sellers to press as far south as a Quasimodo support at 0.7016.
Areas of consideration:
Well done to any of our readers who managed to lock in some profits from the bounce off 0.71 yesterday, as this was a noted support level to keep an eye on in Thursday’s briefing.
Going forward, though, neither a long nor short seems attractive. As highlighted above, weekly price is currently eyeing lower levels, while daily and H4 price are seen testing supports. It might also be worth taking into account buyers may also be weakened around the current supports given the recovery seen yesterday.
The research team, therefore, labels this market flat going into today’s session.
Today’s data points: US Core Durable Goods Orders m/m; US Final GDP q/q; US Durable Goods Orders m/m; US Core PCE Price Index m/m; US Personal Spending m/m; US Revised UoM Consumer Sentiment.
USD/JPY:
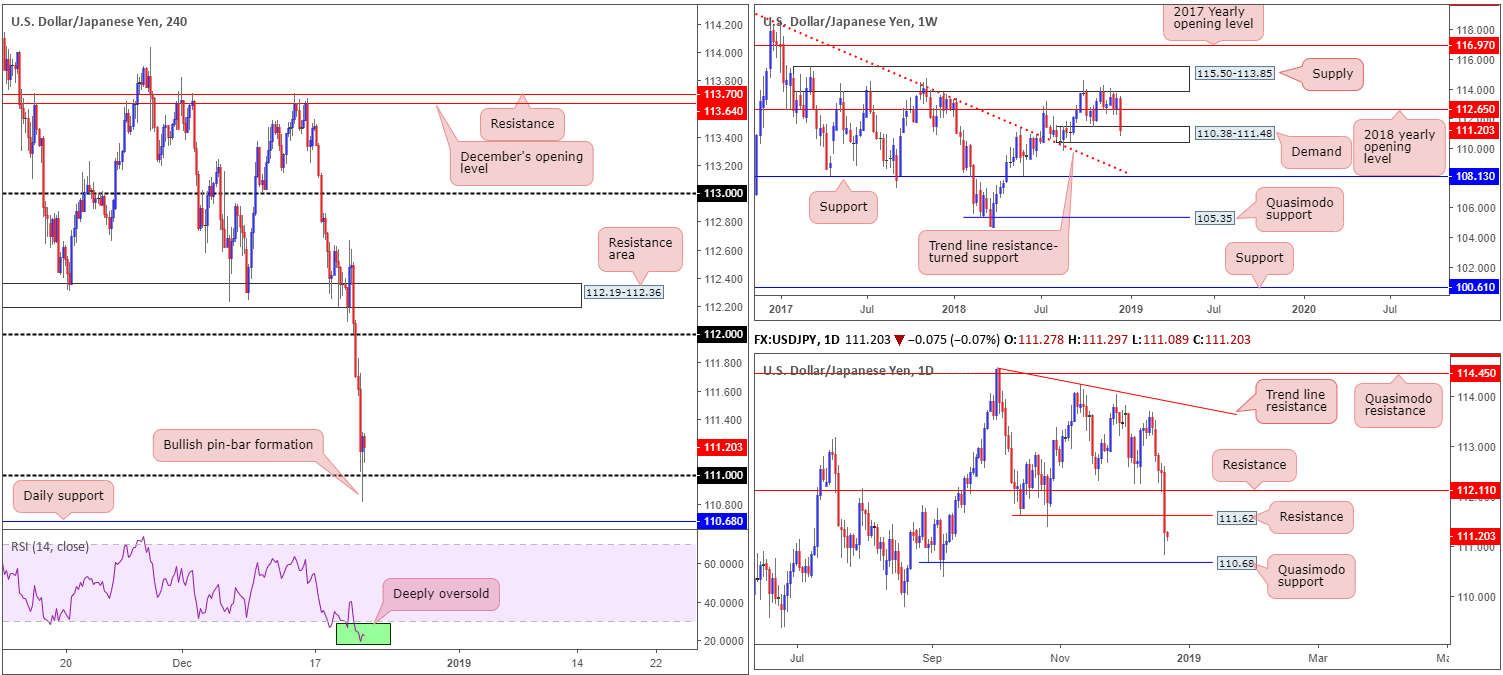
A broadly weaker dollar as well as US equities falling sharply Thursday weighed considerably on the USD/JPY. The market declined in excess of 1.00% yesterday, carrying its total weekly loss to 1.91% thus far.
Weekly price action, as you can see, washed through orders at its 2018 yearly opening level drawn from 112.65, pulling the unit into the walls of a demand zone coming in at 110.38-111.48. This area managed to deliver support back in late October, therefore history may repeat itself.
Lower down on the curve, daily movement overthrew two key supports at 112.11 and 111.62 yesterday, both now acting resistances. According to structure, further selling is a possibility on this scale, with the next area of support not expected to emerge until we reach the Quasimodo formation plotted at 110.68.
In the shape of four dominant H4 bearish candles, the unit cleared 112 off the shelf and tested its 111 handle. While price established support off this number at the closing stages of the day, consequently producing a nice-looking H4 bullish pin-bar formation, the research team notes to be cautious given the daily Quasimodo support seen lurking just south of this number at 110.68.
Areas of consideration:
Entering long on the back of the recent H4 bullish pin-bar formation is chancy for two reasons. Firstly, risk/reward considerations are skewed: an entry at 111.27 with a stop-loss order positioned at 110.80 (beyond the candlestick’s tail), along with an initial take-profit target set at daily resistance 111.62 offers less than a 1:1 ratio. Secondly, there’s a strong chance the market may observe an additional run on stops beneath 111 to bring in daily buyers from the daily Quasimodo support mentioned above at 110.68.
With the above in mind, traders are urged to wait and see if H4 price drives through 111 and challenges 110.68 before engaging with this market. A test of 110.68 in the shape of a reasonably strong H4 bullish close back above 111 would, according to the overall technical picture (remember weekly price is now trading within demand), likely be enough to draw in buyers towards the noted daily resistance.
Today’s data points: US Core Durable Goods Orders m/m; US Final GDP q/q; US Durable Goods Orders m/m; US Core PCE Price Index m/m; US Personal Spending m/m; US Revised UoM Consumer Sentiment.
USD/CAD:
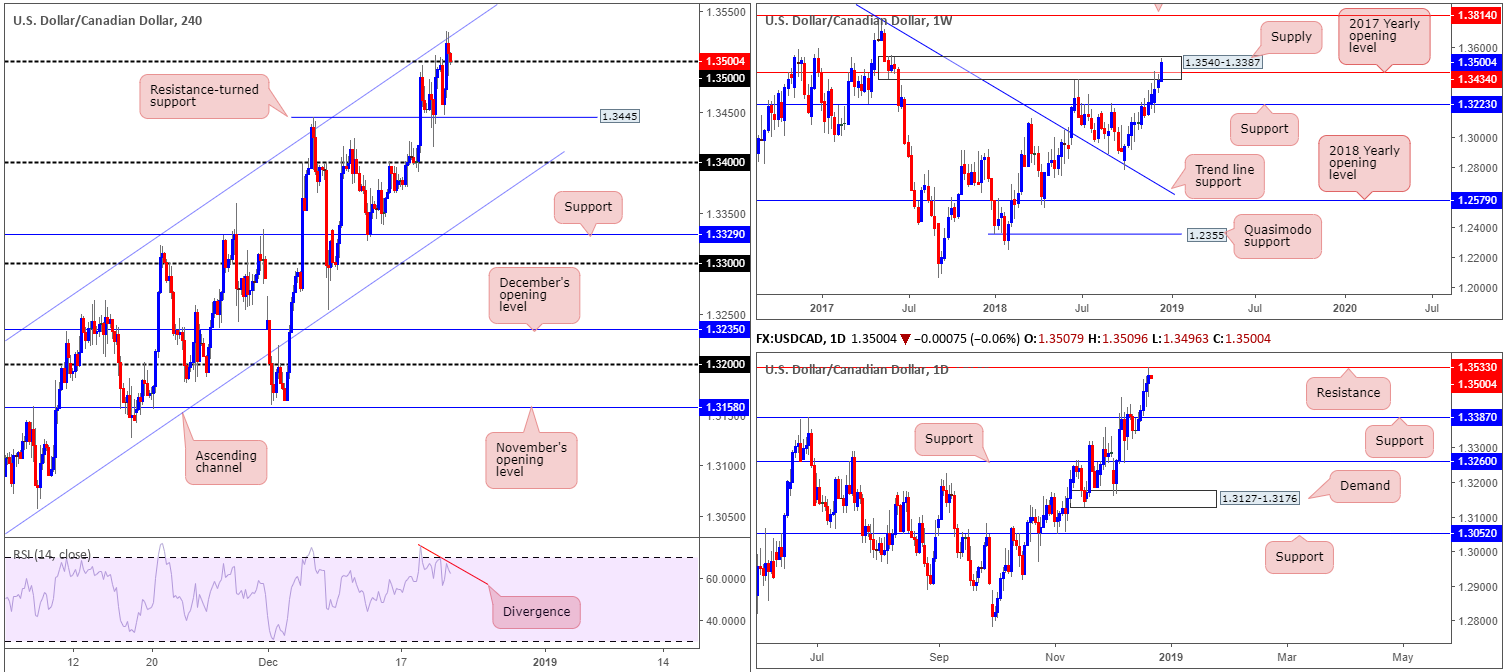
Employing a top-down approach this morning, the research team notes weekly price is currently crossing paths with the upper limits of supply at 1.3540-1.3387. In support of this area, daily movement came within three pips of testing resistance priced in at 1.3533. Combined, the two are likely to provide a ceiling.
Lower down on the curve, the H4 candles reclaimed 1.35+ status amid early US trade Thursday, allowing a test of the nearby channel resistance (etched from the high 1.3132). Note the candles rebounded from this ascending line and brought price to 1.35 into the close. It might also be worth noting the RSI indicator is seen displaying a divergence reading at the moment.
Areas of consideration:
Having seen both weekly and daily structure offer resistance this morning, and the H4 candles recently engage with a channel resistance, a selloff could be on the cards today. To prove seller intent, the research team urges traders to consider waiting for a H4 close to print under 1.35. That way, price is reasonably clear towards H4 support at 1.3445, followed closely by the round number 1.34.
Aggressive traders may opt to simply sell the breakout beneath 1.35 and position stop-loss orders above the rejection candle’s wick. Conservative traders, on the other hand, might feel a retest to the underside of 1.35 in the shape of a bearish candlestick formation is necessary before pulling the trigger (entry/stop parameters can be defined according to this pattern).
Today’s data points: US Core Durable Goods Orders m/m; US Final GDP q/q; US Durable Goods Orders m/m; US Core PCE Price Index m/m; US Personal Spending m/m; US Revised UoM Consumer Sentiment. Canadian Core Retail Sales m/m, GDP m/m and Retail Sales m/m; BoC Business Outlook Survey.
USD/CHF:
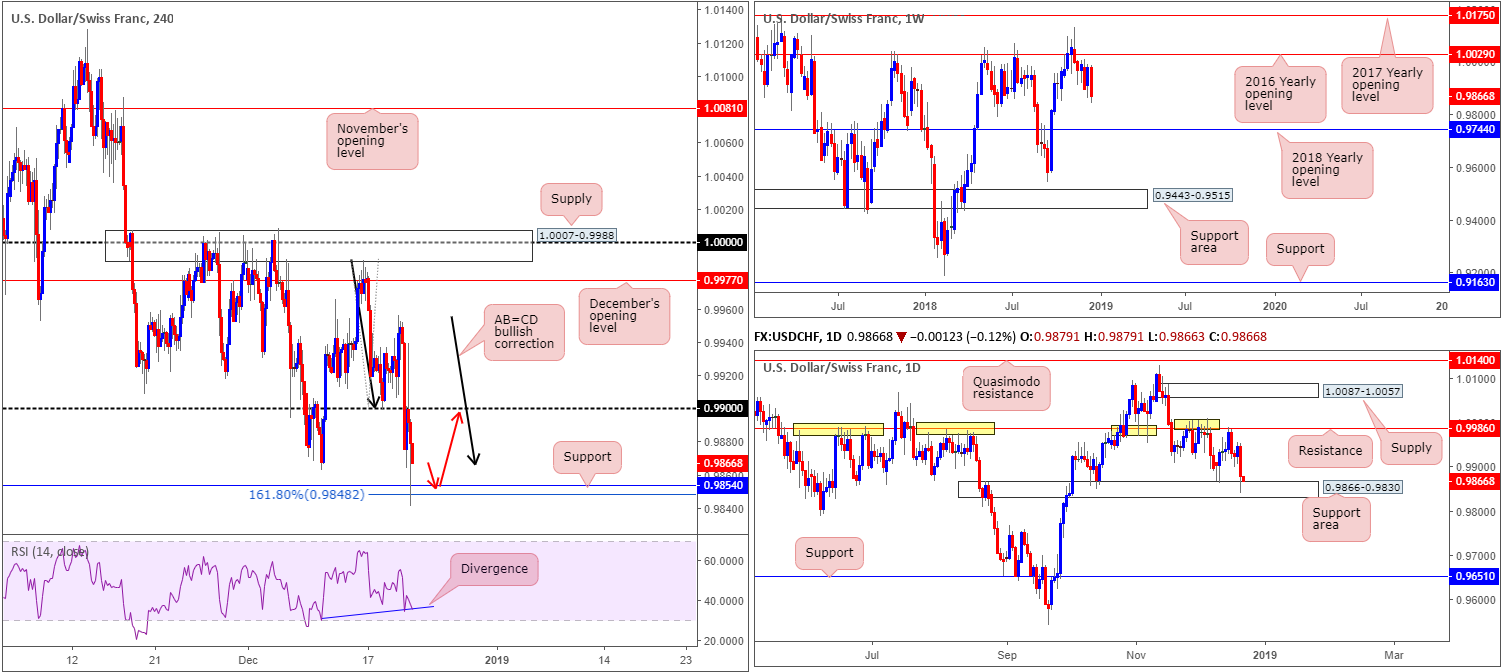
Broad-based USD selling, along with an influx of safe-haven CHF buying on the back of US equities aggressively exploring lower ground, overwhelmed the USD/CHF market Thursday, concluding the day down 0.67%.
Down an overall 1.07% on the week so far, weekly price could, according to structure, potentially press as far south as the 2018 yearly opening level at 0.9744. Daily price, on the other hand, is now seen shaking hands with a support area drawn from 0.9866-0.9830. Should the buyers attempt a recovery from this platform, resistance at 0.9986 is in view as the next upside hurdle.
Supporting the current daily support area, the H4 candles recently completed a bullish AB=CD (black arrows) 161.8% bullish pattern at 0.9848, which boasts merging support from 0.9854. Further adding to this, the RSI indicator is seen displaying a divergence signal.
Areas of consideration:
According to our technical studies, daily and H4 structure suggest buyers may enter the fold, though on the longer-term weekly chart, sellers remain in the driving seat.
On account of the above, should the H4 candles retest 0.9850ish today (red arrows) and hold firm by way of a reasonably recognizable bullish candle, a long from this region could be something to consider, targeting the underside of 0.99 as the initial take-profit zone.
Today’s data points: US Core Durable Goods Orders m/m; US Final GDP q/q; US Durable Goods Orders m/m; US Core PCE Price Index m/m; US Personal Spending m/m; US Revised UoM Consumer Sentiment.
Dow Jones Industrial Average:
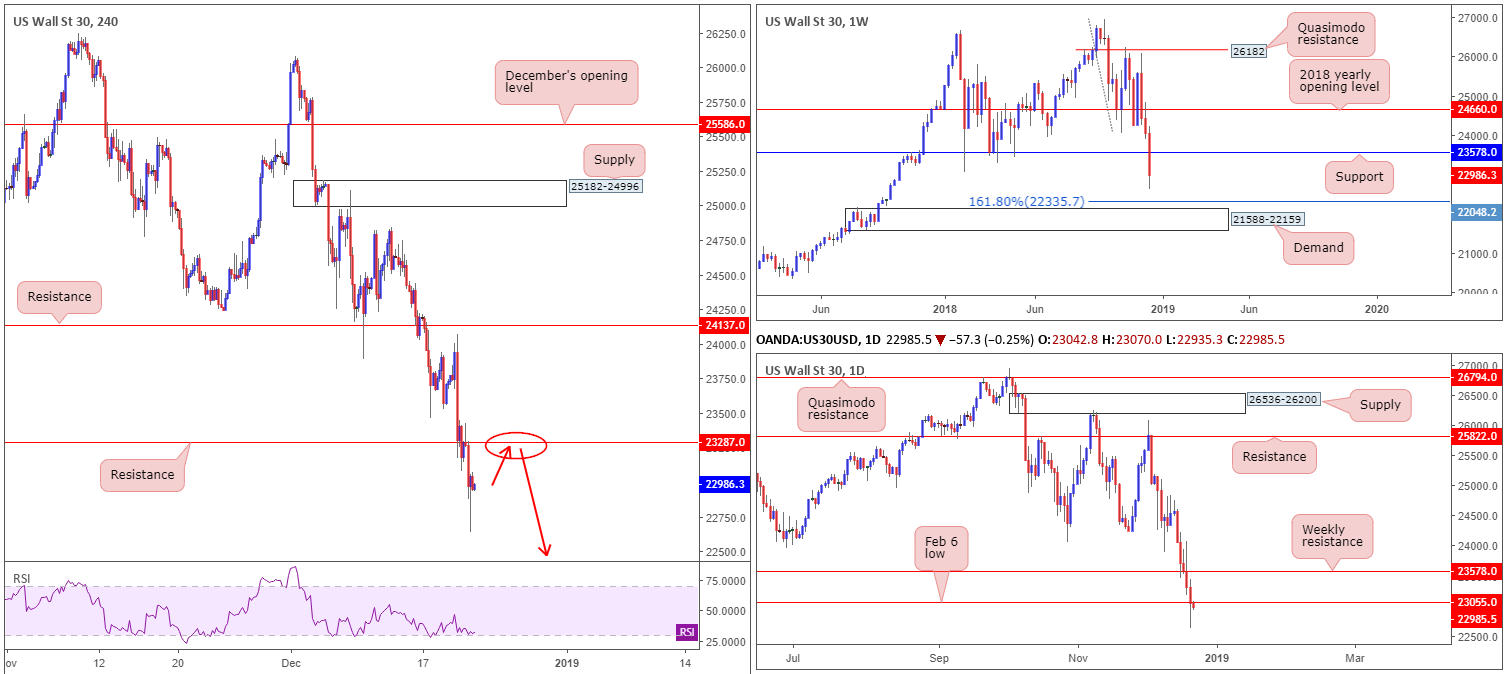
Following Wednesday’s lemming-like stampede in response to the latest FOMC announcements, Thursday’s sessions witnessed further selling take shape. Down a whopping 4.5% on the week so far, each timeframe, according to our technical studies, suggest additional downside could be in store.
Weekly flow, after firmly engulfing support at 23578, shows room to press as far south as the 161.8% Fibonacci ext. point at 22335, shadowed closely by demand plotted at 21588-22159. In similar fashion, daily movement appears poised to explore lower ground after violently stabbing through the 23055 Feb 6 low. The next downside target on the daily timeframe falls in at demand drawn from 22207-22373 (not seen on the screen).
Across on the H4 timeframe, we see little difference in structure. Daily demand highlighted above at 22207-22373 is seen as the next downside support area on this scale after washing through orders at support carved from 23287 (now acting resistance).
Areas of consideration:
In the event the market witnesses a retest (as per the red arrows) of H4 resistance at 23287 by way of a bearish candlestick formation (entry/stop parameters can be defined according to this pattern), this would, according to the overall technical landscape, likely prompt another wave of selling, targeting the aforementioned daily demand zone.
Today’s data points: US Core Durable Goods Orders m/m; US Final GDP q/q; US Durable Goods Orders m/m; US Core PCE Price Index m/m; US Personal Spending m/m; US Revised UoM Consumer Sentiment.
XAU/USD (Gold):
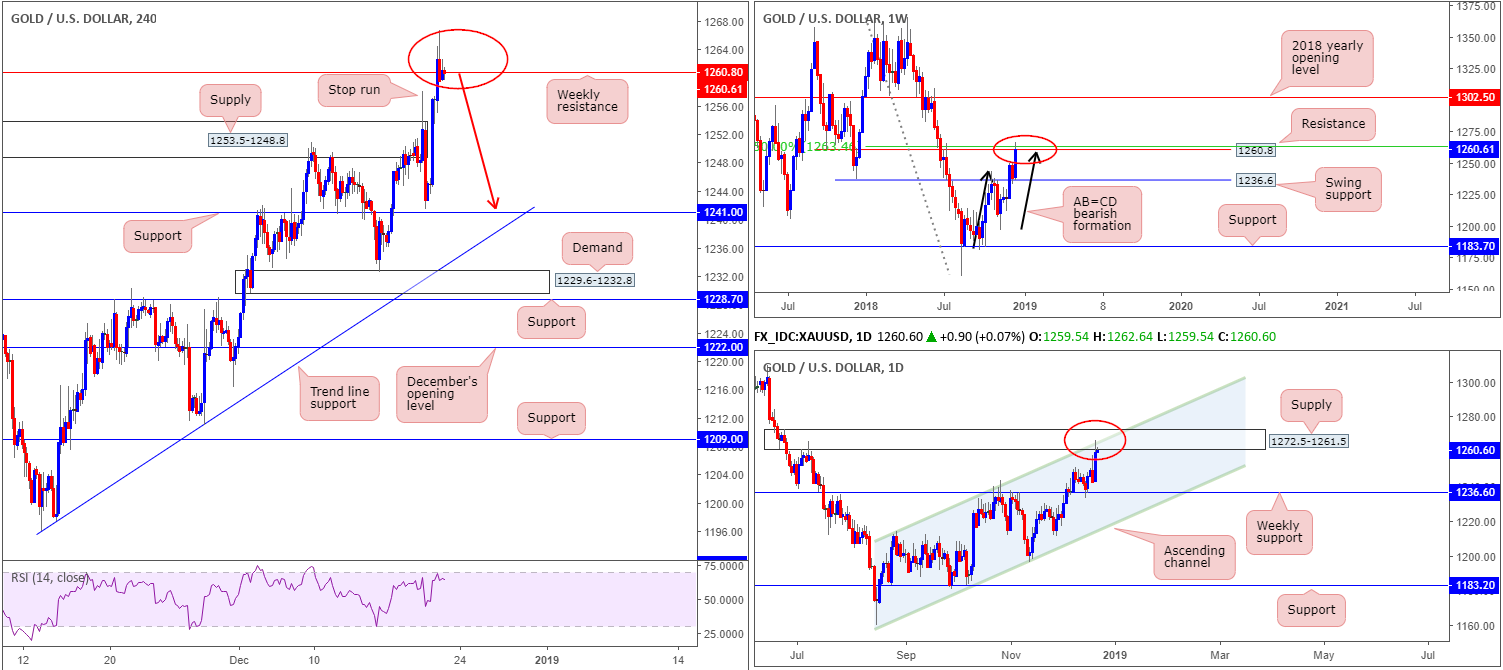
Having witnessed a reasonably large stop run take shape through the top edge of a H4 supply zone at 1253.5-1248.8 Wednesday, Thursday’s briefing highlighted the possibility of further buying taking place off H4 support registered at 1241.0, targeting weekly resistance at 1260.8. As you can see from the charts this morning, the H4 candles left the noted support unchallenged by a couple of pips prior to turning north and shaking hands with the weekly level.
Moving forward, the research team wants to remind traders the current weekly resistance level merges with some very interesting structure: converges closely with an AB=CD bearish completion point (black arrows) and a 50.0% resistance value at 1263.4 (green). Further adding to this, though, daily action is also touching gloves with a supply area drawn from 1272.5-1261.5 that fuses with a channel resistance (etched from the high 1214.3).
Areas of consideration:
Keeping things as simple as possible this morning, the market is likely to experience a least a pause in buying given the higher-timeframe resistances in play at the moment. The selling from these areas could be enough to drag the H4 candles back to support mentioned above at 1241.0. However, in order to take advantage of this move, traders are urged to wait for additional bearish candlestick structure to form (entry/stop parameters can be defined according to this pattern). Besides providing entry and stop parameters, the pattern will help indicate seller interest.
The use of the site is agreement that the site is for informational and educational purposes only and does not constitute advice in any form in the furtherance of any trade or trading decisions.
The accuracy, completeness and timeliness of the information contained on this site cannot be guaranteed. IC Markets does not warranty, guarantee or make any representations, or assume any liability with regard to financial results based on the use of the information in the site.
News, views, opinions, recommendations and other information obtained from sources outside of www.icmarkets.com.au, used in this site are believed to be reliable, but we cannot guarantee their accuracy or completeness. All such information is subject to change at any time without notice. IC Markets assumes no responsibility for the content of any linked site. The fact that such links may exist does not indicate approval or endorsement of any material contained on any linked site.
IC Markets is not liable for any harm caused by the transmission, through accessing the services or information on this site, of a computer virus, or other computer code or programming device that might be used to access, delete, damage, disable, disrupt or otherwise impede in any manner, the operation of the site or of any user’s software, hardware, data or property.


