
A note on lower timeframe confirming price action…
Waiting for lower timeframe confirmation is our main tool to confirm strength within higher timeframe zones, and has really been the key to our trading success. It takes a little time to understand the subtle nuances, however, as each trade is never the same, but once you master the rhythm so to speak, you will be saved from countless unnecessary losing trades. The following is a list of what we look for:
- A break/retest of supply or demand dependent on which way you’re trading.
- A trendline break/retest.
- Buying/selling tails/wicks – essentially we look for a cluster of very obvious spikes off of lower timeframe support and resistance levels within the higher timeframe zone.
- Candlestick patterns. We tend to stick with pin bars and engulfing bars as these have proven to be the most effective.
We search for lower timeframe confirmation between the M15 and H1 timeframes, since most of our higher-timeframe areas begin with the H4. Stops are usually placed 3-5 pips beyond confirming structures.
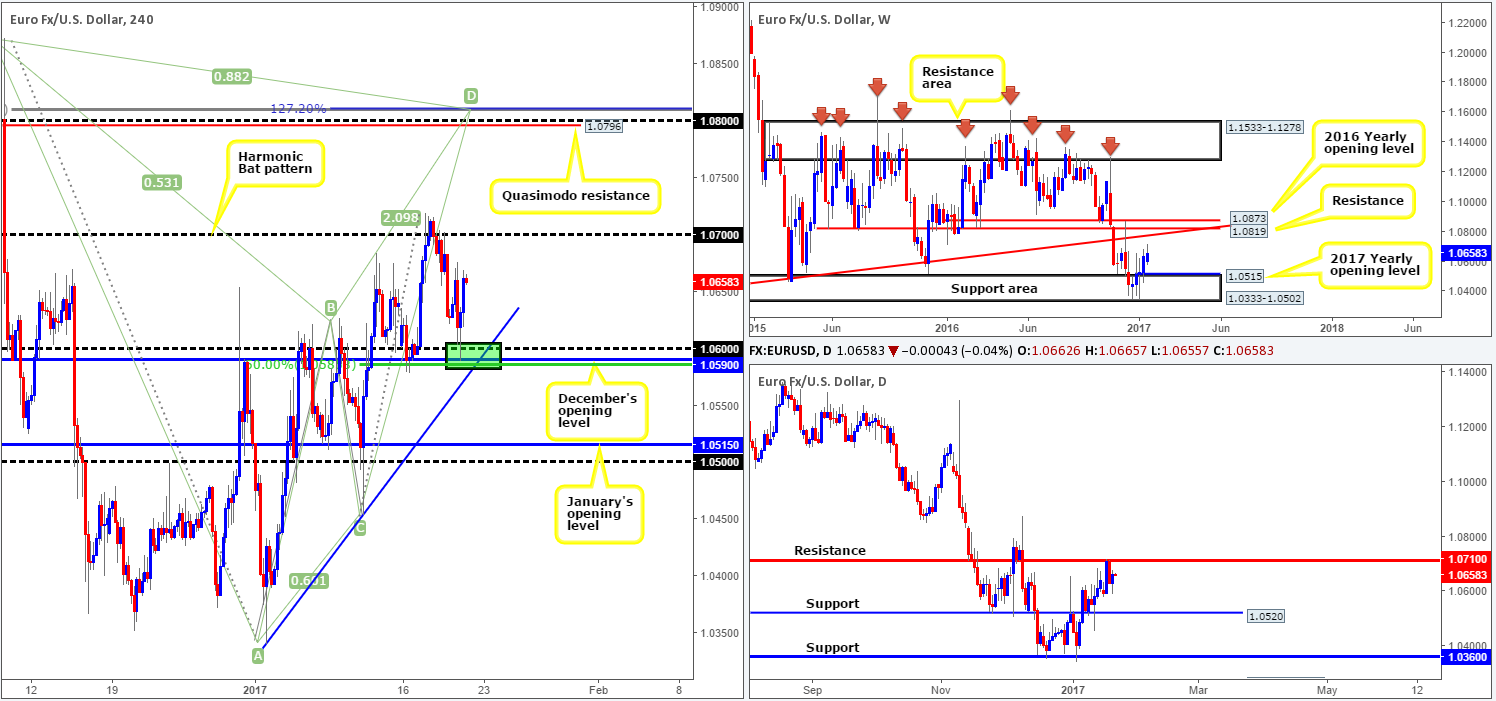
EUR/USD:
In recent trading, the ECB left interest rates on hold, as expected. This was followed shortly by a round of dovish comments from ECB president Draghi, with the bank keeping monetary policy unchanged. At the same time, US housing data, the Philly Fed manufacturing index report and Jobless claims all came in better than expected, immediately sending the single currency down to the 1.06 region. For those who read our last report, 1.06 was highlighted as a strong place for a rebound (bolstered by December’s opening level at 1.0590, a H4 50.0% Fib support at 1.0584 and a H4 trendline support extended from the low 1.0340). The only thing lacking was higher-timeframe confluence. Well done to any of our readers who managed to net some green pips from this call!
Our suggestions: From a technical perspective, the 1.07 boundary is likely to be the next level on tap today which happens to be located 10 pips below a daily resistance level at 1.0710. However, the more attractive zone, in our opinion, is seen lurking above at the 1.08 neighborhood. Not only is this number sited nearby a H4 Quasimodo resistance level at 1.0796 as well as the tip of a H4 Harmonic (Bat) potential reversal zone at 1.0809, it also fuses nicely with a long-term weekly trendline resistance extended from the low 0.8231!
Data points to consider: Fed Chair Yellen speaks at 1am, FOMC member Harker speaks at 2pm GMT, Trump’s inauguration and speech (tentative).
Levels to watch/live orders:
- Buys: Flat (stop loss: N/A).
- Sells: 1.07 region ([lower-timeframe confirmation is required here before a trade can be executed] stop loss: depends on where one confirms the zone). 1.08 region ([dependent on the time of day, this is an area we would consider trading without confirmation] stop loss: 1.0815 [aggressive stop] 1.0875 [conservative stop]).
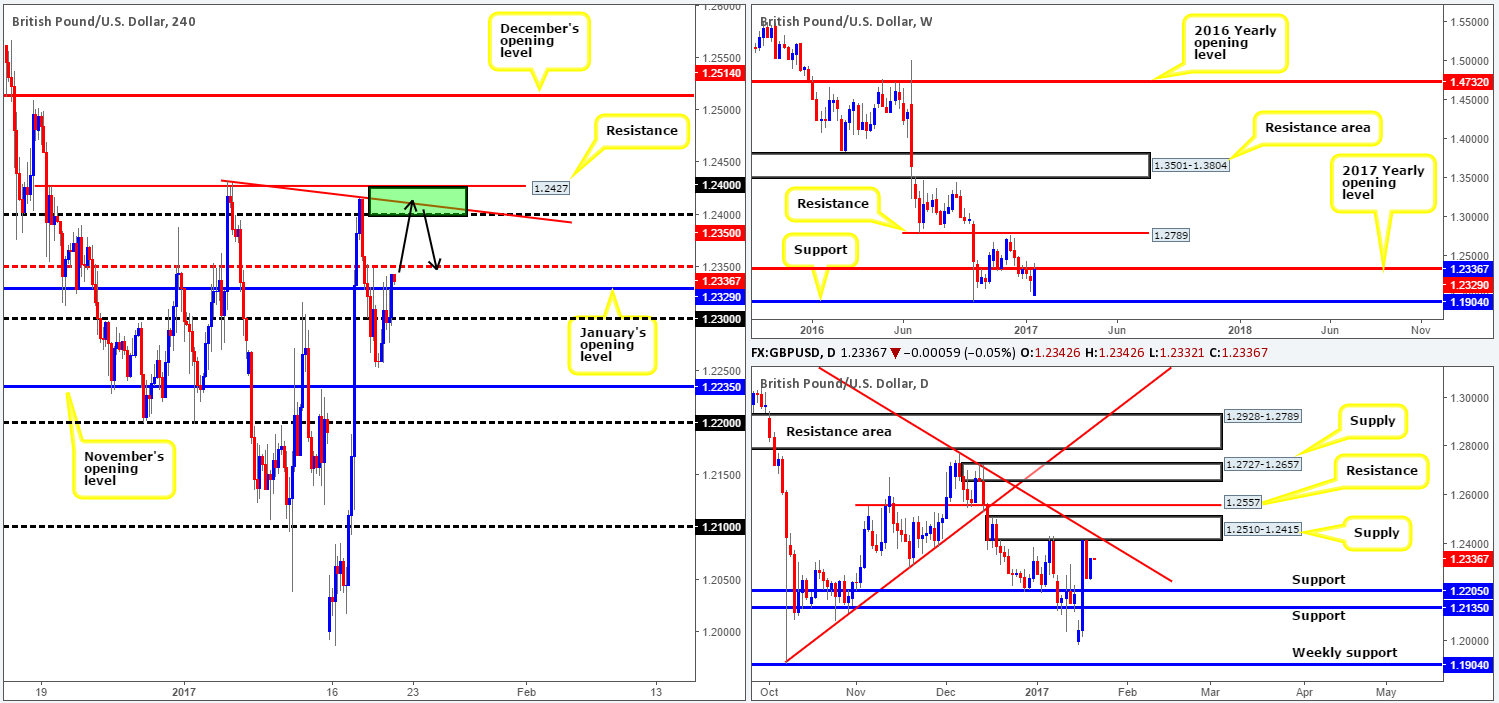
GBP/USD:
The GBP pushed higher against its US counterpart on Thursday, ending the day with modest gains and consequently erasing around 50% of Wednesday’s losses.
Technically speaking, we have just recently seen the H4 candles close above January’s opening level at 1.2329. Although considered a bullish cue, just ahead of this barrier sits the H4 mid-way resistance drawn from 1.2350, shadowed closely by the 1.24 handle/H4 resistance at 1.2427 (bolstered also by daily supply at 1.2510-1.2415 and its converging daily trendline taken from the high 1.3445). As a result, upside is somewhat restricted today, in our opinion.
Our suggestions: Despite our team placing longs on the bench today, we feel shorts could be a possibility from the above noted H4 resistance and the 1.24 handle (reinforced by a H4 trendline resistance stretched from the high 1.2432), considering its connection to the daily timeframe (see above).
Data points to consider: UK retail sales at 9.30am. Fed Chair Yellen speaks at 1am, FOMC member Harker speaks at 2pm GMT, Trump’s inauguration and speech (tentative).
Levels to watch/live orders:
- Buys: Flat (stop loss: N/A).
- Sells: 1.2427/1.24 ([dependent on the time of day, this is an area we would consider trading without confirmation] stop loss: 1.2431).
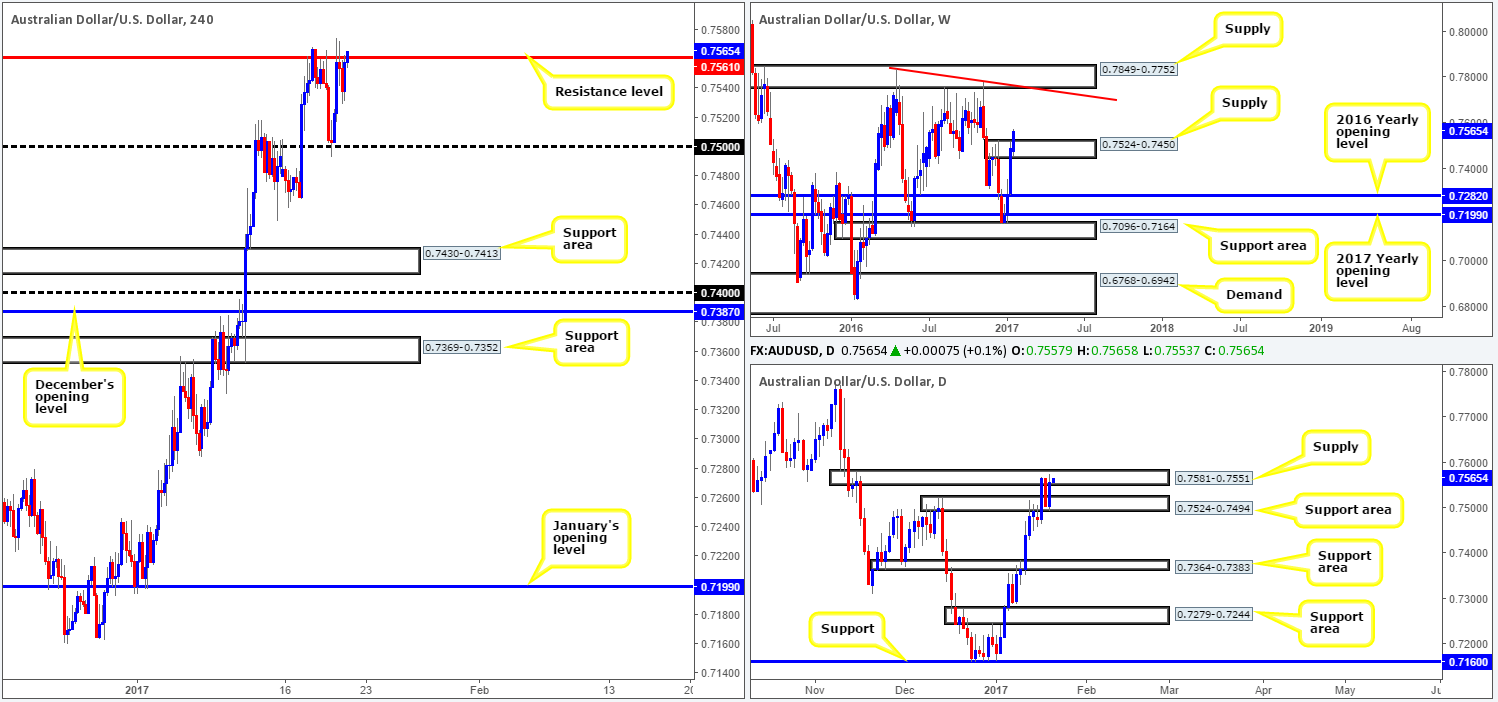
AUD/USD:
Having fallen so aggressively from H4 resistance at 0.7561 on Wednesday (sparked by the slightly hawkish words of Fed Chair Janet Yellen), the commodity currency caught a fresh bid from the 0.75 handle going into the early hours of yesterday’s session. This, as far as we can see, was reinforced by Aussie employment data which came in relatively positive, adding 13,500 new jobs in December. Unemployment, nevertheless, was not so upbeat, registering 5.8% vs. expected 5.7%.
Despite an earnest attempt from the bulls, however, price failed to sustain gains beyond the aforementioned H4 resistance level. Although a H4 close above this line would be considered a bullish cue (even more so when one takes into account that weekly action looks to be on course to close above weekly supply at 0.7524-0.7450), it may be worth noting that price will still be trading within the walls of a daily supply zone seen at 0.7581-0.7551. Therefore, our team will only consider becoming buyers if, and only if, there is a daily close seen above this barrier.
Our suggestions: Through the simple lens of a technical trader, sitting on your hands seems to be the best bet today. Once the market closes for the week, we can determine direction with more precision. For example, a weekly close above weekly supply, along with a daily close above daily supply would, in our opinion, set the tone for next week’s trading. It’ll be interesting to see how today pans out given Trump’s inauguration and speech.
Data points to consider: Chinese growth and industrial production figures set to be released at 2am. Fed Chair Yellen speaks at 1am, FOMC member Harker speaks at 2pm GMT, Trump’s inauguration and speech (tentative).
Levels to watch/live orders:
- Buys: Flat (stop loss: N/A).
- Sells: Flat (stop loss: N/A).
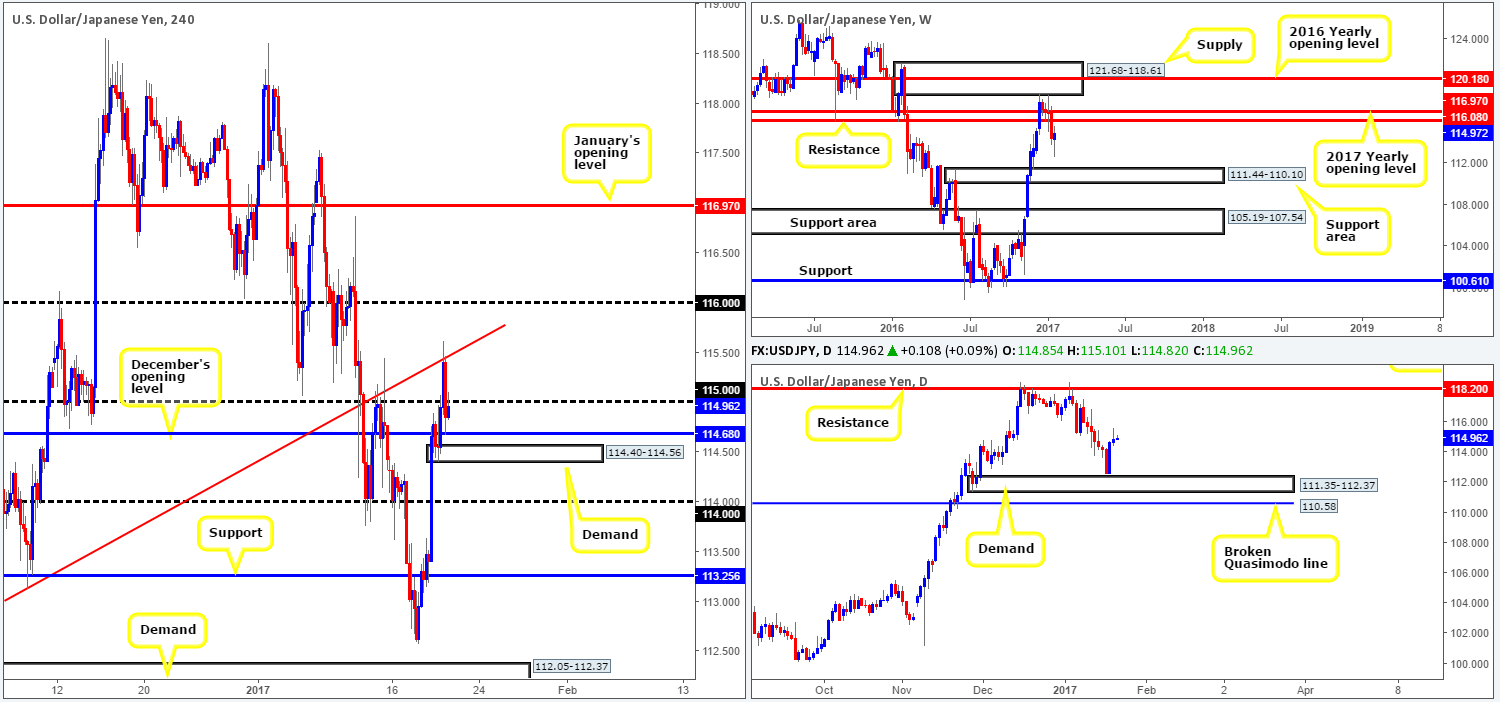
USD/JPY:
Sparked by upbeat US data, the pair advanced north yesterday and collided with a H4 resistance level extended from the low 112.86, which, as you can see, held firm. As we write, the H4 candles recently bounced off December’s opening level at 114.68, and is now seen teasing the 115 psychological boundary. There is very little that jumps out at us this morning with ‘trade me’ written on it. The 116 handle is interesting, however, owing to its connection with weekly resistance coming in at 116.08. Be that as it may, price has to not only get past 115 first, but also the above noted H4 trendline resistance.
Our suggestions: With volatility expected to be high today due to Trump’s inauguration and speech, and with there being little on offer at this time, we feel it may be better to remain on the bench.
Data points to consider: Fed Chair Yellen speaks at 1am, FOMC member Harker speaks at 2pm GMT, Trump’s inauguration and speech (tentative).
Levels to watch/live orders:
- Buys: Flat (stop loss: N/A).
- Sells: Flat (stop loss: N/A).
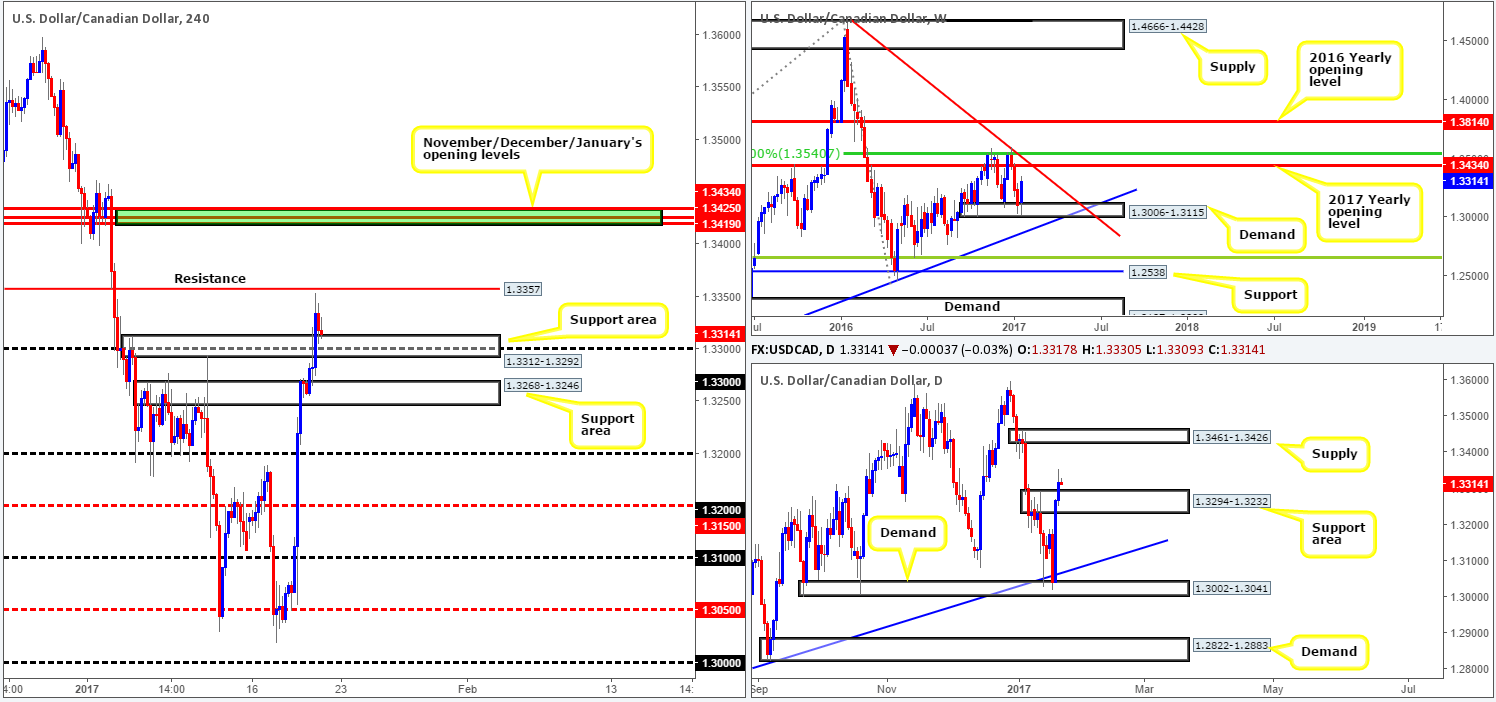
USD/CAD:
In response to yesterday’s buoyant US economic data, the USD/CAD smashed through offers at H4 supply drawn from 1.3312-1.3292, which, as you can see, is now being retested as support. Other than the H4 resistance seen at 1.3357, the path north looks free up to November/December/January’s opening levels (1.3434/1.3419). In addition to this, over on the daily chart price action recently took out daily supply at 1.3294-1.3232 (now an acting support area), and likewise looks to have cleared the path northbound up to a daily supply zone coming in at 1.3461-1.3426 (situated just a few pips above the monthly levels). All of this coupled with the weekly chart showing space to rally higher, we believe that the bulls have a clear edge in this market at the moment.
Our suggestions: In light of the above notes, our desk is currently watching for long opportunities out of the H4 support area at 1.3312-1.3292. Ideally, we’d like to enter using lower-timeframe structure (see the top of this report), since the round number 1.33 (positioned within) could potentially force price to fake lower before rallying higher. The first take-profit objective form this angle would be the aforementioned H4 resistance, followed closely by the above said monthly opening levels colored in green.
Data points to consider: Canadian CPI and retail sales figures to be released at 1.30pm. Fed Chair Yellen speaks at 1am, FOMC member Harker speaks at 2pm GMT, Trump’s inauguration and speech (tentative).
Levels to watch/live orders:
- Buys: 1.3312-1.3292 ([lower-timeframe confirmation is required here before a trade can be executed] stop loss: depends on where one confirms the zone).
- Sells: Flat (stop loss: N/A).
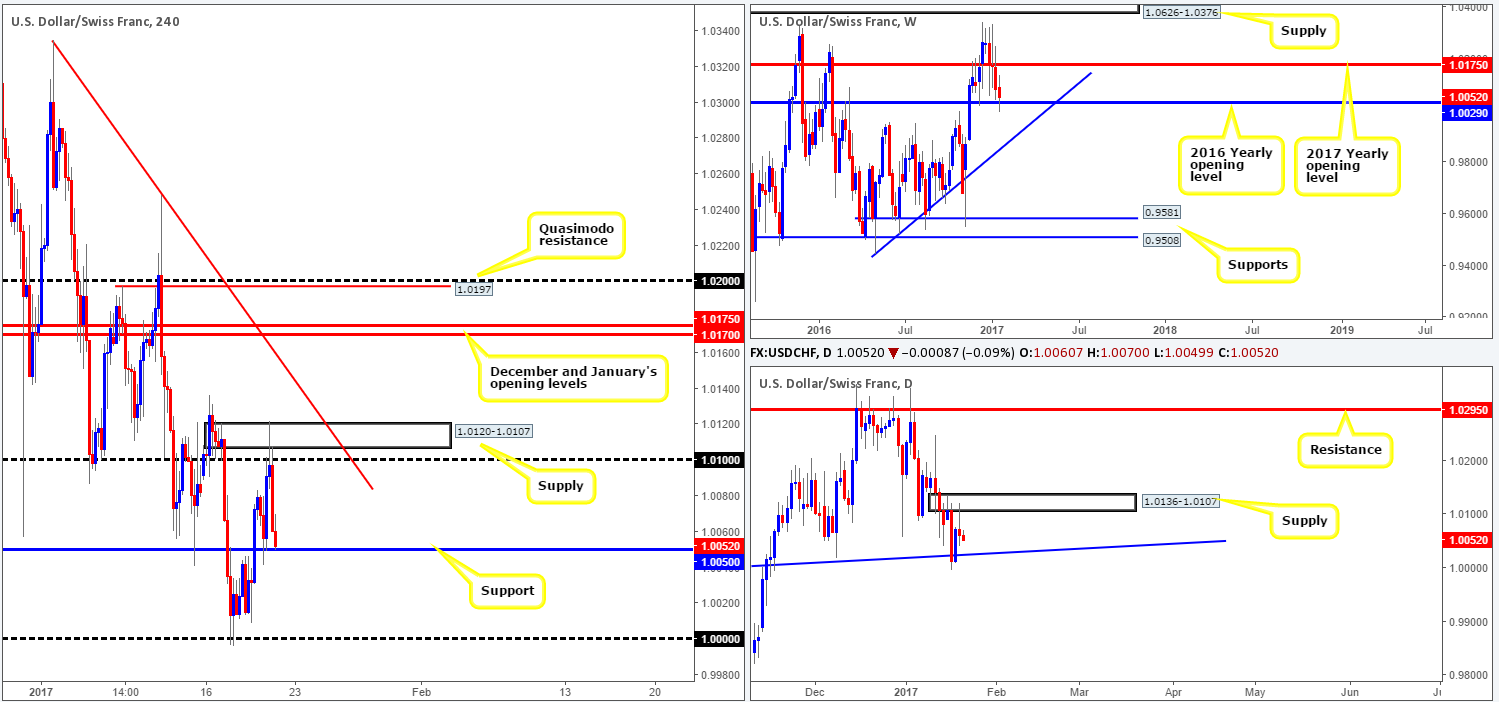
USD/CHF:
Starting from the top this morning, we can see that the 2016 yearly opening level at 1.0029 continues to hold ground in this market. The next upside target from this range can be seen at 1.0175: the 2017 yearly opening level. The story on the daily chart, nevertheless, shows that the candles are currently sandwiched between daily supply at 1.0136-1.0107 and a daily trendline support drawn from the high 0.9956. A violation of the supply could see the pair attempt an approach to daily resistance coming in at 1.0295, whereas a close below the trendline support may suggest the pair wants to test the weekly trendline support taken from the low 0.9443.
Across the water on the H4 chart, the unit rallied north on the back of upbeat US data yesterday but failed to sustain gains beyond H4 supply at 1.0120-1.0107, consequently crumbling to lows of 1.0053 by the close. A close below the current H4 support at 1.0050 would likely place parity back in view, and also the aforementioned daily trendline support.
Our suggestions: Selling beyond the H4 support is not really something our team finds that attractive, since there is a good chance price may fail to reach parity and instead react from the 2016 yearly opening barrier. Similarly, entering long from the H4 support is risky, owing to there being little higher-timeframe structure supporting this level.
A long from between 1.0000/1.0029 on the other hand, could be something to consider since this zone comprises of both parity and the 2016 yearly level, and also converges nicely with the daily trendline support. However, we would only advise entering long if one is able to pin down a lower-timeframe buy signal (see the top of this report) as the markets are likely to be volatile today given Trump’s inauguration and speech.
Data points to consider: Fed Chair Yellen speaks at 1am, FOMC member Harker speaks at 2pm GMT, Trump’s inauguration and speech (tentative).
Levels to watch/live orders:
- Buys: 1.0000/1.0029 ([lower-timeframe confirmation is required here before a trade can be executed] stop loss: depends on where one confirms the zone).
- Sells: Flat (stop loss: N/A).
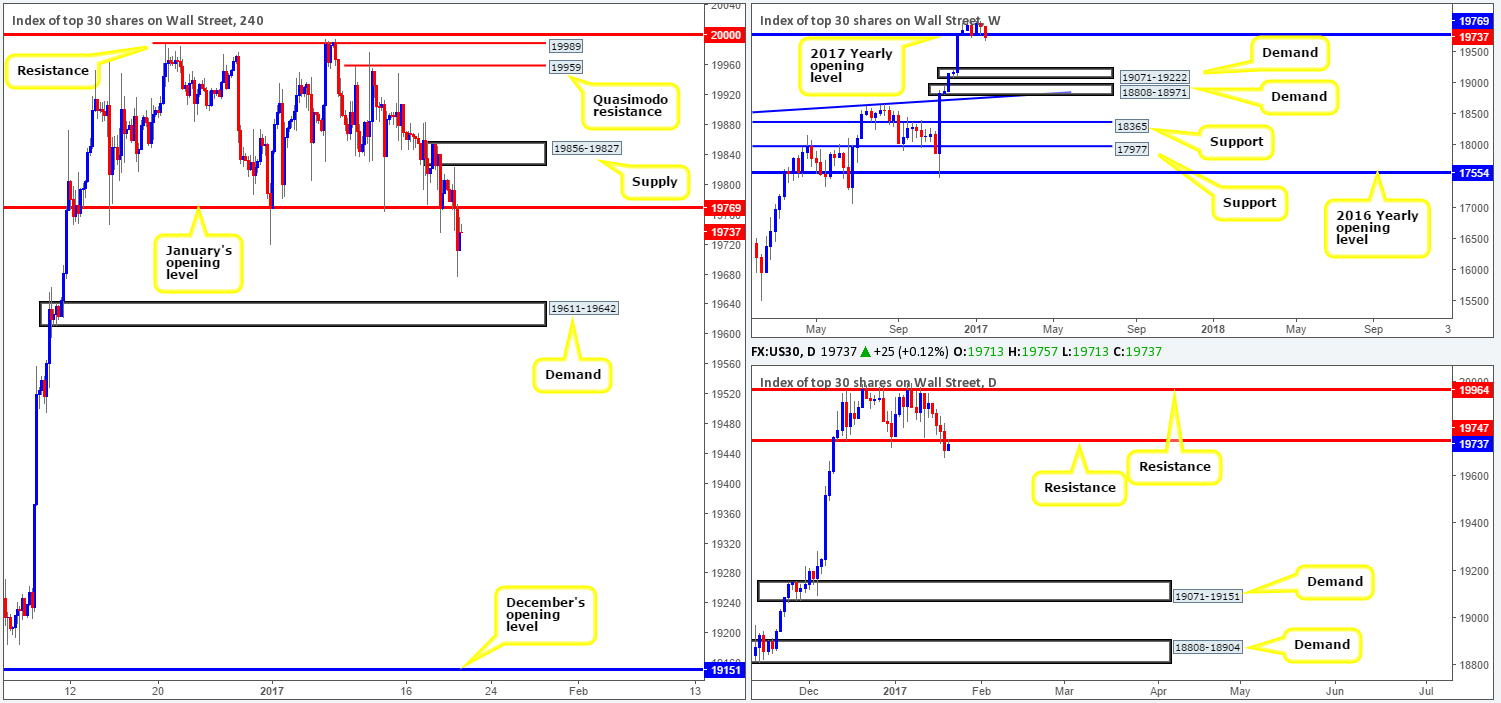
DOW 30:
Following a brief rally off January’s opening level at 19769 on Wednesday, the DOW slipped below these bids yesterday and touched lows of 19677. In view of this, the H4 demand base seen at 19611-19642 is now the next area in the firing range. Additionally, daily support at 19747 was also taken out during yesterday’s bearish descent, and, at the time of writing, is currently being retested as resistance. Should this daily level hold form into the week’s end, this may trigger further selling next week, since there’s a truckload of space seen to the downside until we reach the next area of daily support: a daily demand zone seen at 19071-19151.
Our suggestion: While the US equity market is reflecting somewhat of a bearish stance at present, Trump’s inauguration and speech could very well change this! Under usual circumstances, we would be looking for shorting opportunities between the H4 resistance at 19769 and the daily resistance at 19747. However, our team has come to a consensus today that remaining on the sidelines and reassessing structure post Trump is the better path to take.
Data points to consider: Fed Chair Yellen speaks at 1am, FOMC member Harker speaks at 2pm GMT, Trump’s inauguration and speech (tentative).
Levels to watch/live orders:
- Buys: Flat (stop loss: N/A).
- Sells: Flat (stop loss: N/A).
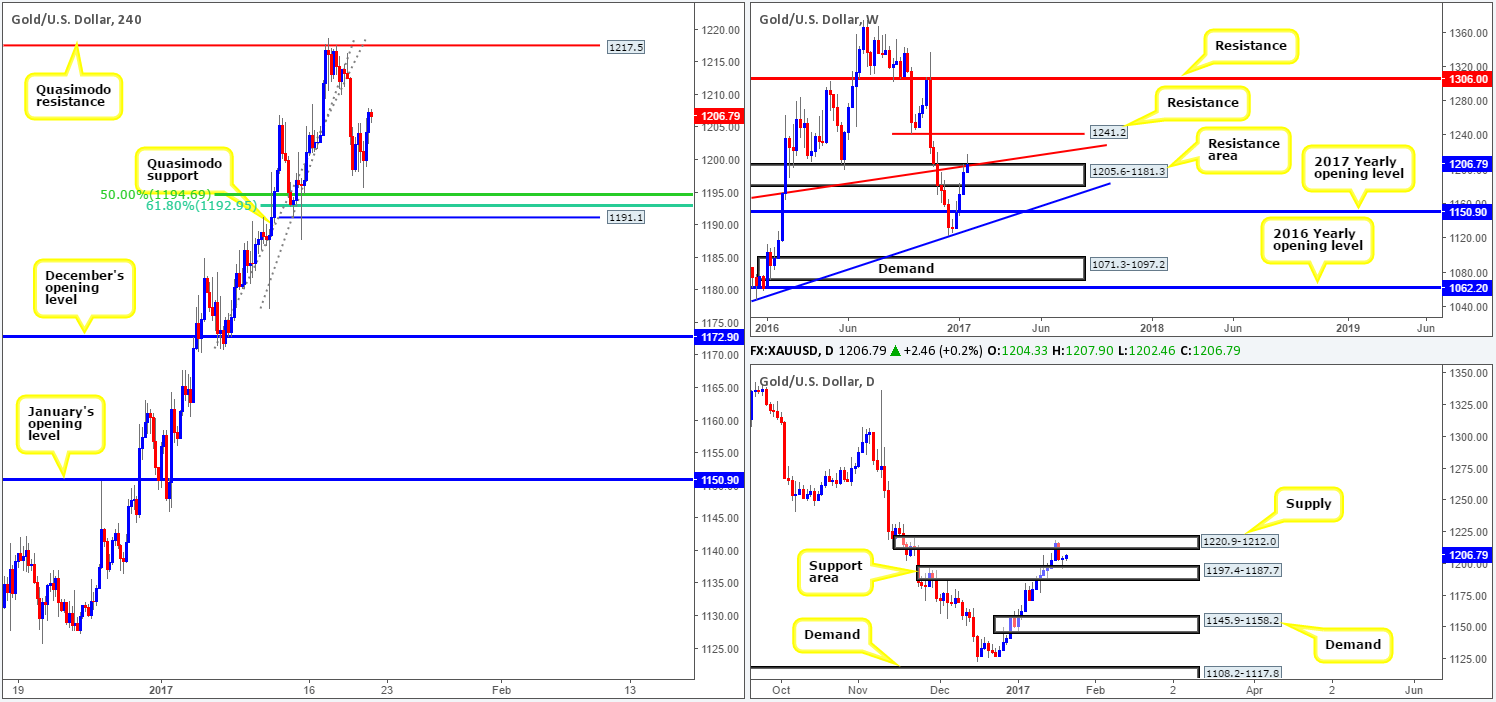
GOLD:
Gold came under fresh pressure during the early hours of yesterday’s US segment, following a string of upbeat US data. This forced the yellow metal to lows of 1195.9, a few pips short of the H4 50.0% Fib support at 1194.6 before forming a bottom and marching to highs of 1206.4. The next upside objective on the H4 scale falls in at 1217.5: a H4 resistance that is firmly planted within the walls of a daily supply area drawn from 1220.9-1212.0.
With the above in mind, let’s see how the land lies over in the bigger picture. Weekly price remains toying with the top edge of a weekly resistance area at 1205.6-1181.3. This area suffered a rather aggressive breach at the beginning of the week, but looks to have been saved by the daily supply zone mentioned above, which recently pushed the daily candles back down to a daily support area fixed at 1197.4-1187.7.
Our suggestions: As of current price, neither a long nor short seems attractive at this time. In fact, with Trump’s inauguration and speech just around the corner, and the conflicting signals we’re receiving from the higher-timeframe structures right now (see above), we, much like our AUD/USD outlook, see little alternative but to sit on our hands today.
Levels to watch/live orders:
- Buys: Flat (stop loss: N/A).
- Sells: Flat (stop loss: N/A).


