
Waiting for lower timeframe confirmation is our main tool to confirm strength within higher timeframe zones, and has really been the key to our trading success. It takes a little time to understand the subtle nuances, however, as each trade is never the same, but once you master the rhythm so to speak, you will be saved from countless unnecessary losing trades. The following is a list of what we look for:
- A break/retest of supply or demand dependent on which way you’re trading.
- A trendline break/retest.
- Buying/selling tails/wicks – essentially we look for a cluster of very obvious spikes off of lower timeframe support and resistance levels within the higher timeframe zone.
We typically search for lower-timeframe confirmation between the M15 and H1 timeframes, since most of our higher-timeframe areas begin with the H4. Stops are usually placed 1-3 pips beyond confirming structures.
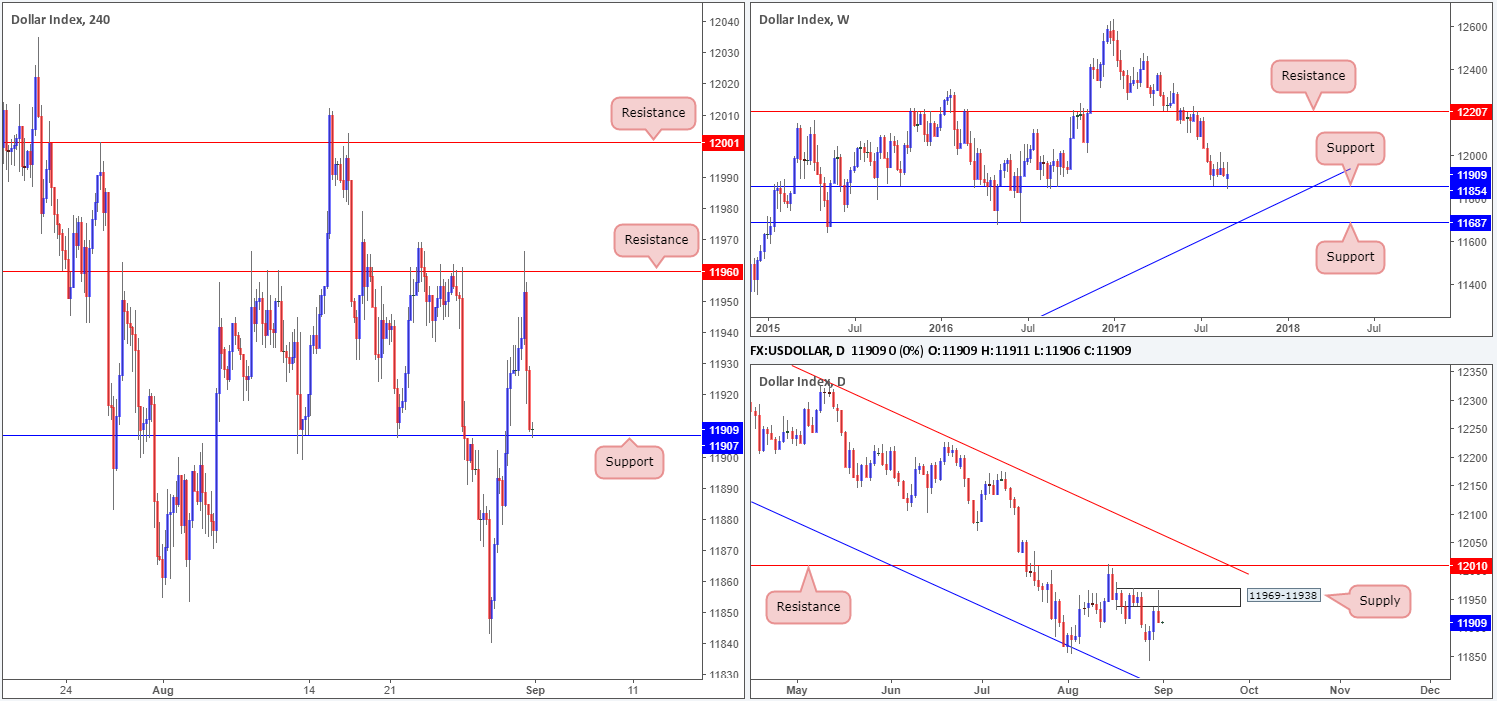
US dollar index (USDX):
EUR/USD:
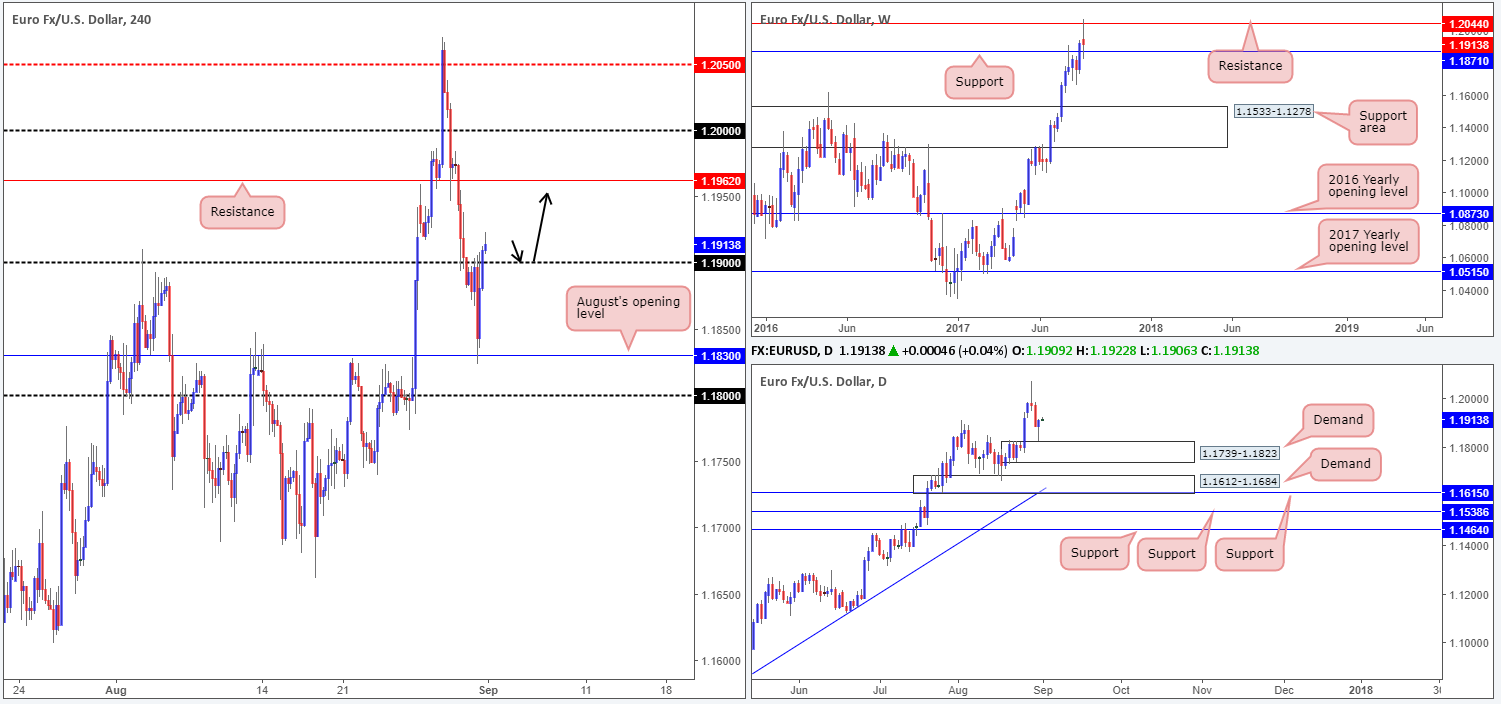
Going into the early hours of yesterday’s US segment, we can see that the single currency bottomed around August’s opening level at 1.1830. Soft US data, along with a USDX (H4) resistance at 11960 and daily supply at 11969-11938, helped lift the pair north, consequently ending the day closing beyond the 1.19 handle.
Similar to the USDX daily supply (only inverse), we also saw EUR daily demand brought into play yesterday at 1.1739-1.1823, which, as you can probably see, formed a beautiful buying tail. Also of particular interest is the weekly timeframe; price recently connected with nearby support at 1.1871.
Suggestions: In a nutshell, the structure of this pair can be boiled down to the following points:
- H4 trading above 1.19 – shows room to advance up to resistance at 1.1962.
- Daily price trading from demand (USDX from supply) – formed buying tail, and shows little resistance on the horizon.
- Weekly action trading from support – could possibly see price retest resistance at 1.2044.
Consequent to the above, we’re looking for price to retest 1.19 and hold as support today. Should this come to realization and price follows up with a full, or near-full-bodied candle, the team would consider a long, targeting 1.1962 as an initial take-profit line.
Data points to consider: US employment report at 1.30pm, US ISM manufacturing PMI at 3pm GMT+1.
Levels to watch/live orders:
- Buys: 1.19 region ([waiting for a reasonably sized H4 bullish candle to form – preferably a full, or near-full-bodied candle – is advised] stop loss: ideally beyond the candle’s tail).
- Sells: Flat (stop loss: N/A).
GBP/USD:
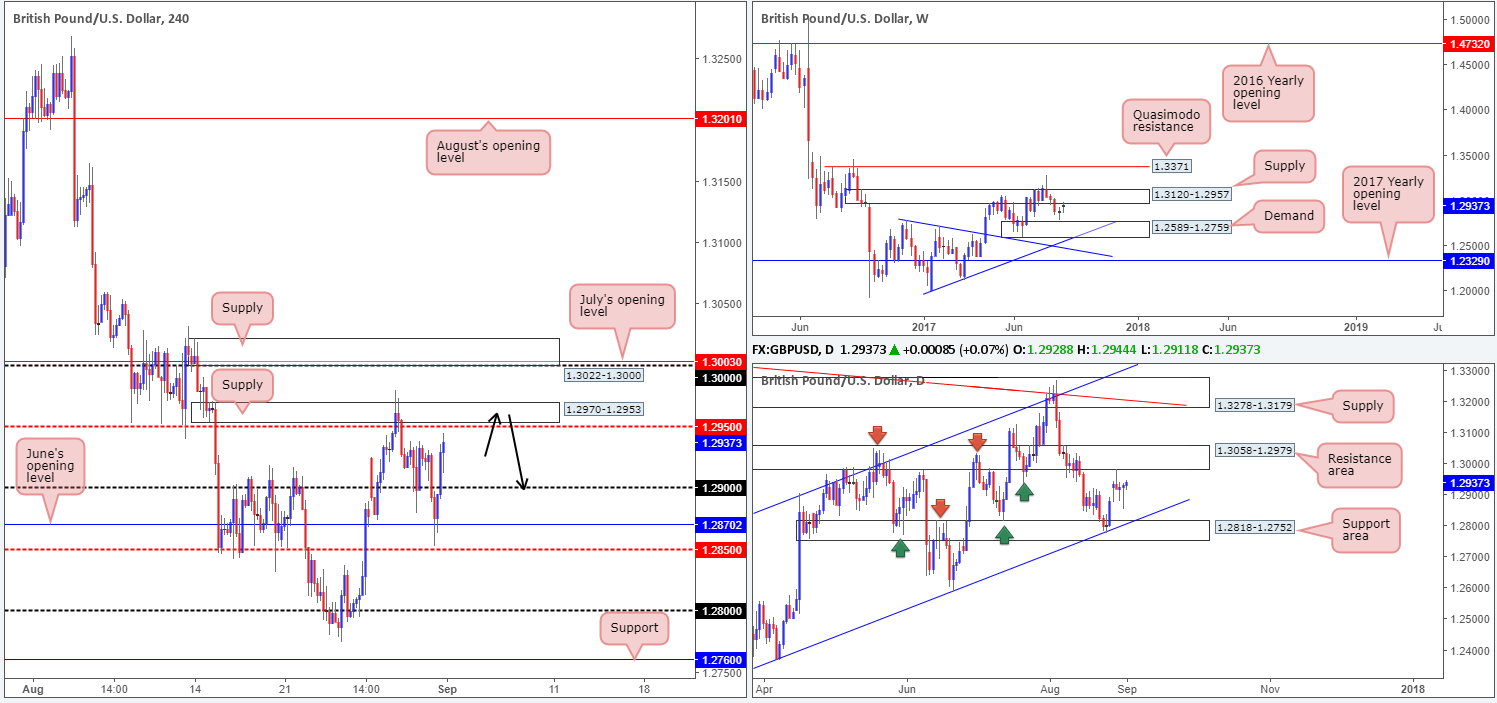
Across the board, we saw the US dollar selloff from (USDX) H4 resistance at 11960 on Thursday. This, as you can see, helped the (GBP) H4 candles recover beautifully from June’s opening level at 1.2870, with the major settling for the day just ahead of the mid-level resistance at1.2950/supply at 1.2970-1.2953.
Over on the bigger picture, weekly price is seen trading from supply pegged at 1.3120-1.2957, and daily action is seen meandering ahead of a resistance area at 1.3058-1.2979. Also noteworthy, daily price shows room to extend as far down as the support area seen at 1.2818-1.2752, which happens to intersect with a channel support taken from the low 1.2365.
Suggestions: Should H4 price challenge the aforementioned H4 supply today and chalk up a bearish candle (preferably a full, or near-full-bodied candle), a sell from this area would be valid, in our opinion.
Data points to consider: UK Manufacturing PMI at 9.30am. US employment report at 1.30pm, US ISM manufacturing PMI at 3pm GMT+1.
Levels to watch/live orders:
- Buys: Flat (stop loss: N/A).
- Sells: 1.2970-1.2953 ([waiting for a reasonably sized H4 bearish candle to form – preferably a full, or near-full-bodied candle – is advised] stop loss: ideally beyond the candle’s wick).
AUD/USD:
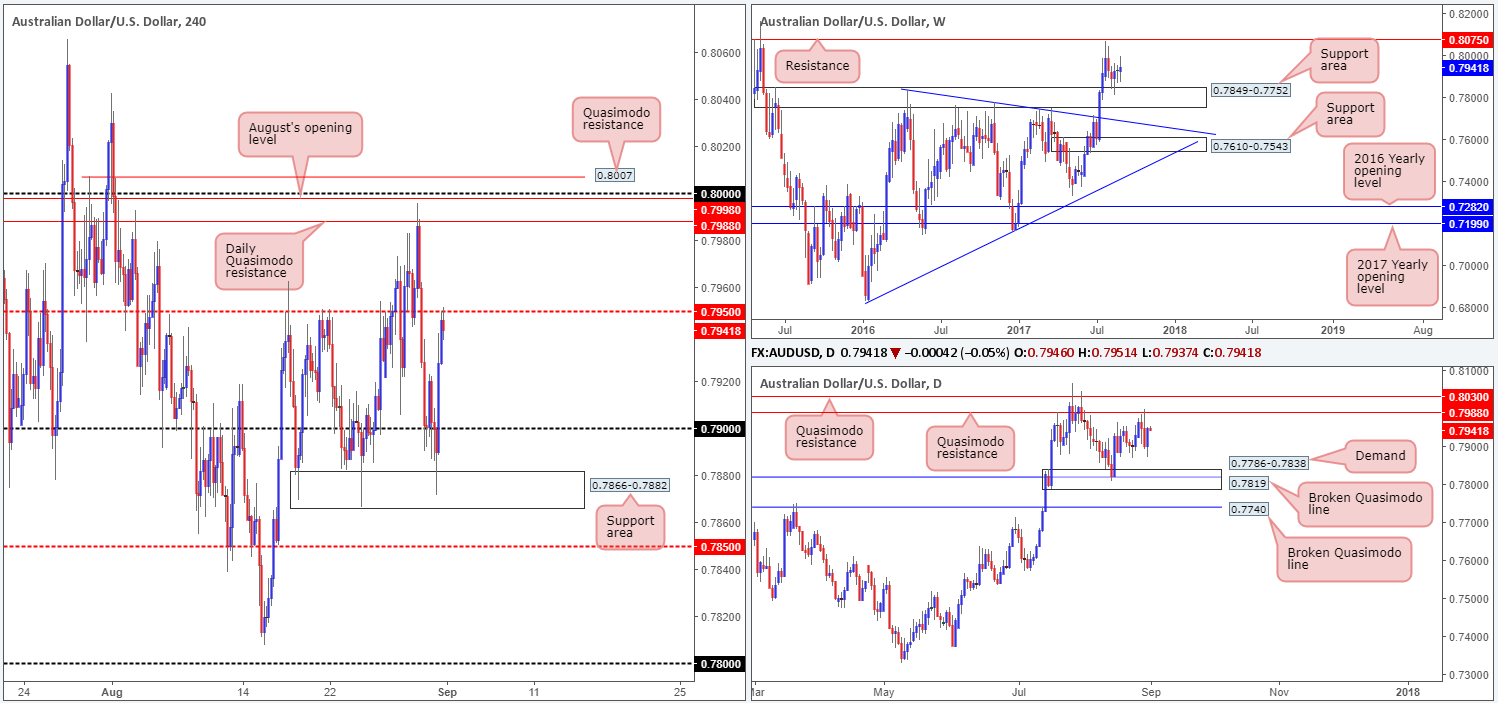
Using a top-down approach this morning, we can see that weekly price remains bolstered by the support area drawn from 0.7849-0.7752. Further buying from this region will likely bring the candles up to resistance pegged at 0.8075. The story on the daily timeframe, however, shows that upside is currently capped by a nearby Quasimodo resistance at 0.7988, followed closely by another Quasimodo resistance at 0.8030.
Bouncing over to the H4 timeframe, recent movement shows the commodity currency surpassed the 0.79 handle – tagged fresh buy orders at 0.7866-0.7882 (support area) – and then advanced (likely helped by gold’s advance) back up to the mid-level resistance at 0.7950 by the day’s end.
Suggestions: With both gold and the Aussie higher timeframe charts showing room to appreciate, we feel 0.7950 will eventually give way today. Technically speaking, a violation of 0.7950 leaves the path north free for price to challenge the daily Quasimodo resistance mentioned above at 0.7988.
With less than 40 pips of room to play with between 0.7950/0.7988, we feel a long above 0.7950 will be somewhat challenging. That is, of course, unless one is able to pin down a long with a small enough stop-loss order to accommodate sufficient risk/reward.
Data points to consider: Caixin manufacturing PMI at 2.45am. US employment report at 1.30pm, US ISM manufacturing PMI at 3pm GMT+1.
Levels to watch/live orders:
- Buys: Flat (stop loss: N/A).
- Sells: Flat (stop loss: N/A).
USD/JPY:
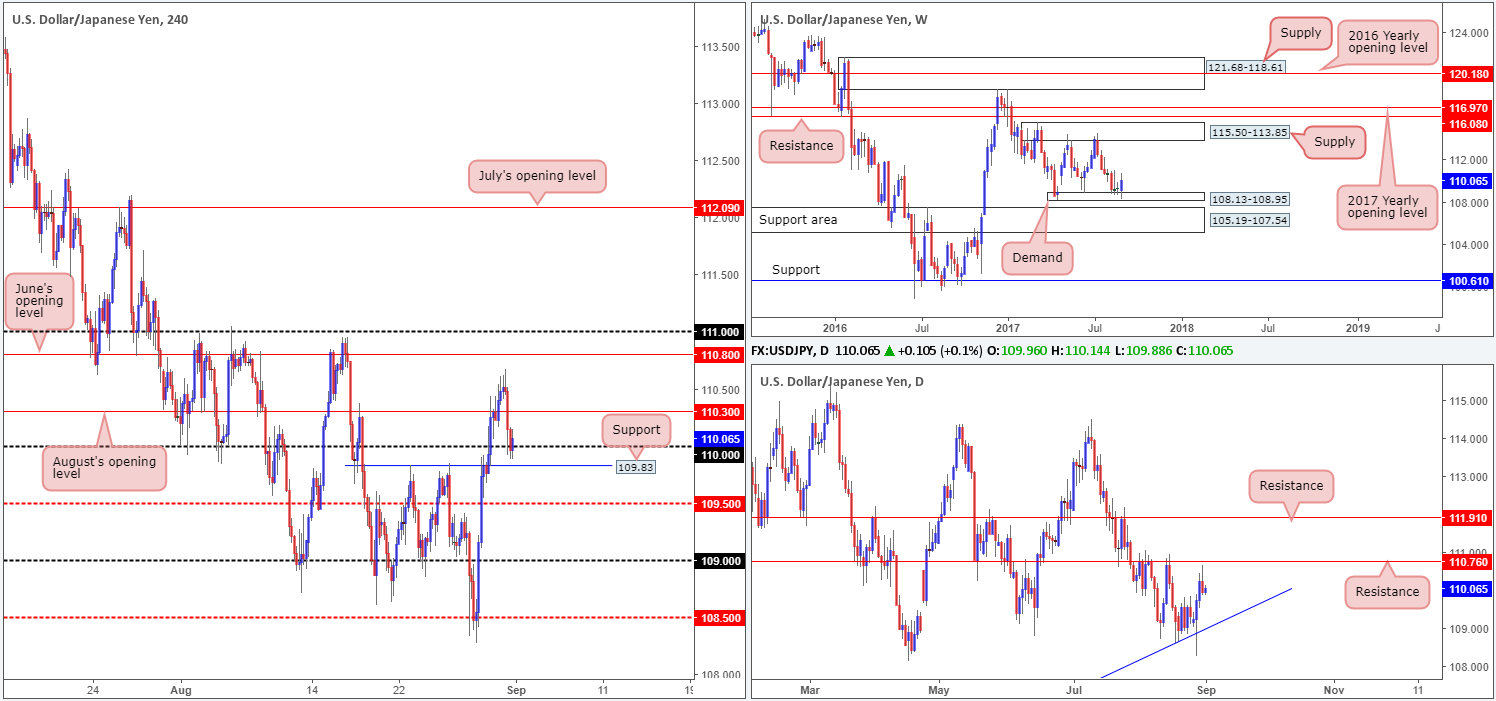
The USD/JPY slid below August’s opening level at 110.30 and attacked the 110 handle on Thursday, after topping around the 110.50 mark on Thursday. The H4 candles have yet to register anything noteworthy at 110, which could imply price may punch lower and challenge the nearby support at 109.83.
On the daily timeframe, price recently came within a few pips of testing resistance at 110.76 and sold off. In the event that the bears remain in the driving seat here, the next downside target can be seen at a trendline support extended from the low 100.08. On the other side of the coin, however, weekly price is seen trading north from a demand base coming in at 108.13-108.95.
Suggestions: To our way of seeing things, neither a long nor short seems attractive at the moment. Not only because of the conflicting signals coming from the higher timeframes, but also due to the somewhat restricted structure being seen on the H4 timeframe.
Data points to consider: US employment report at 1.30pm, US ISM manufacturing PMI at 3pm GMT+1.
Levels to watch/live orders:
- Buys: Flat (stop loss: N/A).
- Sells: Flat (stop loss: N/A).
USD/CAD:
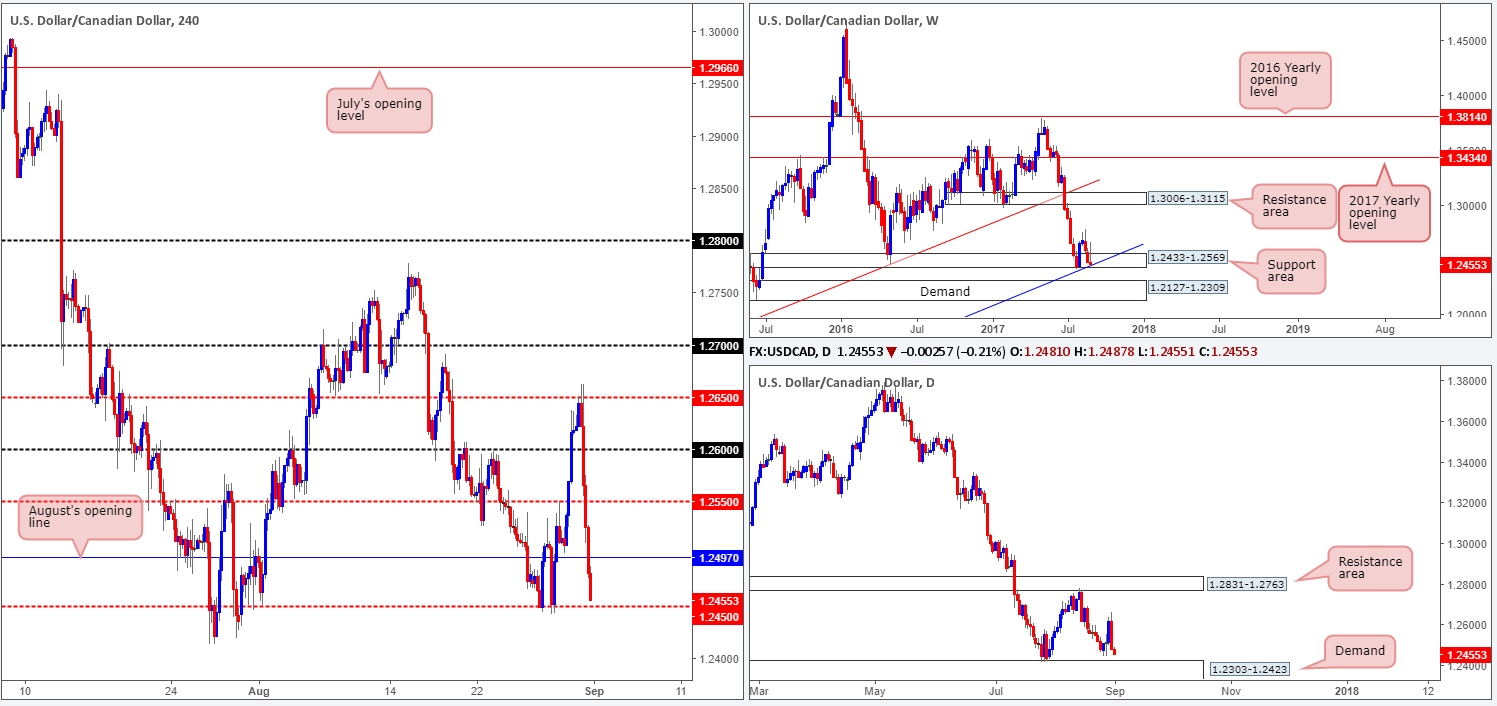
Following a strong Canadian GDP print, the USD/CAD plummeted over 100 pips lower. The 1.26 handle, the H4 mid-level support at 1.2550 and eventually August’s opening level at 1.2497 were all engulfed, leaving price free to challenge mid-level support 1.2450. Over on oil’s H4 chart, nevertheless, crude is beginning to print bearish candles from a minor H4 resistance at 47.40.
The recent move lower has placed considerable pressure on the weekly demand at 1.2433-1.2569, which fuses nicely with a trendline support etched from the low 0.9633. Traders may have also noticed that daily price is now seen trading just ahead of a demand base coming in at 1.2303-1.2423.
Suggestions: The top edge of daily demand at 1.2423 looks interesting for a long, despite this area being located beneath the aforementioned weekly support zone. Be that as it may, the underlying trend on this pair remains bearish, and buying right now would almost feel like trying to ‘catch a falling knife’. For that reason, we’re going to remain on the sidelines at least until the US job’s report is out of the way, and then look to reassess structure.
Data points to consider: US employment report at 1.30pm, US ISM manufacturing PMI at 3pm GMT+1.
Levels to watch/live orders:
- Buys: Flat (stop loss: N/A).
- Sells: Flat (stop loss: N/A).
USD/CHF:
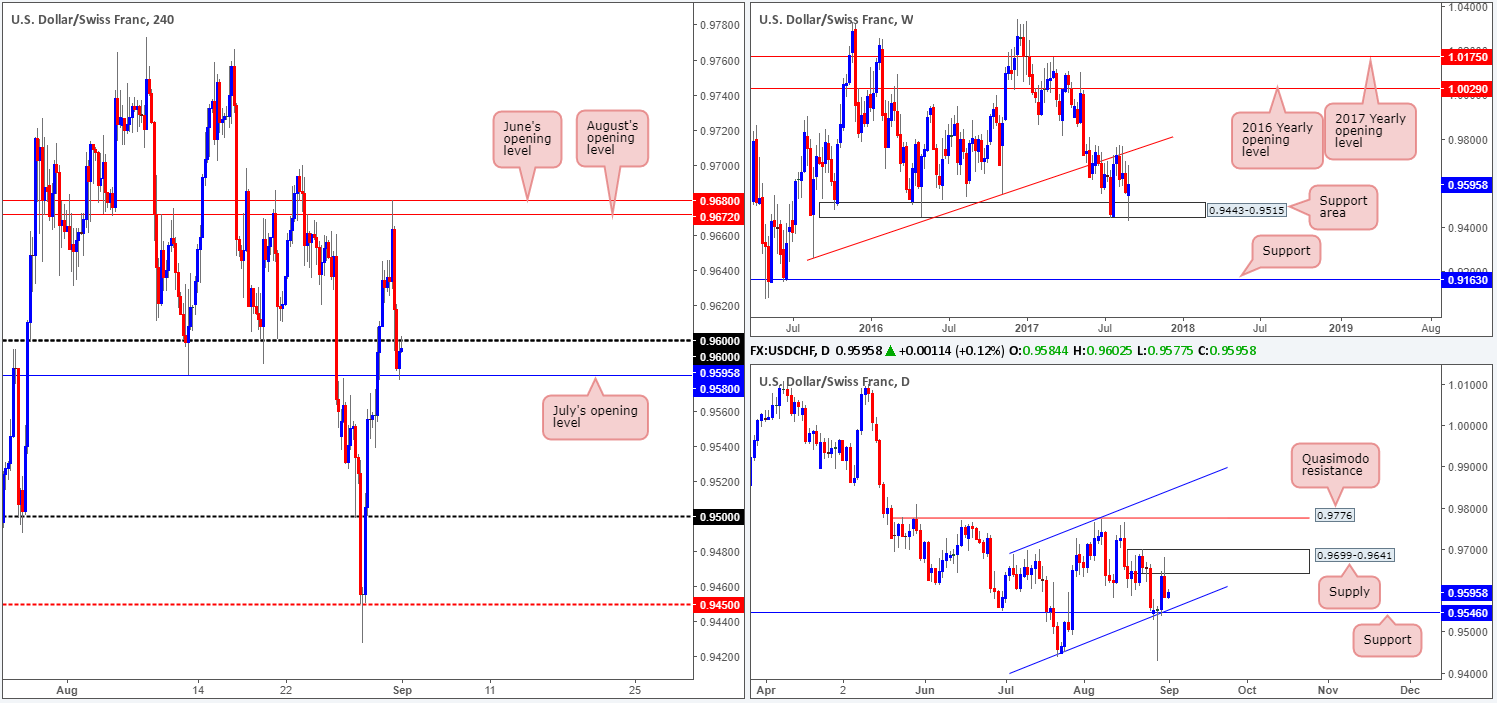
In recent trading H4 price rallied into both June/August’s opening levels at 0.9680/0.9672, which did a superb job in holding the unit lower. The downside move from these levels was aided by a rally on the EUR/USD and a hefty push lower from USDX (H4) resistance at 11960. As a result of this, the day concluded with price breaching the 0.96 handle and testing July’s opening line at 0.9580.
Another key thing to note regarding yesterday’s selloff is the daily supply at 0.9699-0.9641, and corresponding daily supply seen on the USDX at 11969-11938. Also worth mentioning on the daily chart is that the next downside target can be seen at 0.9546: a nearby support level that converges with a channel support etched from the low 0.9438. Looking up to the weekly timeframe, nonetheless, price is currently lurking mid-range between a support area at 0.9443-0.9515 and a trendline resistance extended from the low 0.9257.
Suggestions: Back on the H4 timeframe, we can see that beyond July’s opening level at 0.9580 there’s room seen for the Swissy to trade as far down as the 0.95 handle (although daily price shows that support at 0.9546 could hinder this move). Above 0.96, nevertheless, a move back up to June/August’s opening levels is also a possibility according to H4 structure. Despite this, one has to take into account that the underside of daily supply positioned at 0.9641 may come into play before the monthly levels are reached!
For that reason, if you intend on trading beyond either 0.96 or 0.9580 today, do remain cognizant of the daily structures highlighted above!
Data points to consider: US employment report at 1.30pm, US ISM manufacturing PMI at 3pm GMT+1.
Levels to watch/live orders:
- Buys: Flat (stop loss: N/A).
- Sells: Flat (stop loss: N/A).
DOW 30:
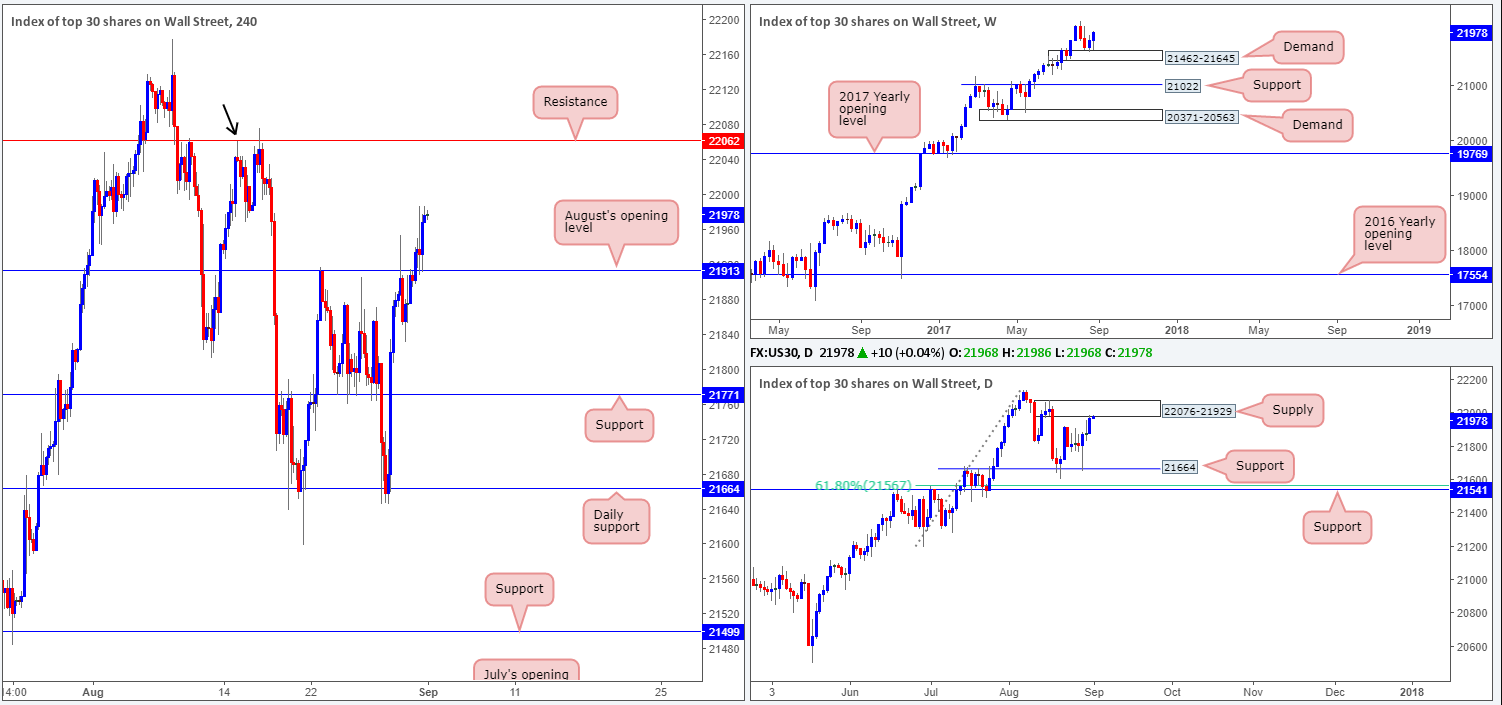
Despite finding a strong pocket of offers around August’s opening level at 21913 on Wednesday, US equities managed to close above this monthly line during yesterday’s segment and clock a high of 21987. The latest move north was likely due to weekly bulls recently making a stand from demand at 21462-21645. Providing that weekly action remains bid from here, the next port of call will likely be fresh record highs.
Although H4 action looks reasonably clear up to resistance at 22062 (also denotes a Quasimodo resistance left shoulder marked by the black arrow), daily price is seen trading from supply at 22076-21929. While this supply boasts strong momentum, let’s not forget that it has formed within an incredibly dominant uptrend. Therefore, we feel this area will eventually give way.
Our suggestions: Given the current daily supply in play, trading this market to the upside is challenging from a technical perspective. Granted, we could assume that the area will engulf due to the uptrend, but this is still extremely risky and not something we’d be willing to base a trade on. As such, we feel waiting on the sidelines, at least until after the US job’s report, may be the better route to take.
Data points to consider: US employment report at 1.30pm, US ISM manufacturing PMI at 3pm GMT+1.
Levels to watch/live orders:
- Buys: Flat (stop loss: N/A).
- Sells: Flat (stop loss: N/A).
GOLD:
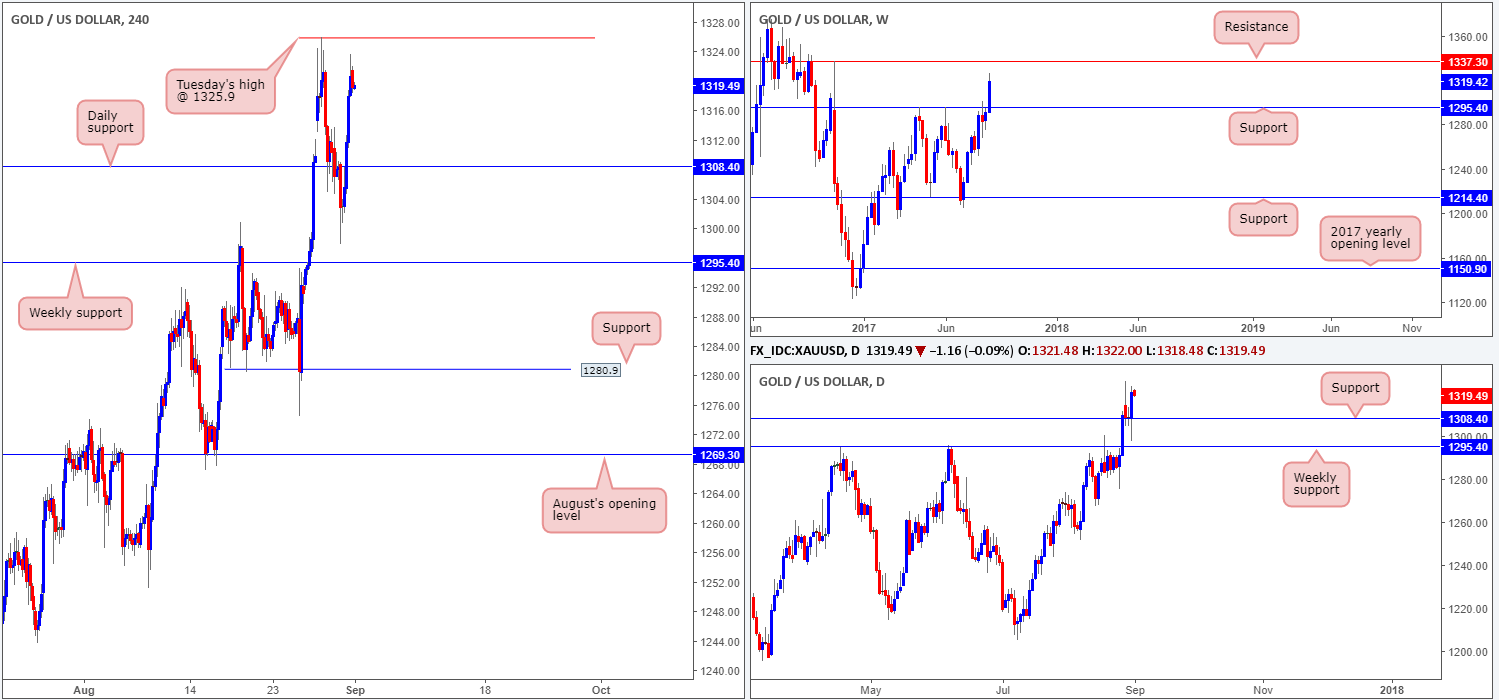
Given the broad-based dollar selloff against the majority of its major trading peers yesterday, the price of gold increased in value. At this stage, the odds of weekly price continuing to advance north to shake hands with resistance at 1337.3 is quite high, in our opinion. Adding weight to this theory, we can see that price recently rebounded from a daily support coming in at 1308.4.
Still, before we’re confident of gold’s direction, we’d need to see Tuesday’s high at 1325.9 taken out on the H4 timeframe. This, as far as we can see, is the last major obstacle stopping price from gravitating north.
Our suggestions: A H4 close above Tuesday’s high, followed up with a retest and a H4 bullish candle in the shape of either a full, or near-full-bodied bullish candle would, in our view, be enough to validate a long, targeting the weekly resistance mentioned above at 1337.3.
Levels to watch/live orders:
- Buys: Watch for H4 price to engulf 1325.9 and then look to trade any retest seen thereafter ([waiting for a reasonably sized H4 bull candle to form following the retest is advised] stop loss: ideally beyond the candle’s tail).
- Sells: Flat (stop loss: N/A).


