
A note on lower timeframe confirming price action…
Waiting for lower timeframe confirmation is our main tool to confirm strength within higher timeframe zones, and has really been the key to our trading success. It takes a little time to understand the subtle nuances, however, as each trade is never the same, but once you master the rhythm so to speak, you will be saved from countless unnecessary losing trades. The following is a list of what we look for:
- A break/retest of supply or demand dependent on which way you’re trading.
- A trendline break/retest.
- Buying/selling tails – essentially we look for a cluster of very obvious spikes off of lower timeframe support and resistance levels within the higher timeframe zone.
- Candlestick patterns. We tend to only stick with pin bars and engulfing bars as these have proven to be the most effective.
For us, lower timeframe confirmation starts on the M15 and finishes up on the H1, since most of our higher timeframe areas begin with the H4. Stops usually placed 5-10 pips beyond your confirming structures.
EUR/USD:
Reporting from the weekly timeframe this morning, it’s quite clear to see that the EUR is once again hugging the underside of a major area of supply drawn from 1.1533-1.1278. This base, as you can probably see, has held this pair lower since May 2015 so it is certainly an area we hold in respect. Along the same vein, daily action, thanks to another round of buying yesterday, has also recently connected with a daily supply seen at 1.1385-1.1332 (located just within the above said weekly area).
Stepping across to the H4 chart, the single currency ended yesterday’s bullish assault tapping into offers around a H4 Quasimodo resistance level penciled in at 1.1338. This hurdle, along with the 1.1300 figure below, was a zone we highlighted in our previous report to watch for potential shorts. Based on recent candle action above the 1.1300 number, however, our team will only consider selling this market here when or indeed if price closes below and retests the 1.1300 level as resistance. Not only would this give one a sell signal, but what it also does is open the doors to your first take-profit target at 1.1204-1.1222 – a H4 demand zone, and at the same time confirms selling strength from the higher-timeframe supplies mentioned above.
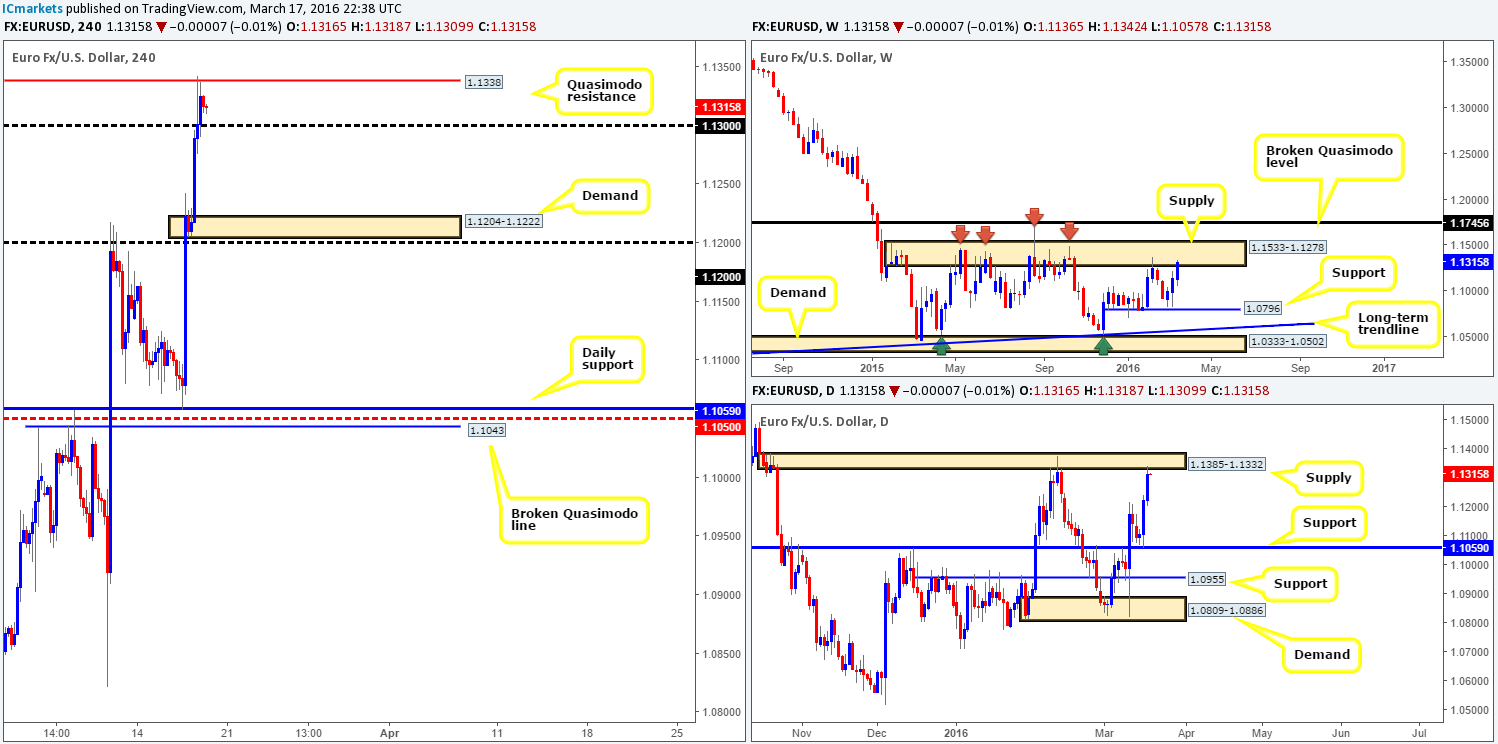
Levels to watch/live orders:
- Buys: Flat (Stop loss: N/A).
- Sells: Watch for price to consume 1.1300 and look to trade any retest seen thereafter (lower timeframe confirmation required).
GBP/USD:
The GBP/USD pair launched yet another bullish attack during the course of yesterday’s sessions, following on from Wednesday’s Fed-induced rally. Consequent to this, several H4 resistances were consumed with price ending the day topping out at the 1.4500 mark. The big question for us now is how long can the buyers sustain this momentum?
According to both the weekly and daily charts, it seems space is still available for the bulls to stretch their legs. Weekly resistance does not come into the picture until 1.4633, whilst daily resistance is not seen until the 1.4565 mark. With that being the case, the most we’re expecting price to retrace from 1.4500 today is the mid-level support 1.4450 give or take a few pips.
Given the points made above, here is what we have jotted down for today’s upcoming sessions:
- Buying on the break/retest of 1.4500 is certainly a possibility for an intraday trade today. However, we would not be expecting much more than the 1.4550/1.4600 region on this one. Reason being is by that point we’re entering into higher-timeframe resistance territory (see above).
- In regard to sells, between the 1.4550/1.4600 area seems a reasonable zone to look to short since in between here sits daily resistance at 1.4565. Nevertheless, we would advise waiting for the lower timeframes to confirm selling strength due to a H4 Quasimodo resistance level lurking above at 1.4649, which fuses nicely with the weekly resistance line at 1.4633 (a potential level to short at market).
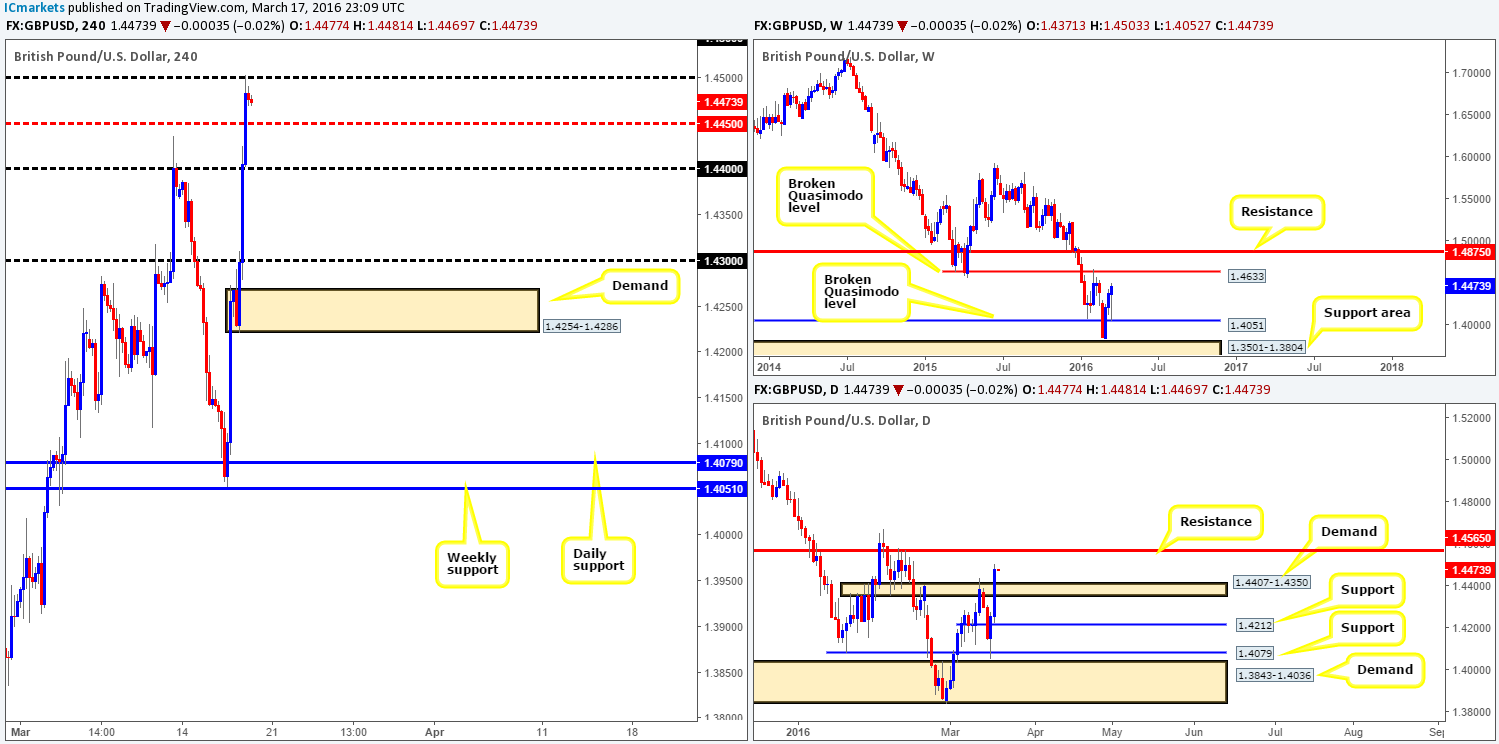
Levels to watch/live orders:
- Buys: Watch for price to consume the 1.4500 level and look to trade any retest seen thereafter (Lower timeframe confirmation required).
- Sells: 1.4550/1.4600 [Tentative – confirmation required] (Stop loss: dependent on where one confirms this area). 1.4649 [Tentative – confirmation required] (Stop loss: dependent on where one confirms this level).
AUD/USD:
Using a top-down approach this morning, the weekly chart shows that price recently pushed above resistance at 0.7604 and is, at the time of writing, now tackling the 61.8% Fibonacci level just above it at 0.7647. Seeing as how it’s the last day of the trading week, it may be worth waiting for the weekly candle to close up shop before presuming that this weekly resistance level is consumed. In addition to this Fibonacci level, there’s also a nice-looking daily supply area hovering just above at 0.7738-0.7678 which could potentially halt buying. Jumping across to the H4 chart, it’s no surprise to see the commodity currency teasing the mid-level resistance 0.7650 right now, since it converges beautifully with the 61.8% weekly Fibonacci level mentioned above.
Despite the recent buying on this pair, based on the above points we have no interest in looking to long this market today. Concerning shorts, judging by the recent H4 candle action around 0.7650 it’s very difficult for us to get excited about this level as short-term bulls seem to be in control for the time being. The only other area that looks appealing for a sell is the H4 supply zone coming in at 0.7738-0.7712, which is housed within the extremes of the aforementioned daily supply area. We also like the fact that the 0.7700 figure is positioned directly below this barrier, since this will provide extra liquidity (stops above this number) for well-funded traders to short from the H4 supply zone. With everything taken into consideration we would look to short this area at market with the expectation that this recent move higher was just one big fakeout above the aforementioned weekly resistance line.
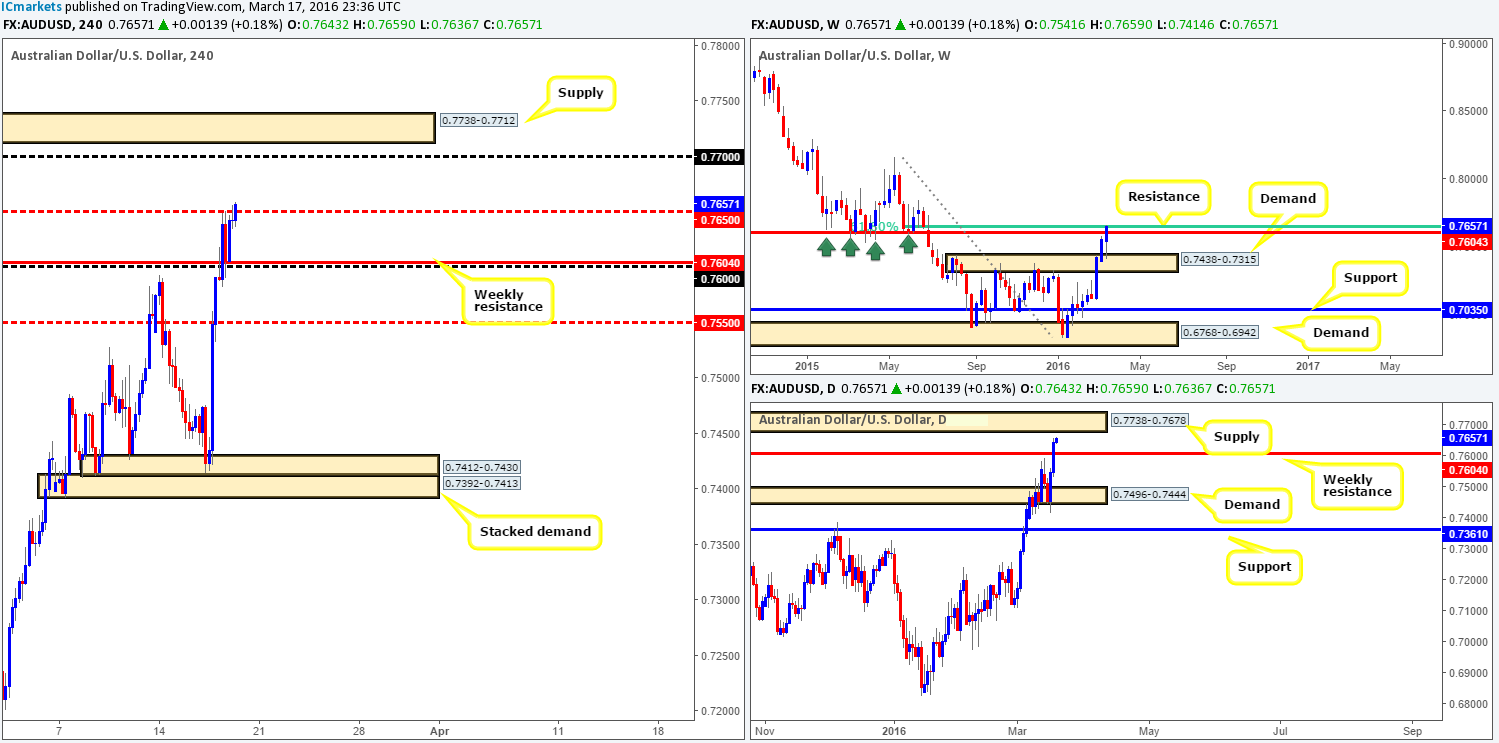
Levels to watch/live orders:
- Buys: Flat (Stop loss: N/A).
- Sells: 0.7708 (Stop loss: 0.7743).
USD/JPY:
For those who read the previous report on the USD/JPY (http://www.icmarkets.com/blog/thursday-17th-march-keep-a-close-eye-on-the-gbp-midday-today-volatility-expected/) you may recall that we spoke about watching for price to close below and retest 112.00 for a short down to 111.00. As you can see, the move did play out, but the pair unfortunately failed to retest 112.00 before hitting its target support – 111.00.
Now, seeing as price is responding relatively well from the 111.00 number right now, where do we see this market headed today? Well, with the weekly showing room to move lower towards support at 110.09, it seems a good bet to be looking to short this unit. Be that as it may, down on the daily chart we can see that price is now tackling the 110.96 support region (the Feb 11th low), following a breakout from an area of congestion (112.56/113.96). In view of this, the most logical path we see today is to look for shorts on the break/retest of 111.00, targeting the weekly support mentioned above at 110.09.
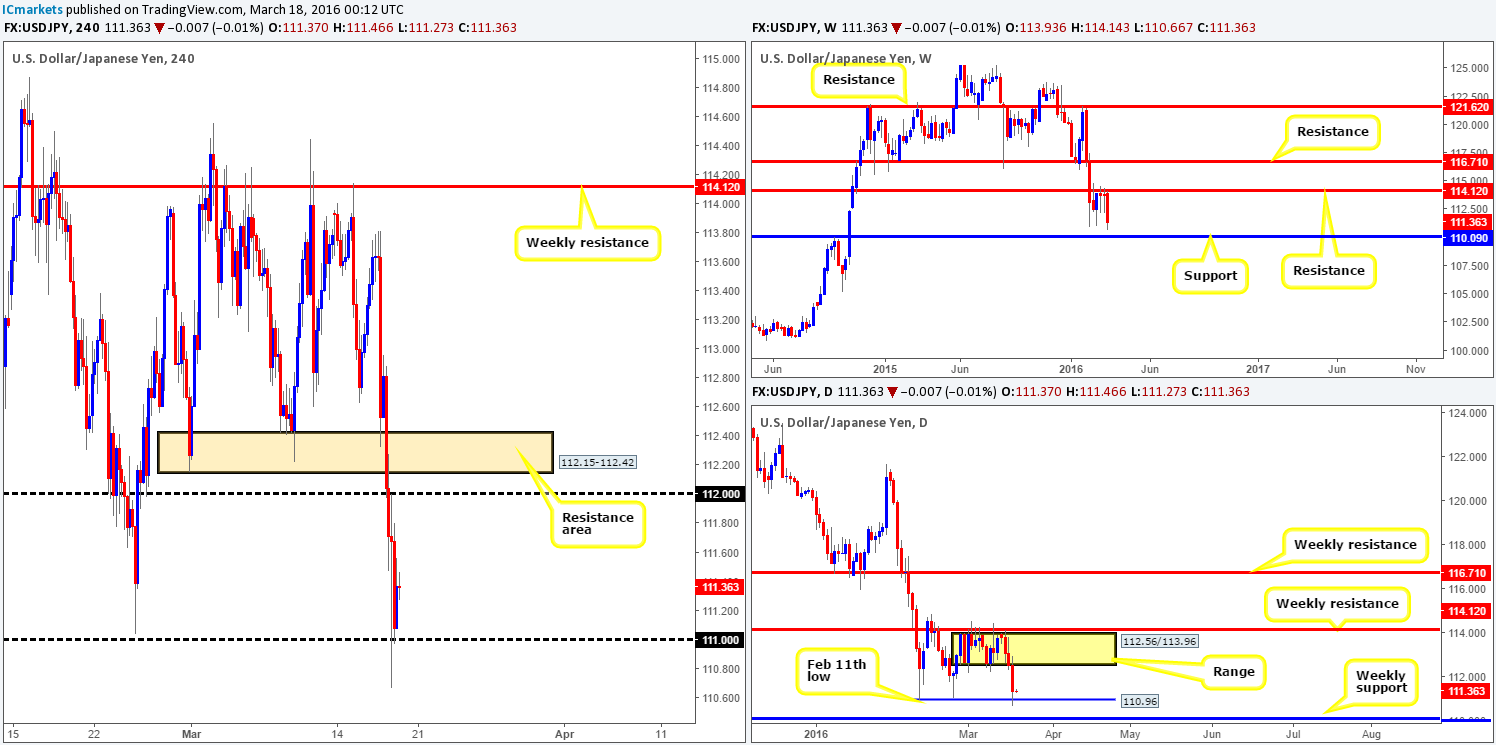
Levels to watch/live orders:
- Buys: Flat (Stop loss: N/A).
- Sells: Watch for price to consume the 111.00 level and look to trade any retest seen thereafter (Lower timeframe confirmation required).
USD/CAD:
Yesterday’s European open saw the U.S. dollar resume its decline against the Canadian dollar, forcing prices below H4 Quasimodo support at 1.3055 and into the jaws of H4 demand at 1.2935-1.2985. So far, buying from this area has been limited to the 1.3015 region, thus suggesting the offers outweigh bids at this point. Looking across to the higher-timeframe picture, weekly price shows room to continue driving lower towards support at 1.2833, whilst the next support to come in view on the daily chart is 1.2900 – a Quasimodo line.
Owing to this, there is a very good chance that price will fake below the current H4 demand to the 1.2900 handle for a possible long entry today. Ideally, we would feel much more comfortable entering long from 1.2900 alongside a lower timeframe setup since let’s not forget that the weekly timeframe shows room to run down to 1.2833. In the event that a trade setup from 1.2900 comes to fruition today, the first take-profit area will be dependent on how price approaches our buy level.
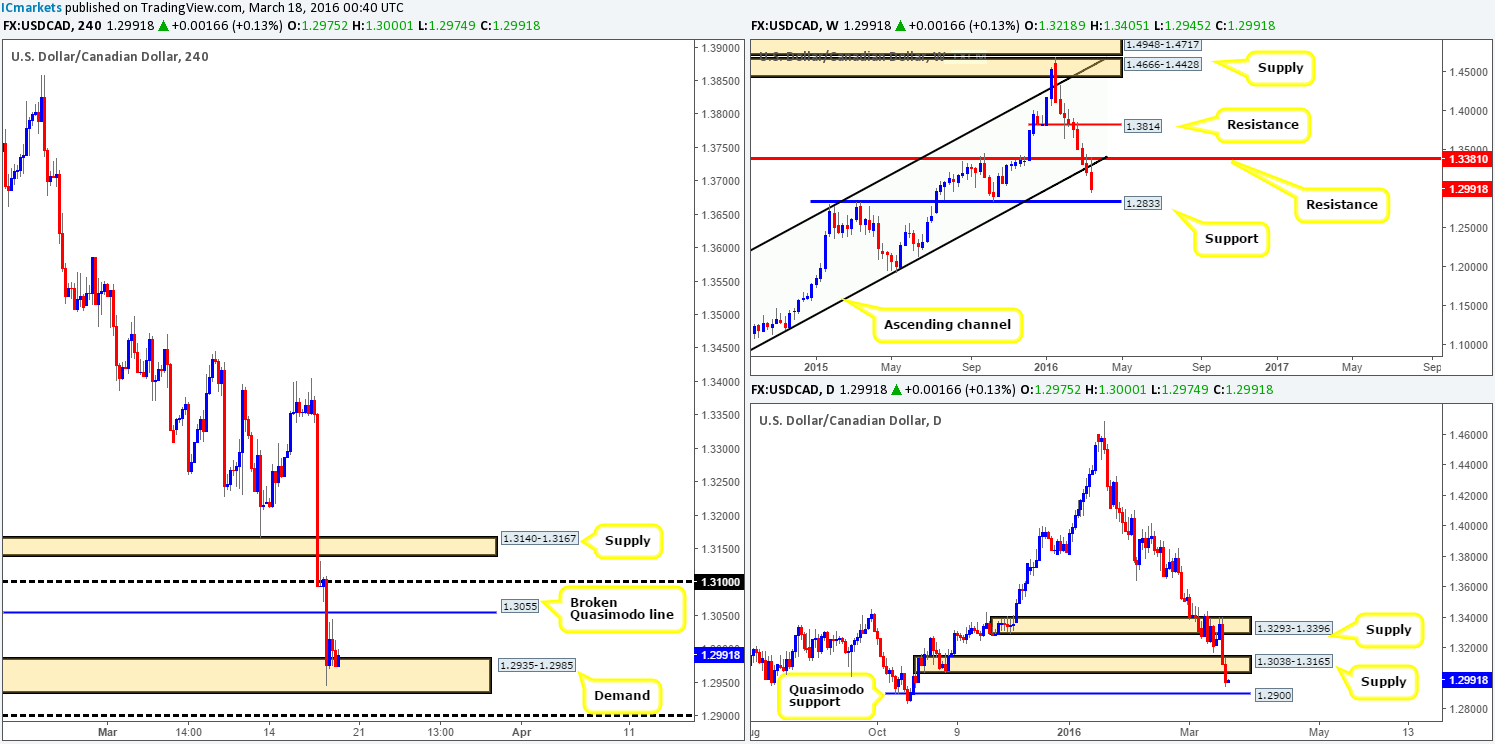
Levels to watch/live orders:
- Buys: 1.2900 [Tentative – confirmation required] (Stop loss: dependent on where one confirms this level).
- Sells: Flat (Stop loss: N/A).
USD/CHF:
Kicking off our analysis with a quick look at the weekly chart shows that the current candle is trading quite a distance below trendline support extended from the low 0.9071, due to price dropping lower yesterday. On the assumption that the bears continue to hold this market lower, this would likely place the Quasimodo support at 0.9526 in the firing range.
With the above in mind, the H4 broken Quasimodo line at 0.9694 looks like an ideal place to be looking for shorts today (lower timeframe confirmation required), targeting the H4 demand chalked up at 0.9579-0.9611, followed closely by the weekly Quasimodo 0.9526.
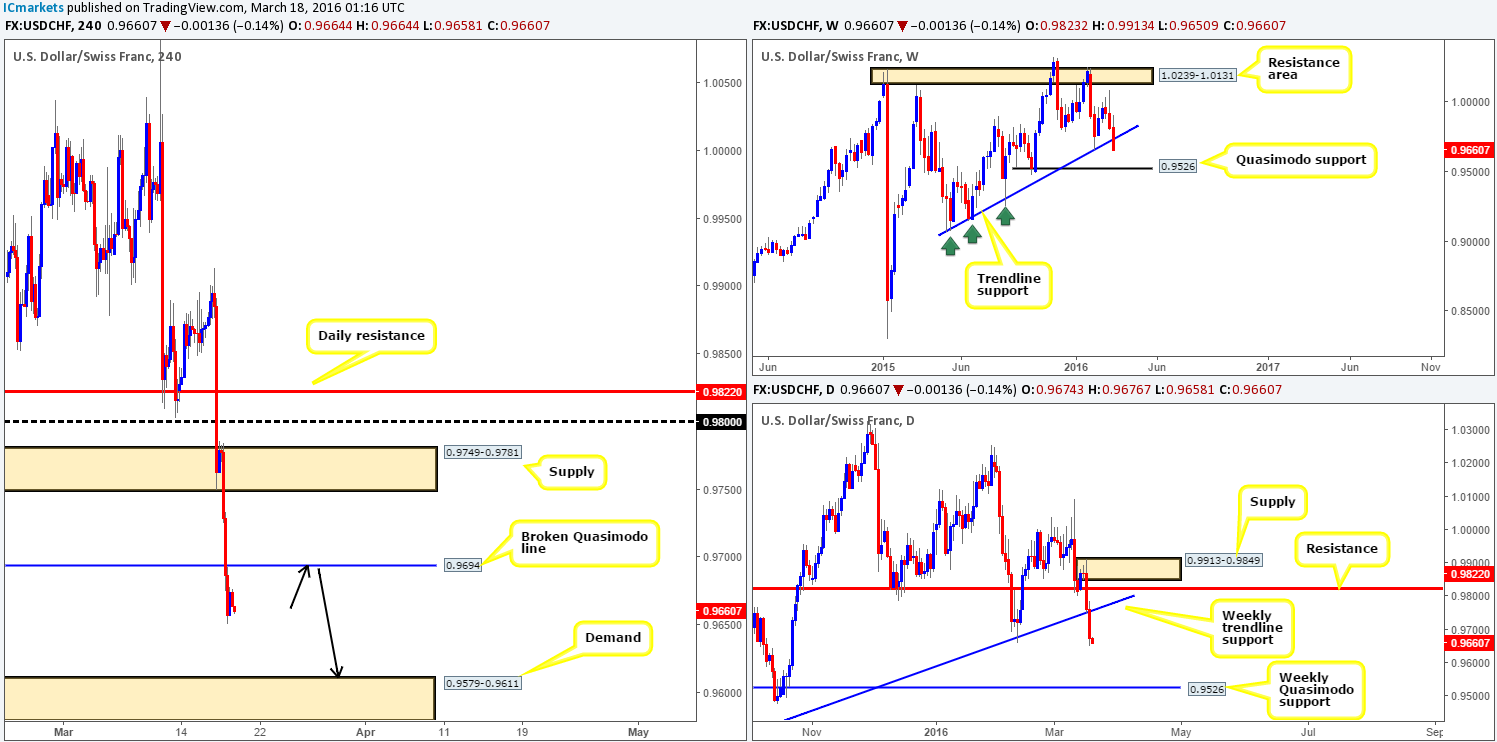
Levels to watch/live orders:
- Buys: Flat (Stop loss: N/A).
- Sells: 0.9694 region [Tentative – confirmation required] (Stop loss: dependent on where one confirms this area).
DOW 30:
From the weekly timeframe, one can see that the DOW recently collided with weekly supply coming in at 17752-17552, which ties in nicely with trendline resistance from the high 18365. Could this area be strong enough to suppress further buying in this market?
Climbing down into the daily picture, a bearish selling wick has already begun printing from the underside of the above said weekly supply zone. In the event that the bears step it up here today/next week, we’ll be eyeing the weekly support barrier at 17135 as the next limit to achieve.
Now, cast your minds back to Thursday’s report (http://www.icmarkets.com/blog/thursday-17th-march-keep-a-close-eye-on-the-gbp-midday-today-volatility-expected/) where we highlighted that both the H4 support level at 17275 and H4 demand at 17186-17226 would be ideal places to enter long from. As shown on the H4 chart, price tapped the support level and bounced beautifully to the upside, reaching the H4 supply area at 17606-17538 by the day’s end. Well done to any of our readers who took advantage of this move yesterday!
Going forward, all three timeframes show this index is overbought in our book. This opens up the possibility to a sell trade from the aforementioned H4 supply zone. However, seeing as how price has already violently reacted from this area, we’ll have to resort to waiting for the lower timeframes to print a sell setup to join in any selling that may be seen. A retracement back up to within the current H4 zone would be ideal, with the 17275 level in mind as a first take-profit target.
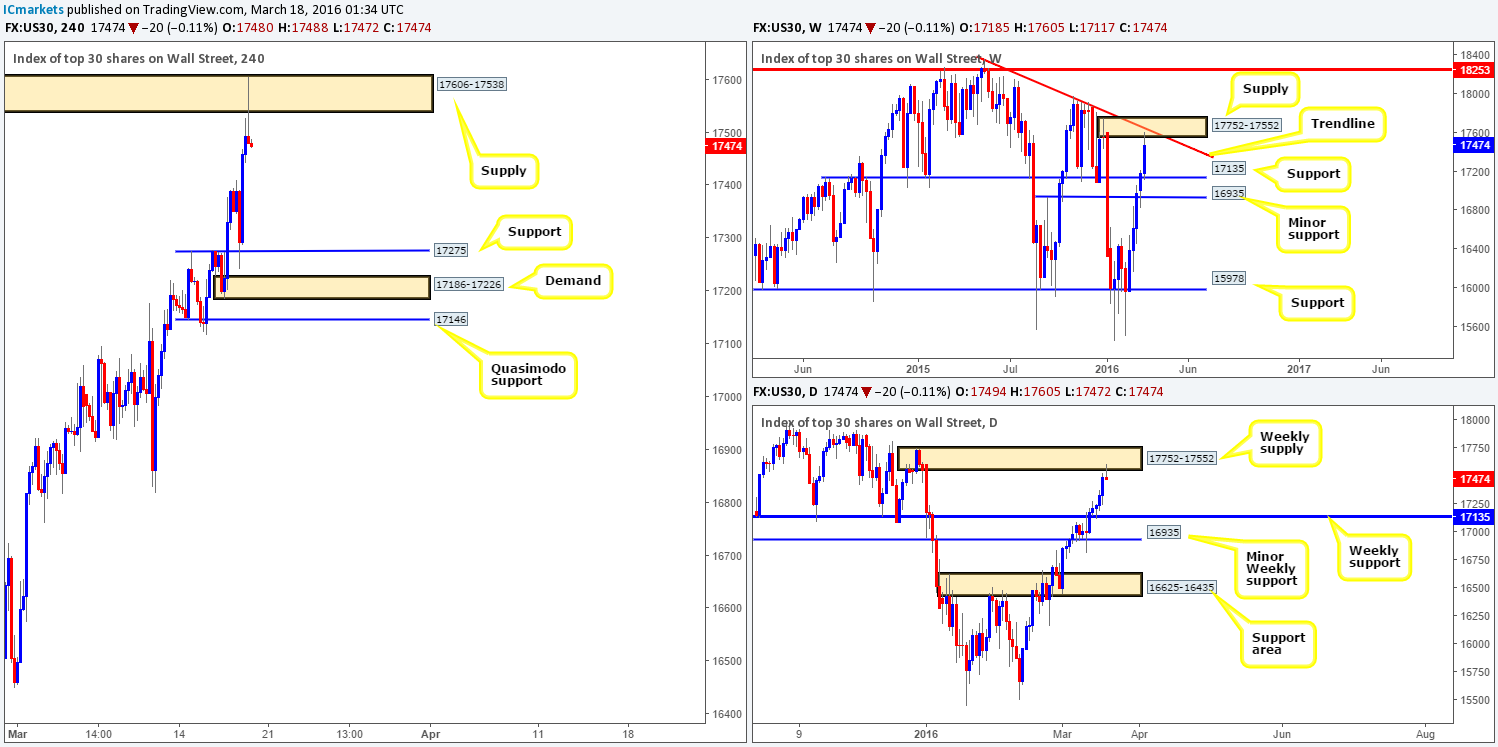
Levels to watch/live orders:
- Buys: Flat (Stop loss: N/A).
- Sells: 17606-17538 [Tentative – confirmation required] (Stop loss: dependent on where one confirms this area).
XAU/USD: (Gold)
In our previous report on Gold (http://www.icmarkets.com/blog/thursday-17th-march-keep-a-close-eye-on-the-gbp-midday-today-volatility-expected/) we mentioned that we were looking for the yellow metal to retest the recently broken H4 resistance level at 1256.2 as support. Price clearly did as we expected but unfortunately we have been unable to pin down a lower timeframe buy setup as of yet. Well done to any of our readers who are currently long this market, since price is likely headed for the H4 supply zone drawn from 1285.5-1278.5 (positioned within the weekly supply area at 1307.4-1280.0).
Aside from a clear run north being seen in this market at the moment, we also have our eyes on shorting from the above said H4 supply area, more specifically, the H4 Quasimodo resistance level at 1279.6. Not only does this level and its surrounding H4 supply converge with weekly supply as we just mentioned above, but it also encapsulates the daily resistance hurdle penciled in at 1283.4. As a result, a market entry at 1279.6 with a stop above the H4 supply at 1286.8 could, depending on the time of day, be something to consider here.
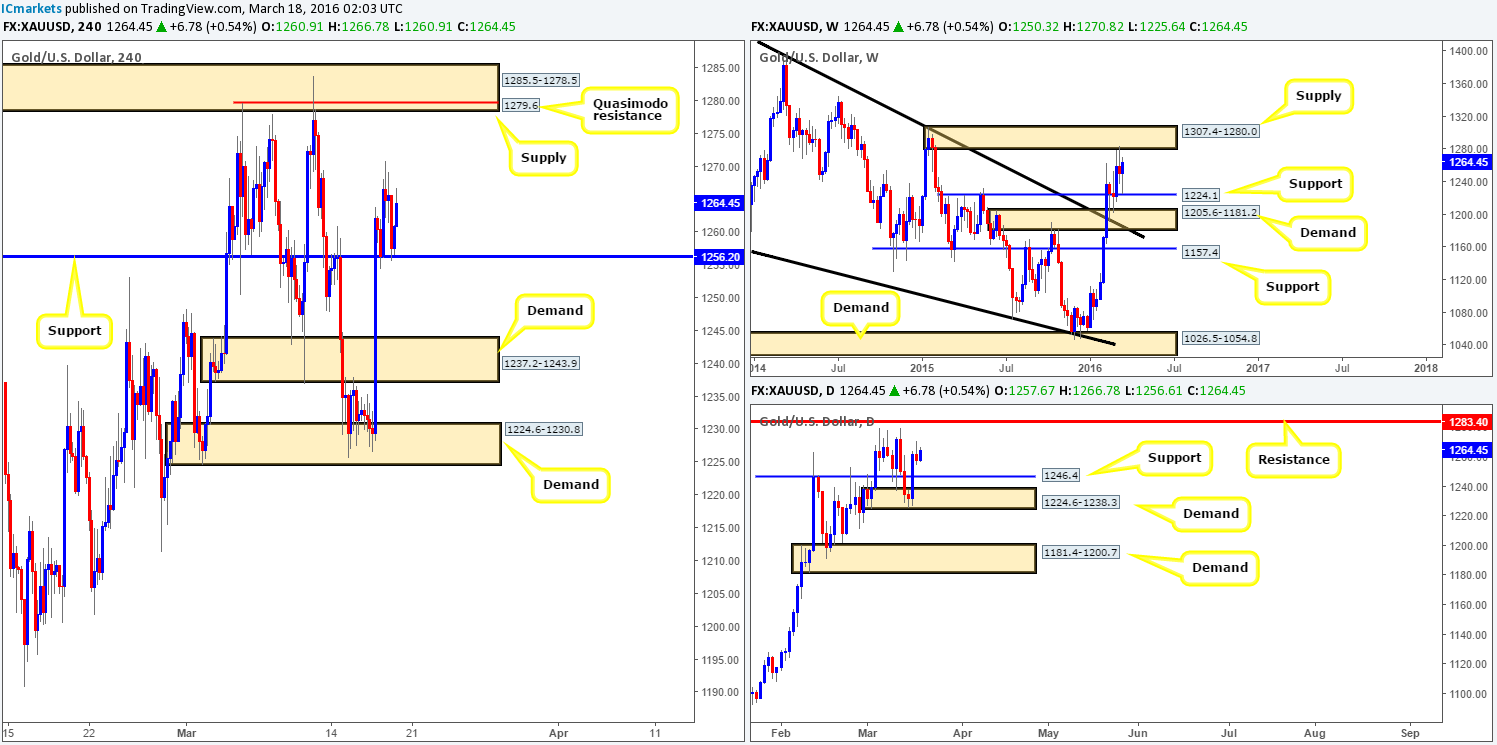
Levels to watch/live orders:
- Buys: Flat (Stop loss: N/A).
- Sells: 1279.6 (Stop loss: 1286.8).


