
Lower timeframe confirmation: is something we use a lot in our analysis. All it simply means is waiting for price action on the lower timeframes to confirm direction within a higher timeframe area. For example, some traders will not enter a trade until an opposing supply or demand area has been consumed, while on the other hand, another group of traders may only need a trendline break to confirm direction. As you can probably imagine, the list is endless. We, however, personally prefer to use the two methods of confirmation mentioned above in our trading.
EURUSD:
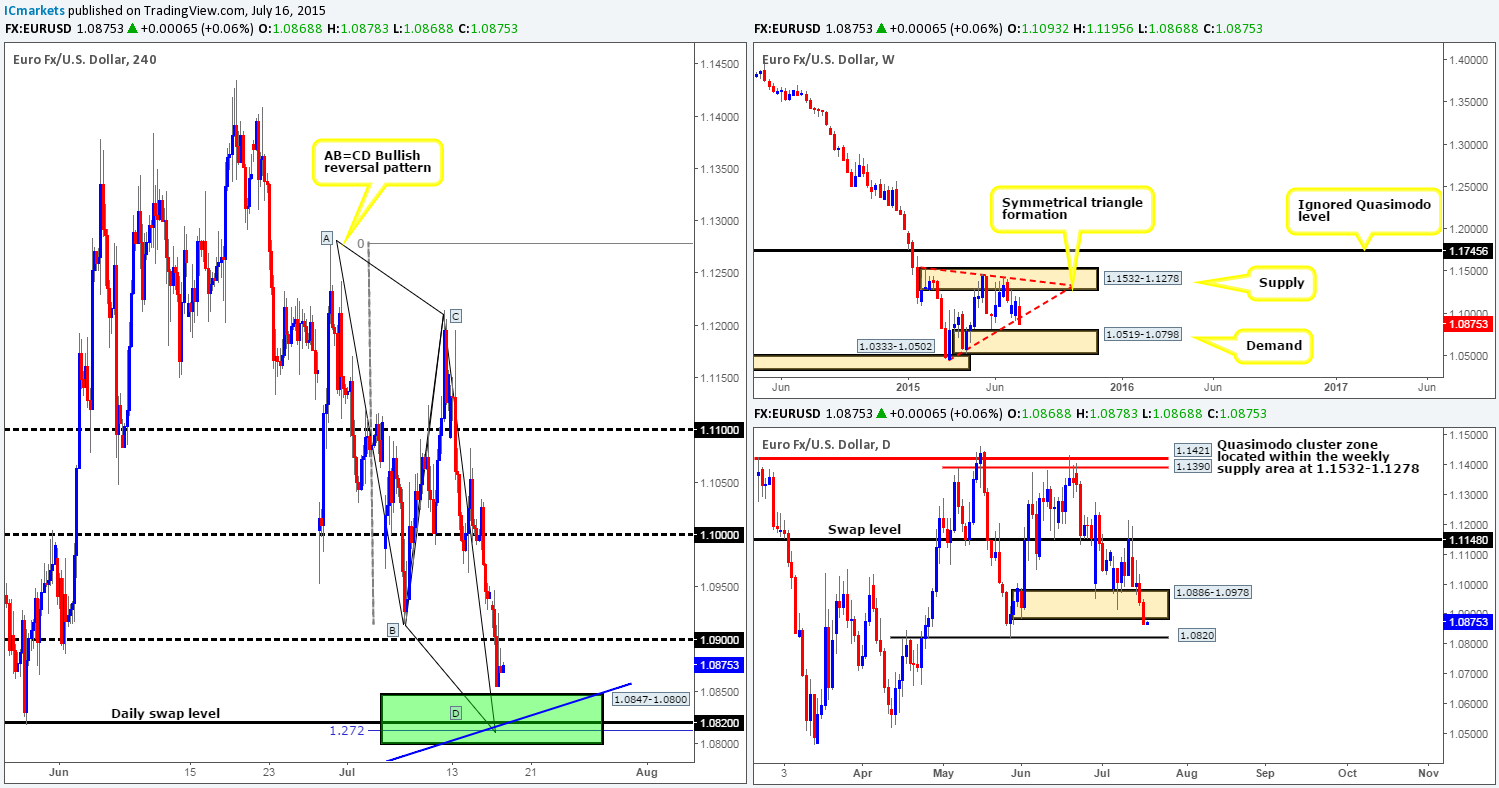
Focus from the Greek debt situation may well be fading on the EUR/USD as price continued to plunge even though Greece appears to have finally reached a deal with its creditors. During this sell-off, the round number 1.0900 was broken/retested and is currently seen holding firm at 1.0875 – just above a 4hr Harmonic AB=CD bullish pattern at 1.0847-1.0800. We know that the Euro has been plummeting for most of the week, but this beauty is just too good to miss as this AB=CD pattern converges with some very interesting structure:
- Encapsulates the daily swap level 1.0820.
- The lower limit of our AB=CD pattern has been expanded slightly to include the 1.0800 round number which also represents the top-side of a weekly demand area at 1.0519-1.0798.
- 4hr trendline convergence from the low 1.0461.
- Fibonacci extension value 1.272%.
However, seeing as how it is the last trading day of the week, and rumors could still flood the wire regarding Greece, we are not going to place a pending buy order at the AB=CD Harmonic base even though we think a bounce at the very least will be seen. Instead, we’re going to patiently watch lower timeframe price action once/if price reaches our area, and only enter should buying strength be seen.
Levels to watch/live orders:
- Buys: 1.0847/1.0800 [Tentative – confirmation required] (Stop loss: 1.0785).
- Sells: Flat (Stop loss: N/A).
GBP/USD:
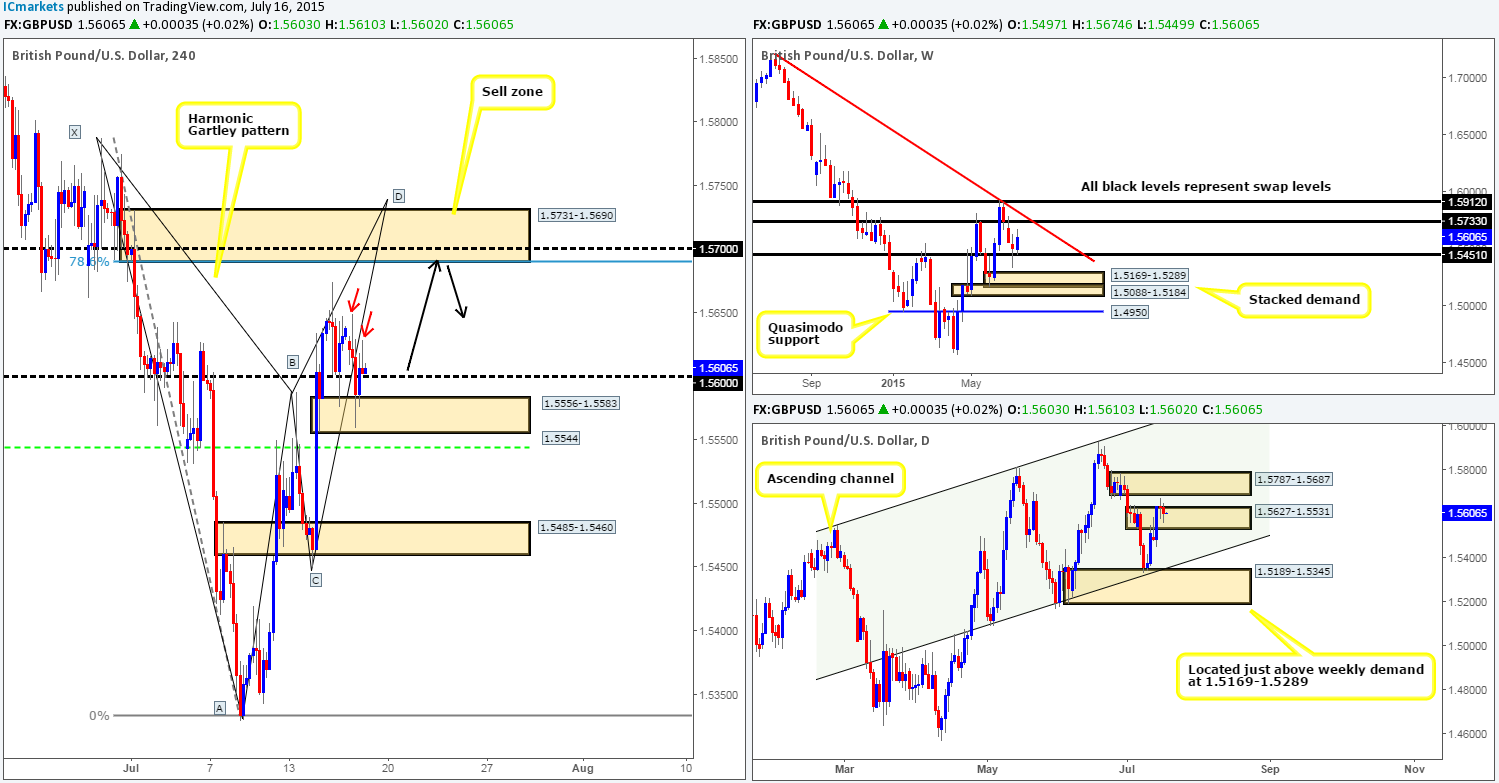
Recent events in the Pound Sterling market show that 1.5600 failed to hold, resulting in price dropping lower to connect up with bids sitting around a small 4hr demand zone coming in at 1.5556-1.5583. From here, the buyers have actually managed to push price back above 1.5600, which at the time of writing, seems to be holding.
Considering both the location of price on the higher timeframe picture (trading from a weekly swap level at 1.5451/ trading within a daily swap area at 1.5627-1.5531), and the possibility that local supply is already consumed above current prices (check out the supply consumption wicks seen marked with red arrows: 1.5628/1.5649), we believe there is a good chance the GBP may rally from 1.5600 today up to the 4hr supply area at 1.5731-1.5690. As you can probably see, this area of supply converges with the following structures:
- Bearish Harmonic Gartley pattern which completes just above this 4hr supply area at 1.5739.
- Located very close to the weekly swap level at 1.5733.
- Positioned nicely within daily supply coming in at 1.5787-1.5687.
- Round number resistance seen at 1.5700.
Given all of the points made above, our plan of attack for this pair today is as follows:
- Watch for lower timeframe buying confirmation around 1.5600. If found, look to target 1.5690.
- If the above does come to fruition, we then intend to sell from 1.5686 (pending sell order already placed) with a stop just above the high 1.5774 at 1.5778.
Levels to watch/ live orders:
- Buys: 1.5600 [Tentative – confirmation required (Stop loss: dependent on where one confirms this level).
- Sells: 1.5686 (Stop loss: 1.5778).
AUD/USD:
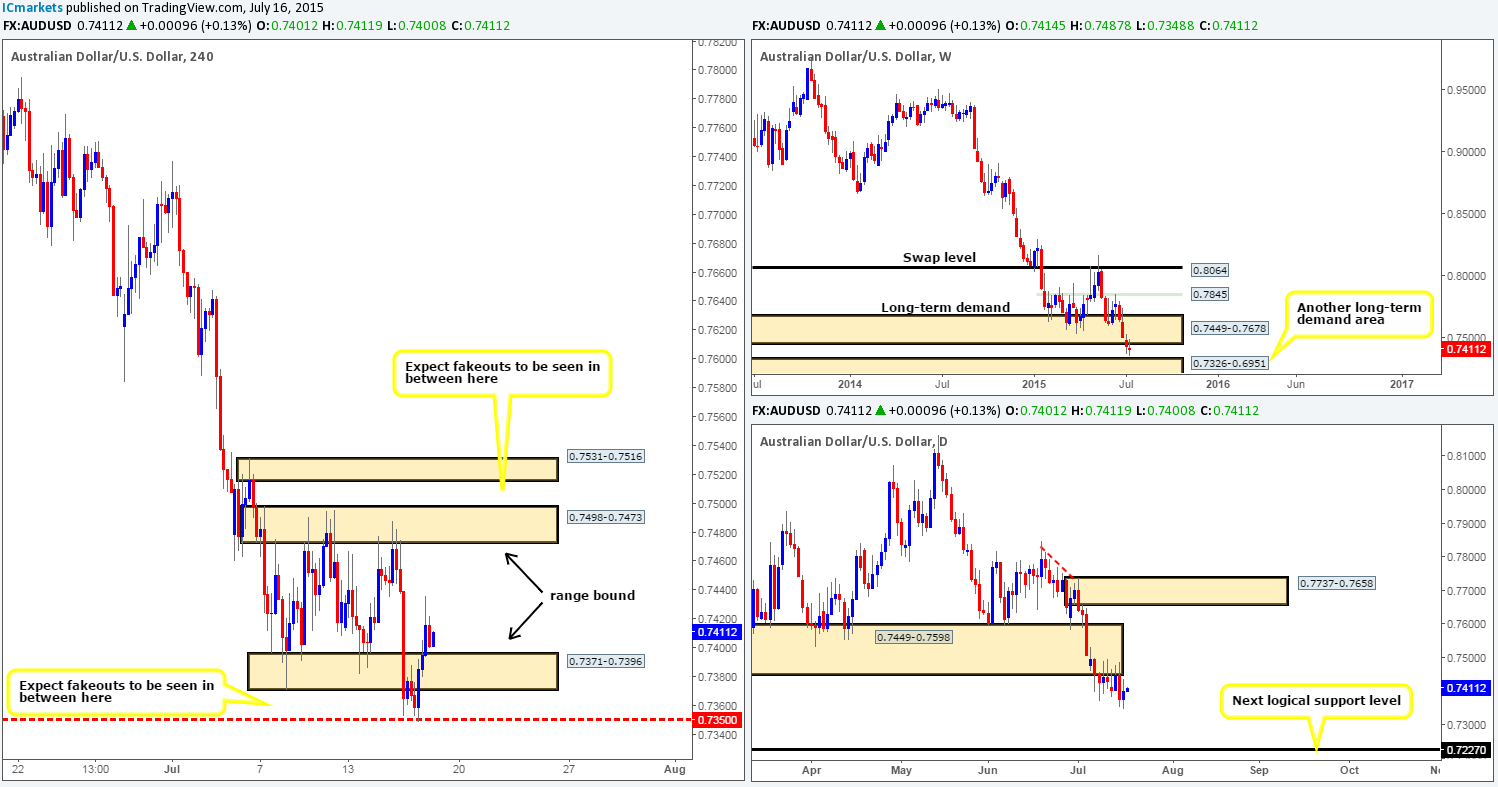
During the course of yesterday’s sessions, we can see that the Aussie bounced north from our pre-determined fakeout zone around 0.7350, which has consequently pushed prices back up into the 4hr consolidation area between 4hr demand at 0.7371-0.7396 and 4hr supply at 0.7498-0.7473. We do hope some of our readers managed to lock in some green pips from this intraday bounce!
With the weekly timeframe still showing price holding below the underside of a long-term weekly demand (now acting supply) area at 0.7449-0.7678, and also its partner demand on the daily timeframe (now supply) at 0.7449-0.7598, the long-term direction is most certainly south on this pair for the time being. The next supportive barrier to keep an eye on in the higher timeframe picture comes in from the weekly timeframe at 0.7326, the top-side of weekly demand.
With all of the above in mind, trading short today can only be done in one place in our opinion –the upper limit of the 4hr range. Waiting for lower timeframe confirmation here is strongly advised though as price could fakeout above to connect with the 4hr supply area at 0.7531-0.7516. Therefore, unless our alert which has been set at 0.7469 is triggered, we’re intending to remain flat on this pair today.
Levels to watch/ live orders:
- Buys: Flat (Stop loss: N/A).
- Sells: 0.7469 [Tentative – confirmation required] (Stop loss: 0.7501).
USD/JPY:
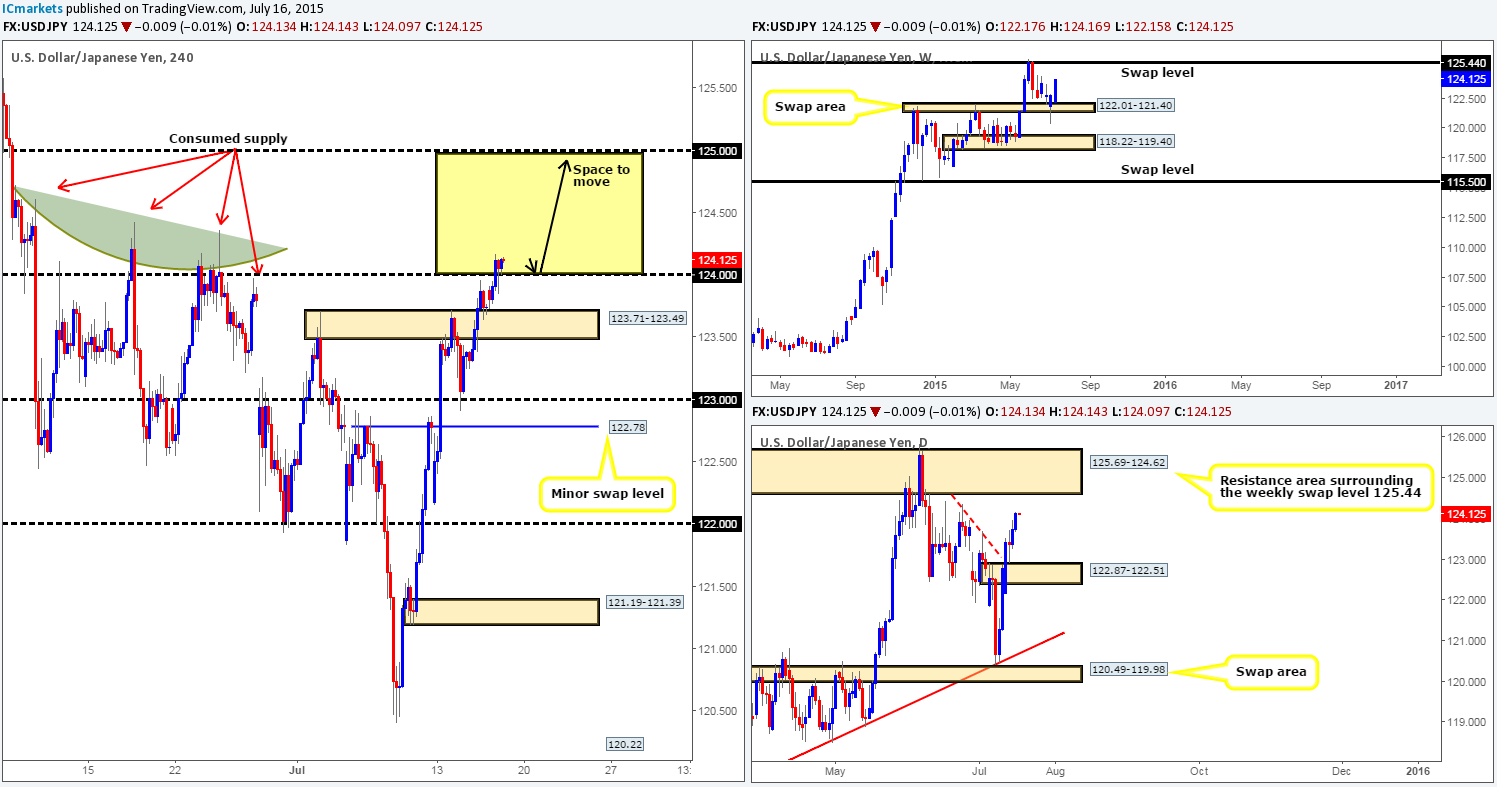
Once yesterday’s London session got under way, a close above the 124.00 handle was seen. Following this, price aggressively retested this number as support and at the time of writing appears to be holding firm. With offers around 124.00 likely cleared, we believe the path north is now free up to 125.00. Why we feel the path is clear above 124.00 comes from the supply consumption wicks seen marked with red arrows at: 123.97/124.36/124.43/124.61. These wicks were likely created by pro money used to collect unfilled sell orders in order to continue selling this market, thus clearing out the major sell orders and opening up a trading void so to speak. This – coupled with the fact that strong buying is taking place from the top-side of both a weekly swap area at 122.01-121.40, and also from a daily supply area (now acting demand) at 122.87-122.51 makes 124.00 a very attractive number for our team today!
Therefore, our objective for the day is relatively simple – watch for lower timeframe confirmed price action around the 124.00 region. Should we manage to spot buying strength here, we’ll likely, dependent on time of day of course, take an intraday long, targeting the 125.00 area.
Levels to watch/ live orders:
- Buys: 124.00 [Tentative – confirmation required] (Stop loss: depending on where one confirms this level).
- Sells: Flat (Stop loss: N/A).
USD/CAD:
The USD/CAD pair, as you can see, saw mild gains during yesterday’s sessions, which as a result, forced price to cross swords with a relatively long-term daily Quasimodo resistance level at 1.2965. Now, considering that this beast sits below a major weekly Quasimodo resistance level at 1.3014, we have chiseled out a sell zone between the two, which includes the large round number 1.3000.
(As we mentioned in yesterday’s analysis) However, taking into account the strong uptrend the USD/CAD is in right now, and the fact that a fakeout could be seen above the upper limit of our sell zone (1.3014), we are not going to be placing any pending sell orders here today. Instead, we’re going to patiently watch the lower timeframe (30/240 min) action once/if price hits this zone for any selling confirmation. Should this trade come to fruition, our ultimate take-profit target comes in at the round number 1.2800, which if you look across to the daily chart, you’ll see it lines up beautifully with a daily demand area seen at 1.2716-1.2803.
Levels to watch/ live orders:
- Buys: Flat (Stop loss: N/A).
- Sells: 1.3014/1.2965 [Tentative – confirmation required] (Stop loss: dependent on where one finds confirmation).
USD/CHF:
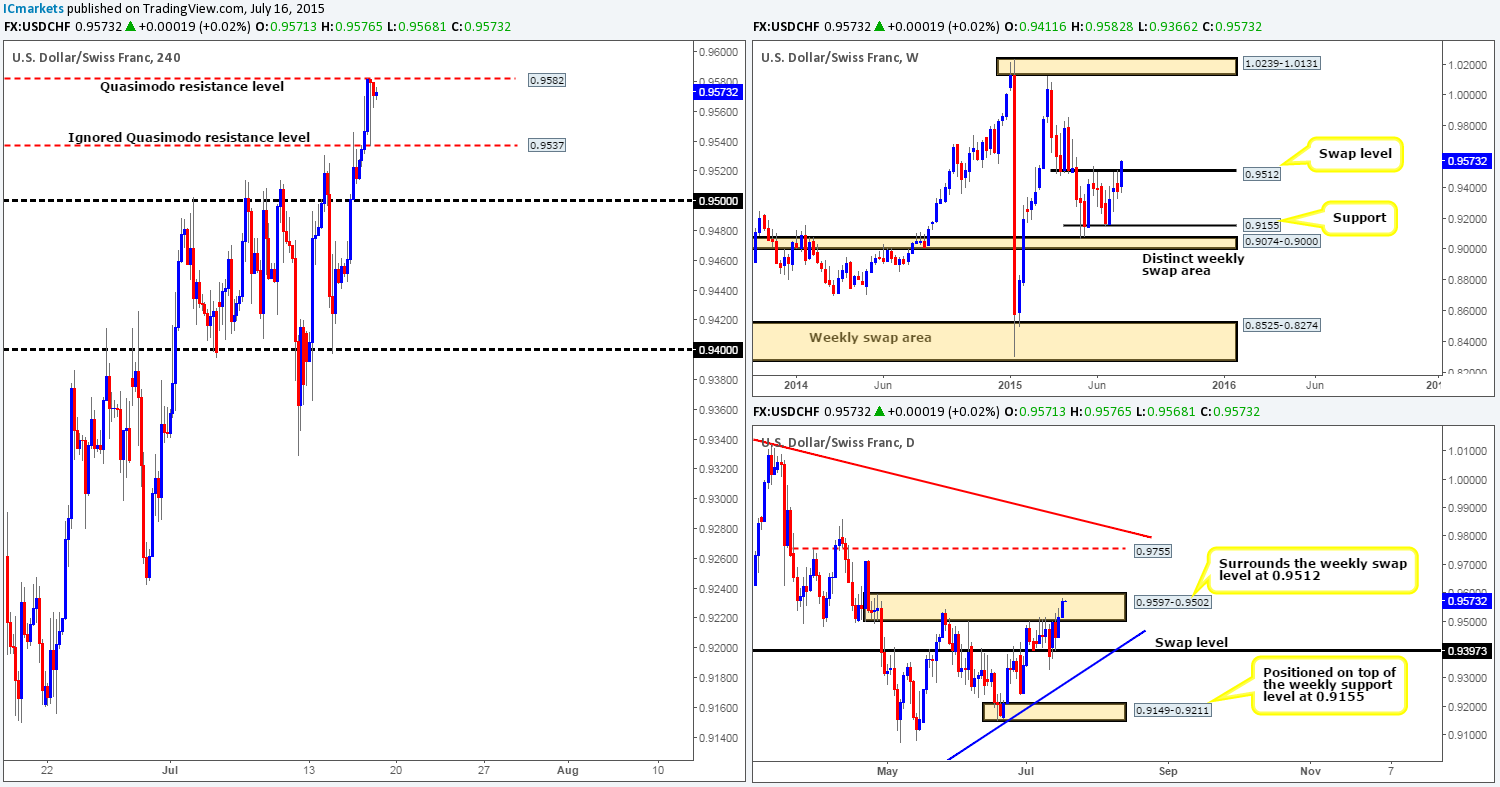
Yesterday’s action shows price engulfed the 4hr Quasimodo level at 0.9537, and climbed north to connect with yet another 4hr Quasimodo resistance level seen at 0.9582. This barrier has held price lower so far, but is not, as far as we can see, displaying any signs of bearish strength at the moment.
In the bigger picture, weekly movement reveals price is now trading above a weekly swap level coming in at 0.9512, while the daily chart shows price still lingering within daily supply seen at 0.9597-0.9502.
With all of the above taken into consideration, 0.9582 will likely play a key role in our decision-making process today. Should the sellers manage to continue holding this market lower as we enter into the European session, we’d likely consider an intraday short (as long as lower timeframe confirmation was present) down to the recently violated 4hr Quasimodo base at 0.9537. In the event that 0.9582 is taken out, however, this would likely do two things. Firstly, set the stage for a continuation move north up to a beautiful 4hr supply area at 0.9717-0.9687, and secondly, provide a potential long opportunity if price retests 0.9582 as support.
Levels to watch/ live orders:
- Buys: Flat (Stop loss: N/A).
- Sells: 0.9582 [Tentative – confirmation required] (Stop loss: dependent on where one confirms this level).
DOW 30:
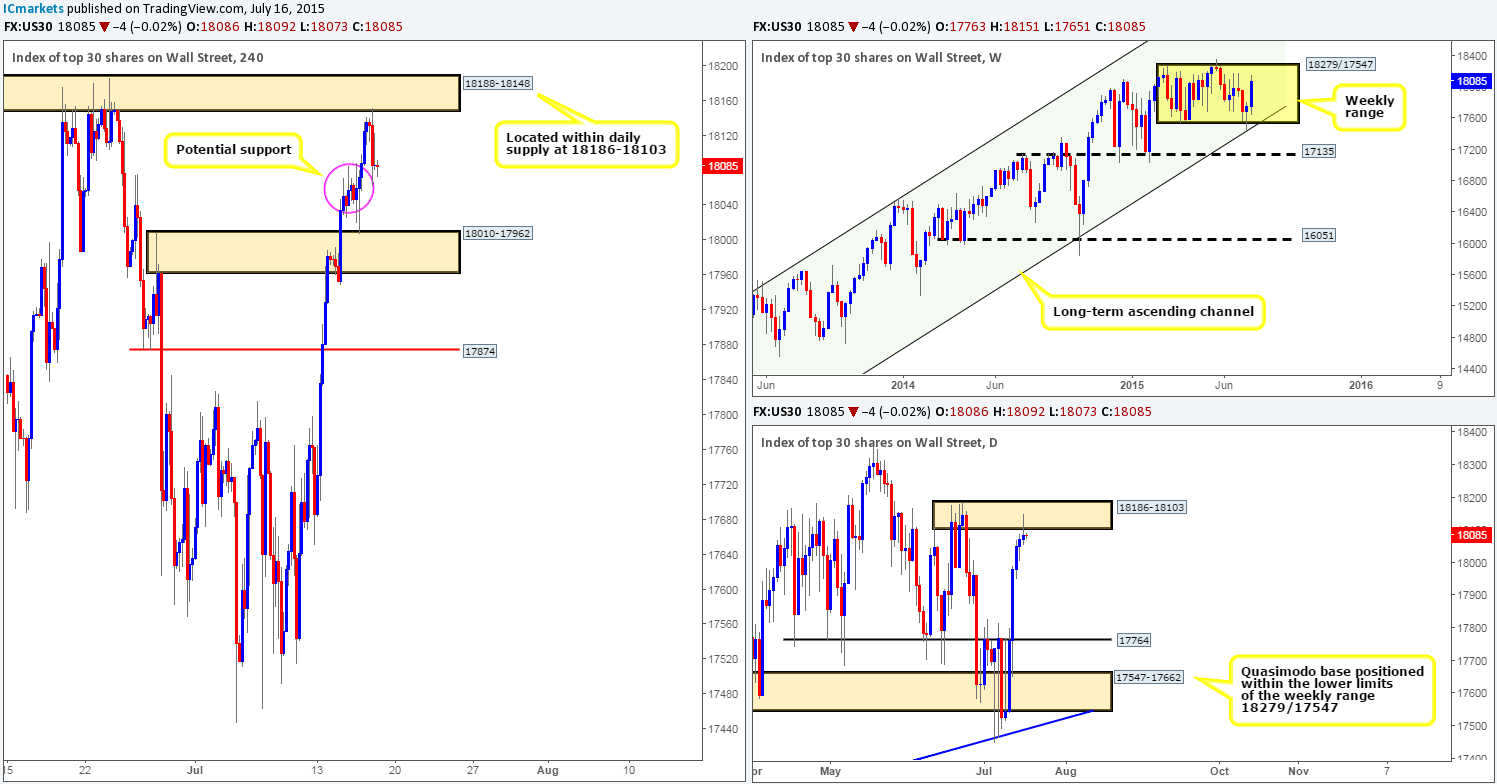
Higher-timeframe trading shows that price on the weekly chart is still lingering within the current weekly range at 18279/17547, while on the daily chart; price printed a bearish pin-bar candle yesterday off the back of a daily supply area seen at 18186-18103.
Amid yesterday’s sessions on the 4hr chart, however, we can see that price rallied and connected with a 4hr resistance zone at 18188-18148 (positioned within the aforementioned daily supply), which sent the DOW lower into the close 18086. Quite frankly, selling on the basis of the daily pin-bar candle is a risky trade in our book for two reasons. The first, there is quite a lot of wood to chop through on the 4hr timeframe (see 18041/18085 – pink circle), and secondly, the weekly chart is not exactly showing a bedrock of resistance at the moment. Therefore, in the absence of clearer price action, our team has decided to remain flat going into the weekend.
Levels to watch/ live orders:
- Buys: Flat (Stop loss: N/A).
- Sells: Flat (Stop loss: N/A).
XAU/USD: (Gold)
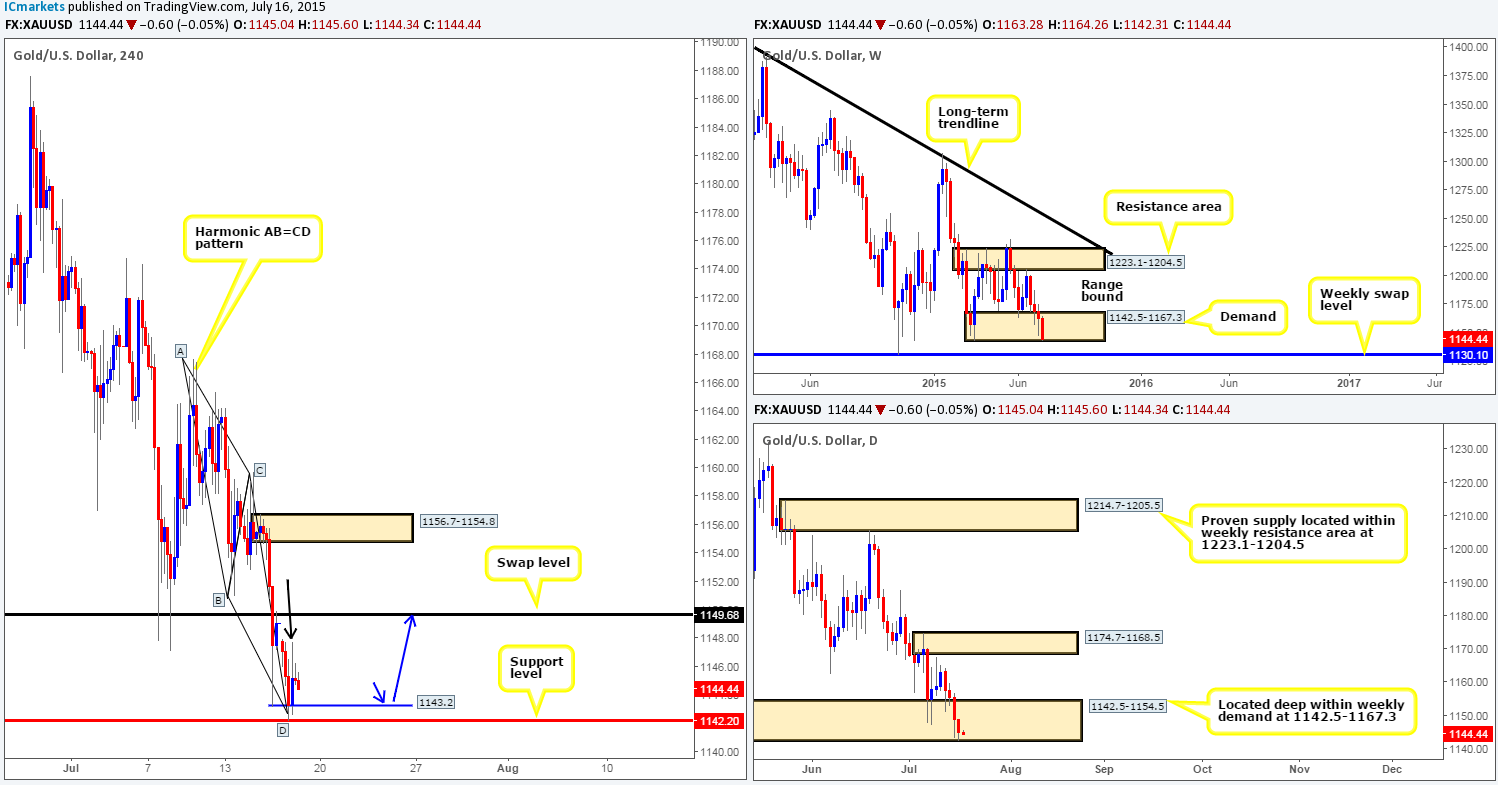
For those who read our previous report on Gold, you may recall us mentioning to watch for price to fakeout below Wednesday’s low 1143.2 into a 4hr support level at 1142.2. This, as you can see, played out perfectly. It was just a bummer that we could not find any suitable lower timeframe price confirmation to take advantage of this move! However, all may not be lost here! Following the fakeout, price stabbed north (black arrow – 1147.7) and likely consumed a ton of supply along the way, thus potentially clearing the path north up to the 4hr swap level seen at 1149.6.
This – coupled with the fact that price is not only still lingering just within higher timeframe demand (weekly: 1142.5-1167.3/daily: 1142.5-1154.5), but as you can probably see is also trading at a Harmonic AB=CD support at 1142.6, may tempt buying in this market today.
The level we have our eye on currently for a long trade is 1143.2. The recent fakeout below this level likely interested a lot of well-funded traders, thus unfilled buy orders could still be lurking around this number. As such, once, or indeed if price reaches this hurdle today, we may, if lower timeframe price structure remains strong, take an intraday long position from here, targeting 1149.6 to end the week.
Levels to watch/ live orders:
- Buys: 1143.2 [Tentative – confirmation required] (Stop loss: dependent on where one confirms this level).
- Sells: Flat (Stop loss: N/A).


