
EUR/USD:
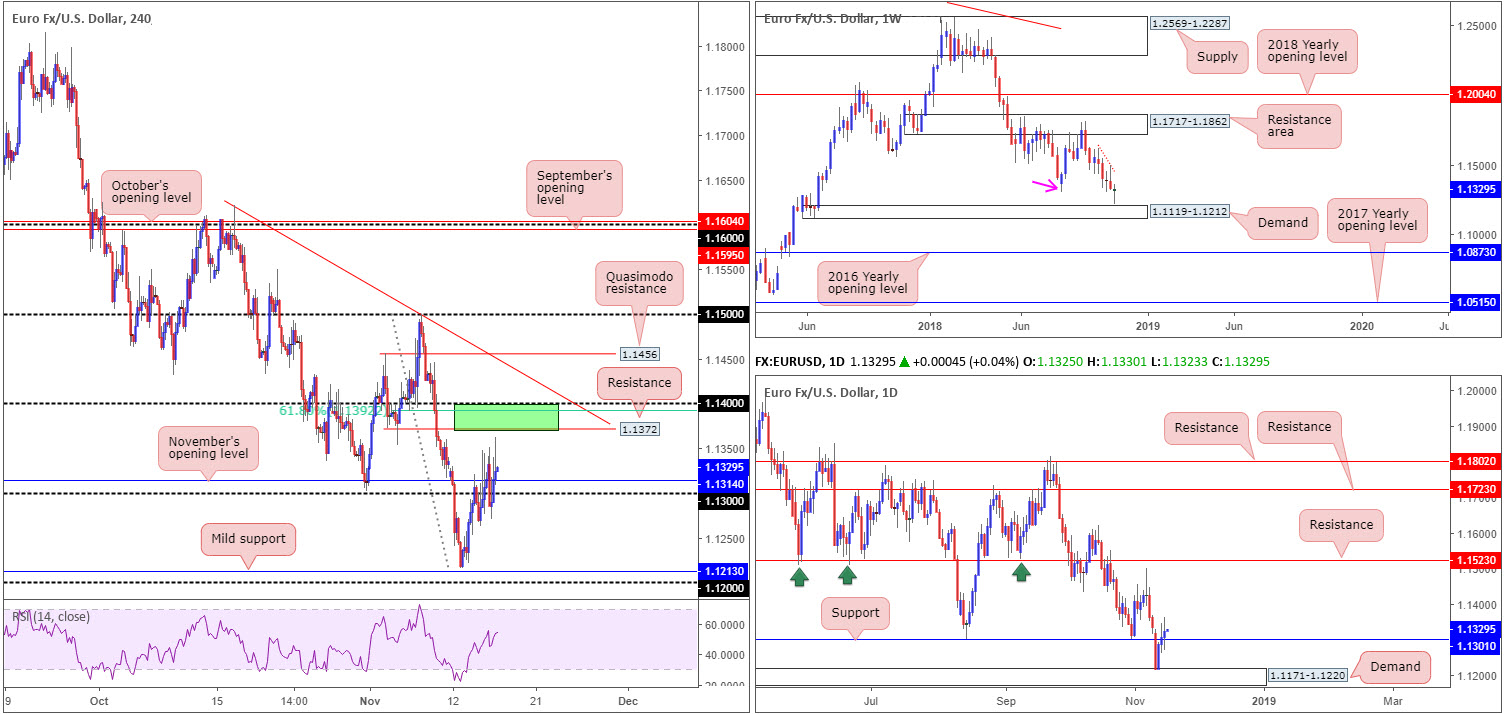
The EUR/USD logged its third successive daily gain Thursday, up 0.16% on the day. The H4 candles, as you can see, remained buoyant above its 1.13 handle, poised to potentially make a run for 1.14/1.1.1372 sometime today. Shaded in green, 1.14/1.1.1372 is comprised of the 1.14 handle, a 61.8% Fib resistance value at 1.1392 and a resistance level at 1.1372. Directly above this base, a trend line resistance (etched from the high 1.1621) is visible, followed closely by a Quasimodo resistance plotted at 1.1456.
As a reminder, in terms of where we stand on the bigger picture, recent buying witnessed daily price respect the resistance-turned support level at 1.1301 (visible as a swing resistance [pink arrow] on the weekly timeframe, though marked as support on the daily timeframe). Continued upside from this point could eventually see the unit push for the 1.1499 Nov 7 high, trailed closely by resistance plotted at 1.1523.
On the weekly timeframe, the pair recently bottomed just north of demand at 1.1119-1.1212. Although the unit may still endure some selling pressure around 1.1310 (the swing resistance marked with a pink arrow), the pathway north appears relatively clear towards the resistance area at 1.1717-1.1862.
Areas of consideration:
Traders’ crosshairs are likely fixed on the 1.14/1.1.1372 neighbourhood for a possible bounce lower today. Why only a bounce given the number of closely converging H4 structures? There’s limited higher-timeframe resistance – the closest structure is seen around the 1.1499 Nov 7 high.
Conservative traders may opt to wait and see how H4 price action behaves before pulling the trigger. A bearish candlestick formation would help confirm seller interest, and also provide entry/stop parameters. Aggressive traders, on the other hand, will likely enter short from 1.1372 with stop-loss orders planted a few pips beyond 1.14. This is reasonably chancy, though, owing to the fact round numbers tend to attract fakeouts/stop runs.
In regard to downside targets from 1.14/1.1.1372, November’s opening level mentioned above at 1.1314 remains a logical starting point.
Today’s data points: ECB President Draghi speaks; German Buba President Weidmann speaks.
GBP/USD:
The British pound suffered heavy losses Thursday, and was by far the worst performer among major peers. The catalyst behind the latest round of selling came from the UK Cabinet/government conflict over the Brexit withdrawal draft, encountering a number of high-profile resignations. UK PM May also held a press conference yesterday (where many thought she may resign) announcing she will ‘see this through’ and fight any leadership challenge.
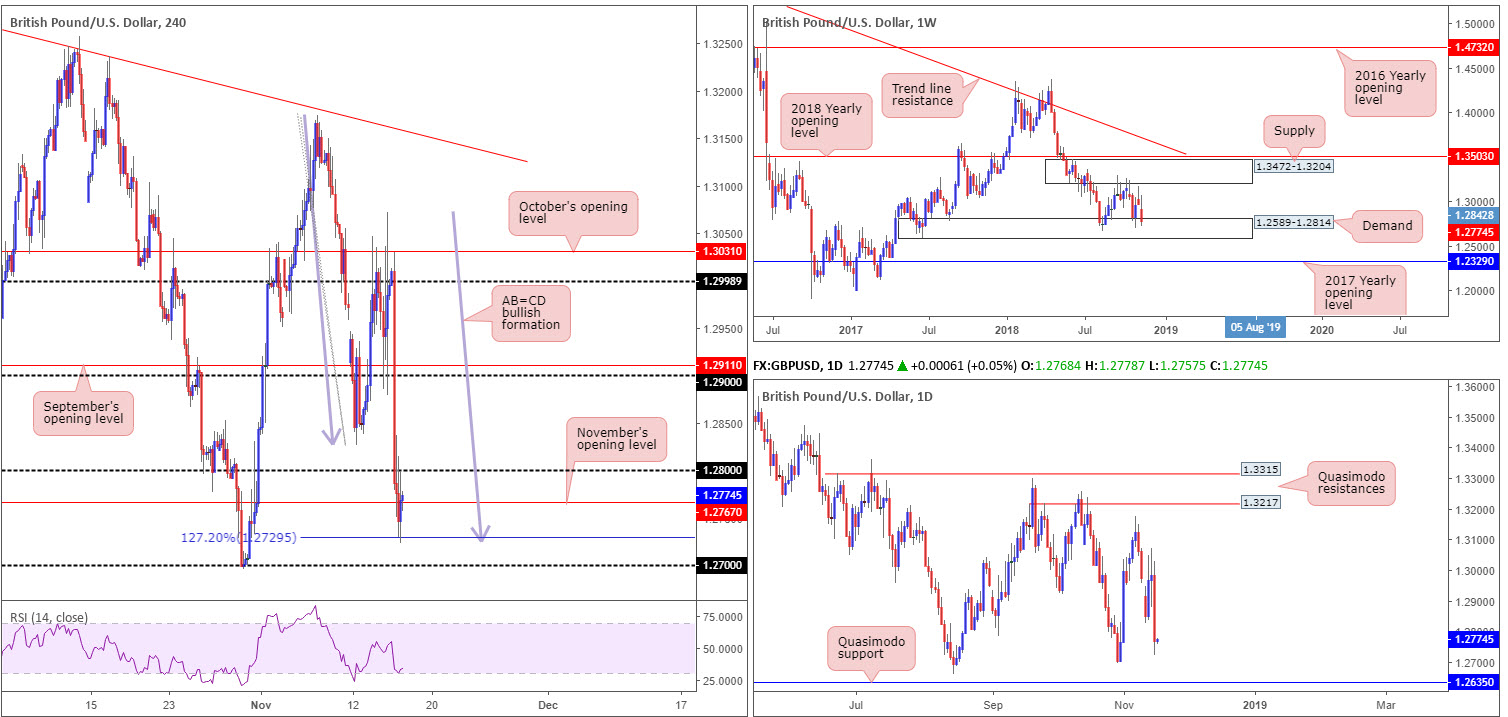
Down 1.67% on the day, H4 price action is seen nursing recent losses off an AB=CD (blue arrows) 127.2% Fib ext. point at 1.2729. Whether this will be enough to attract buyers into the market today is difficult to judge, given we have November’s opening level plotted nearby at 1.2767, shadowed closely by the 1.28 handle, both of which could hold active sellers.
The key observation on the higher timeframes is the weekly demand at 1.2589-1.2814. Note this area has held price higher on a number of occasions in the past. A closer look at price action on the daily timeframe, nevertheless, shows the unit positioned within close proximity to the 1.2695 Oct 30 low. While a response from this neighbourhood is possible, the Quasimodo support seen at 1.2635 is the more appealing level, given the amount of stop-loss orders likely positioned beneath the said low and the 1.2661 Aug 15 low. Taking out these stops provide liquidity for pro money to buy.
Areas of consideration:
Knowing weekly demand at 1.2589-1.2814 is in play, further buying on the H4 timeframe is certainly a possibility, with a challenge of 1.28 likely on the cards. However, in view of yesterday’s precipitous decline, most traders will almost certainly want to see 1.28 taken out before considering longs. A H4 close above this number that’s followed up with a retest (preferably in the shape of a bullish candlestick pattern – entry/stop parameters can be decided on this structure) would likely be sufficient enough to draw in buyers, eyeing upside targets in the range of the 1.29 handle/September’s opening level at 1.2911.
Today’s data points: Limited.
AUD/USD:
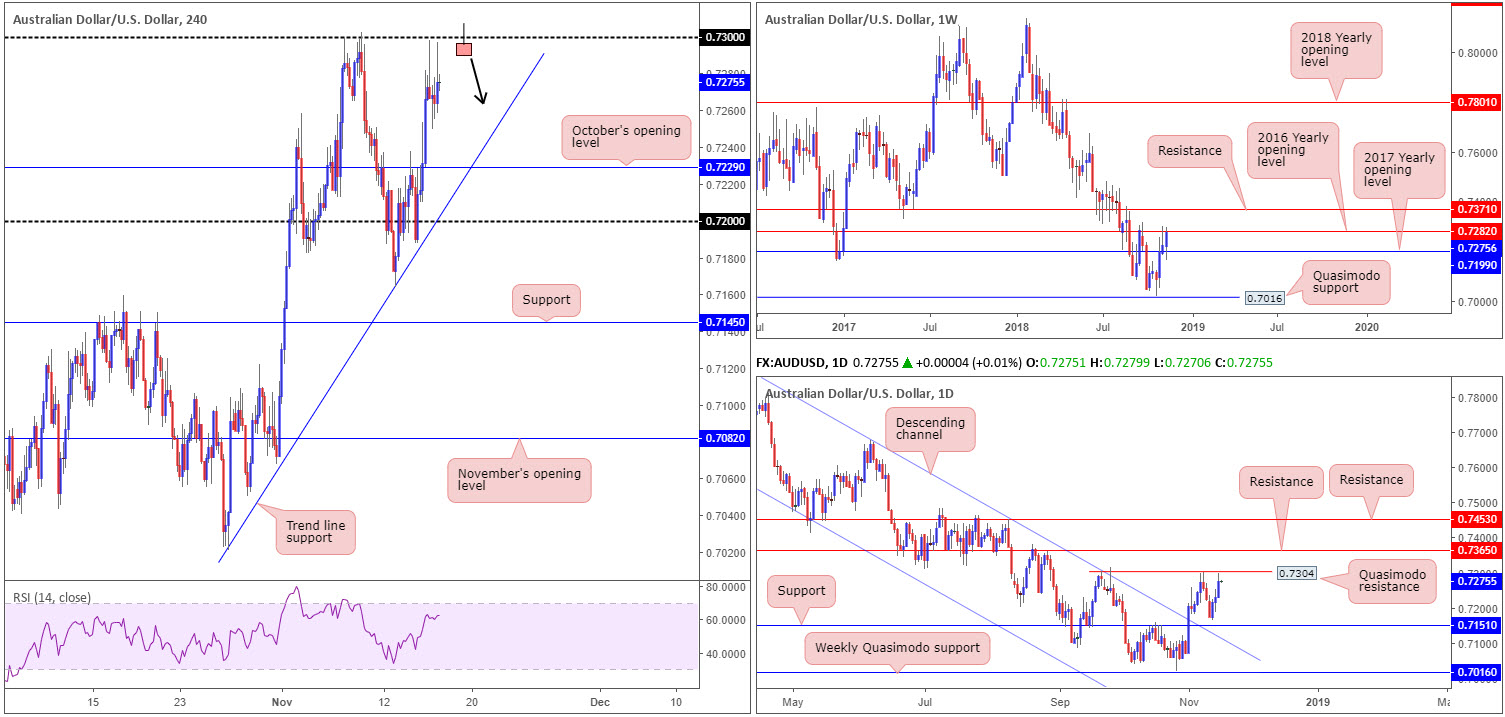
Going into early Asian hours Thursday, the Australian dollar derived fresh impetus on the back of better-than-expected employment figures. Despite this, the remainder of the day witnessed the AUD/USD enter choppy trade just south of its 0.73 handle.
0.73 is a key level, according to our technical studies. 0.73 is given extra credibility due to it fusing closely with the 2017 yearly opening level at 0.7282 positioned on the weekly timeframe. In addition to this, daily movement is also seen hovering just ahead of a Quasimodo resistance at 0.7304.
Areas of consideration:
On account of the above, a fakeout above 0.73 is expected to play out today/early next week. A H4 bearish pin-bar formation (entry/stop parameters can be decided on this structure) that pierces through 0.73 (see chart for a visual) and tests the daily Quasimodo resistance mentioned above at 0.7304 is desirable. Not only will this take out a portion of stop-loss orders above 0.73 – providing liquidity to those looking to sell – it’ll also draw in higher-timeframe sellers from the daily Quasimodo point. Should the setup come to fruition, the first take-profit target resides around either the trend line support (extended from the low 0.7041) or October’s opening level at 0.7229, whichever hits first.
Today’s data points: Limited.
USD/JPY:
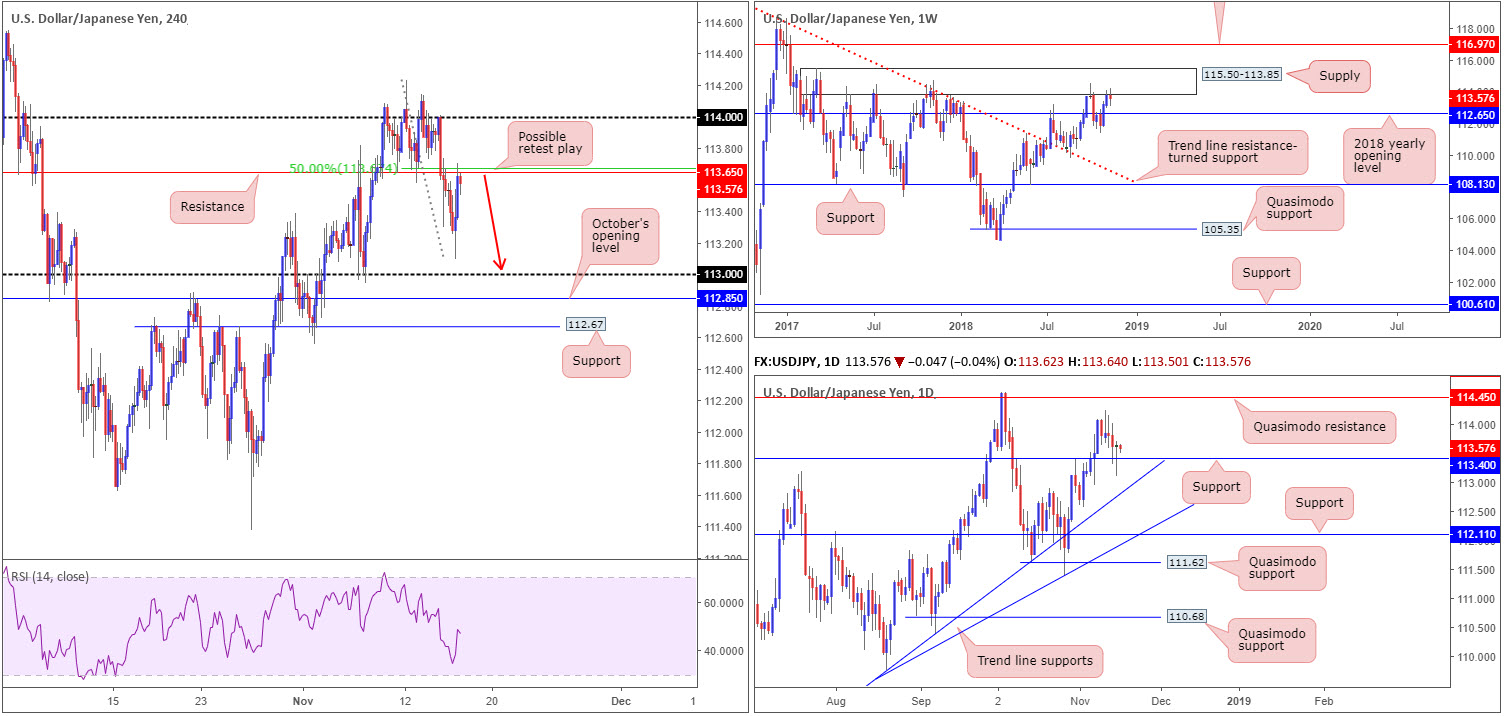
Despite upbeat US retail sales, the USD/JPY pushed for lower ground Thursday and only found support after bottoming just north of the 113 handle. Bolstered by a move higher in US equities, the pair concluded the day retesting the underside of H4 resistance at 113.65/50.0% resistance value at 113.67. As this level emphasizes more of a local presence, however, traders may adopt a cautious stance in regard to selling here.
With respect to the higher timeframes, weekly supply at 115.50-113.85 remains firmly in the fight and could eventually pull the market towards its 2018 yearly opening level at 112.65, therefore supporting the possibility of a selloff from the current H4 resistance. Traders may also want to acknowledge this weekly area has capped upside since May of 2017. On the other side of the spectrum, however, daily price tested support at 113.40 in the shape of a bullish pin-bar formation, consequently communicating a possible advance higher towards Quasimodo resistance at 114.45.
Areas of consideration:
In consideration of the above reading, a retest play of H4 resistance at 113.65 is an option today (red arrows), targeting 113 as the initial port of call. Due to the threat of further buying presented on the daily timeframe, though, waiting for additional candlestick confirmation to form prior to pulling the trigger is advised (entry/stop parameters can be defined by the candlestick structure).
Today’s data points: Limited.
USD/CAD:
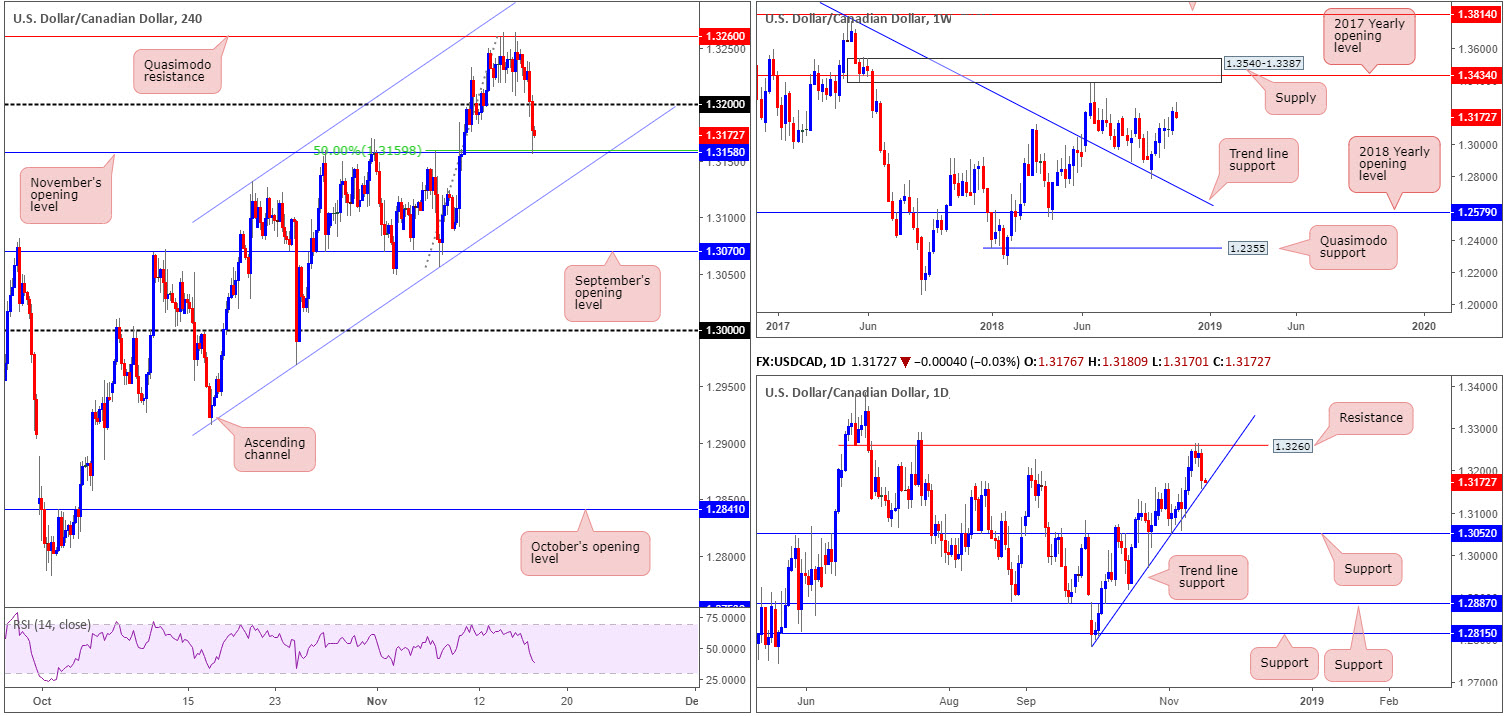
In spite of spending the majority of Thursday confined to a relatively tight range just north of the 1.32 handle, the USD/CAD came under pressure amid US hours, aided by rising crude oil prices. 1.32, as you can see, was overthrown, leaving the runway free for a test of November’s opening level drawn from 1.3158/50.0% support at 1.3159, which has so far held firm.
What’s also interesting from a technical perspective is the daily trend line support (taken from the low 1.2782) intersecting with the aforementioned monthly open level. Combined, this is likely enough evidence to suggest the market may look to pare a portion of recent losses and retest 1.32 as resistance. With regards to the weekly timeframe, however, there’s limited structure in play at the moment, though room to advance as far north as supply coming in at 1.3540-1.3387 (happens to hold the 2018 yearly opening level within at 1.3434) is clearly visible.
Areas of consideration:
From an intraday standpoint, buying from November’s opening level mentioned above at 1.3158 may be an option. Whether traders opt to engage aggressively here or wait for additional candle confirmation, the initial take-profit target resides around 1.32. In the event 1.3158 fails to hold, the next port of call rests around the H4 channel support (drawn from the low 1.2916).
Today’s data points: Canadian manufacturing sales m/m.
USD/CHF:
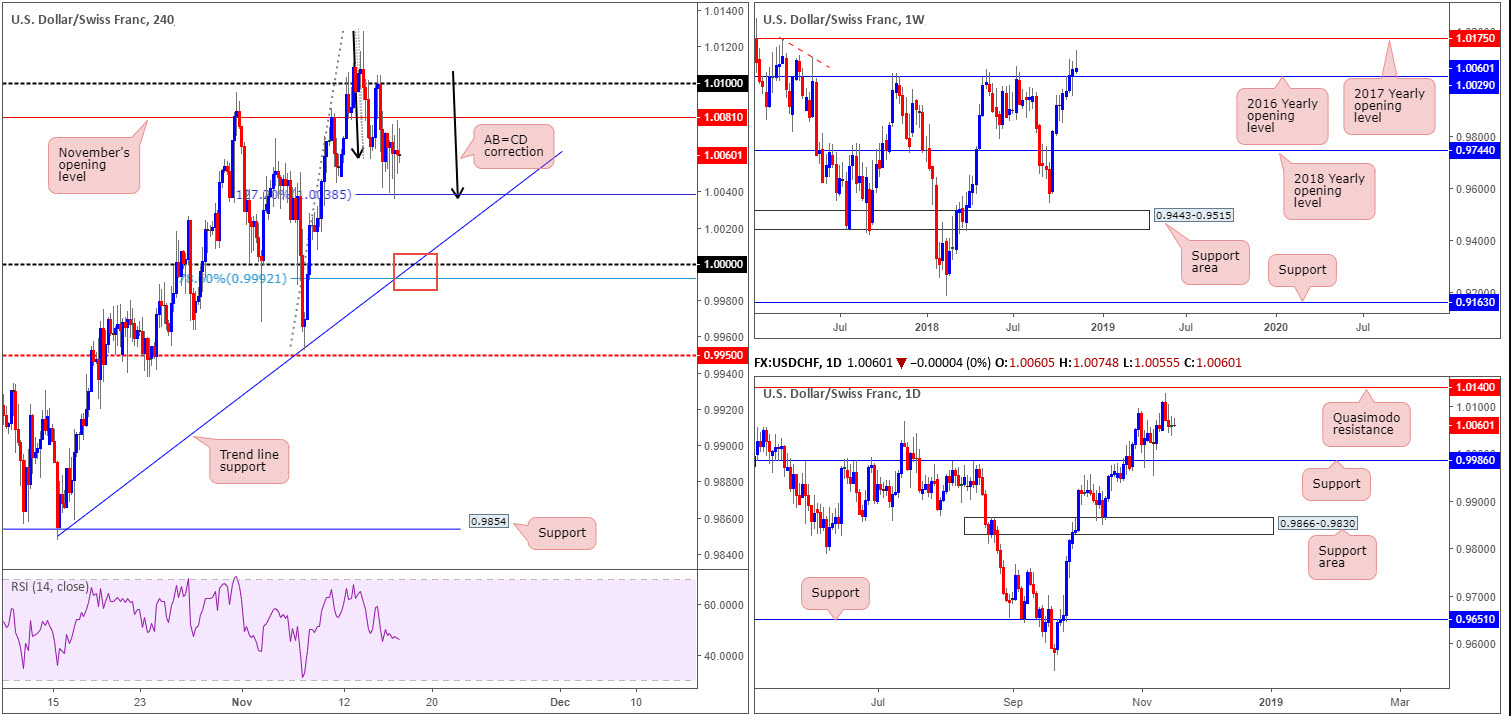
USD/CHF prices are little changed this morning, with yesterday’s action seen forming a clear-cut daily indecision candle mid-range between a daily Quasimodo resistance at 1.0140 and a daily support at 0.9986.
Short-term movement on Thursday shows the H4 candles entered into a tight phase of consolidation after testing an AB=CD (black arrows) correction pattern around the 1.0038 region (127.2% Fib ext. point). Overhead from this point, resistance falls in at 1.0081: November’s opening level, tailed by the 1.01 handle. To the downside, parity (1.0000) remains an appealing level, fusing with a H4 trend line support (etched from the low 0.9847) and a 78.6% H4 Fib support at 0.9992. In addition to this, traders may want to note parity is seen positioned just north of daily support mentioned above at 0.9986.
Areas of consideration:
Based on our technical studies, 1.0000 (in particular the area marked with a red square) is eyed as support today/early next week for potential longs, thanks to its converging support on the H4 and daily timeframe. As price has yet to complete its approach, it is difficult to accurately decide on a first take-profit target, though as it stands 1.0050ish remains logical. Conservative traders may opt to wait and see how H4 price action behaves before pulling the trigger. A bullish candlestick formation would help confirm buyer interest, and also provide entry/stop parameters.
Today’s data points: Limited.
Dow Jones Industrial Average:
The Chinese commerce ministry announced in early trade the US and China has resumed high level talks on trade, allowing the DJIA some respite during Thursday’s session.
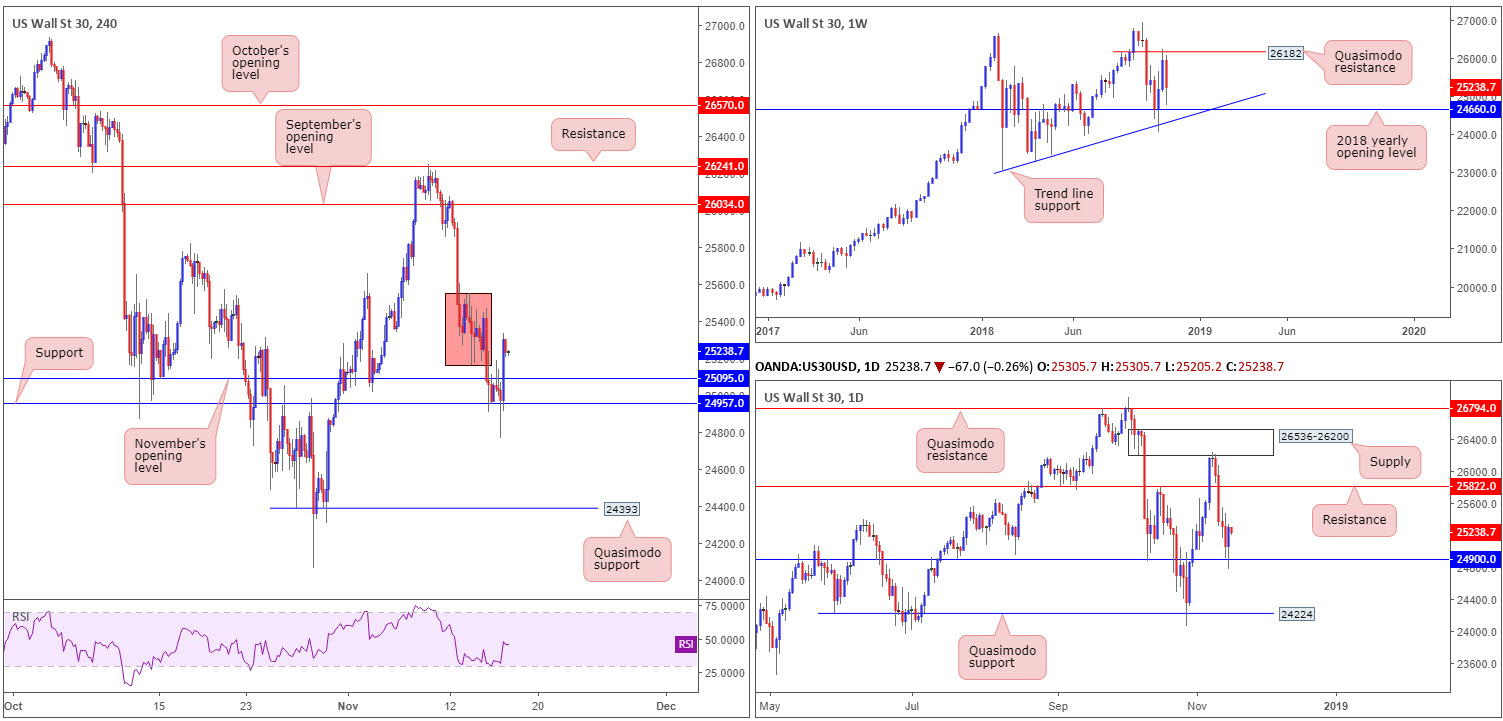
Despite a rather aggressive whipsaw to lows of 24770, the index witnessed a resurgence of bidding enter the fray from H4 support at 24957 in US hours. Though H4 price managed to reclaim November’s opening level nearby at 25095, price action is currently seen grappling with a large portion of consolidation marked in red at 25550-25166. Should the unit press beyond here, the next upside target on the H4 scale can be seen around September’s opening level priced in at 26034.
On a wider perspective, weekly price still shows scope for additional selling towards the 2018 yearly opening level at 24660. Daily flow, on the other hand, found willing buyers off support drawn from 24900. Whether this will be sufficient enough to attract buyers into the market is difficult to judge, particularly when we have the weekly timeframe signifying room to explore lower ground.
Areas of consideration:
While further buying on the daily timeframe is certainly a possibility, traders are likely going to be concerned by the red area of consolidation on the H4 timeframe mentioned above at 25550-25166. Despite this, even with this area out of the picture, traders then have to contend with nearby resistance seen on the daily timeframe at 25822. In light of this, neither a long nor short seems attractive at this time.
Today’s data points: Limited.
XAU/USD (Gold):
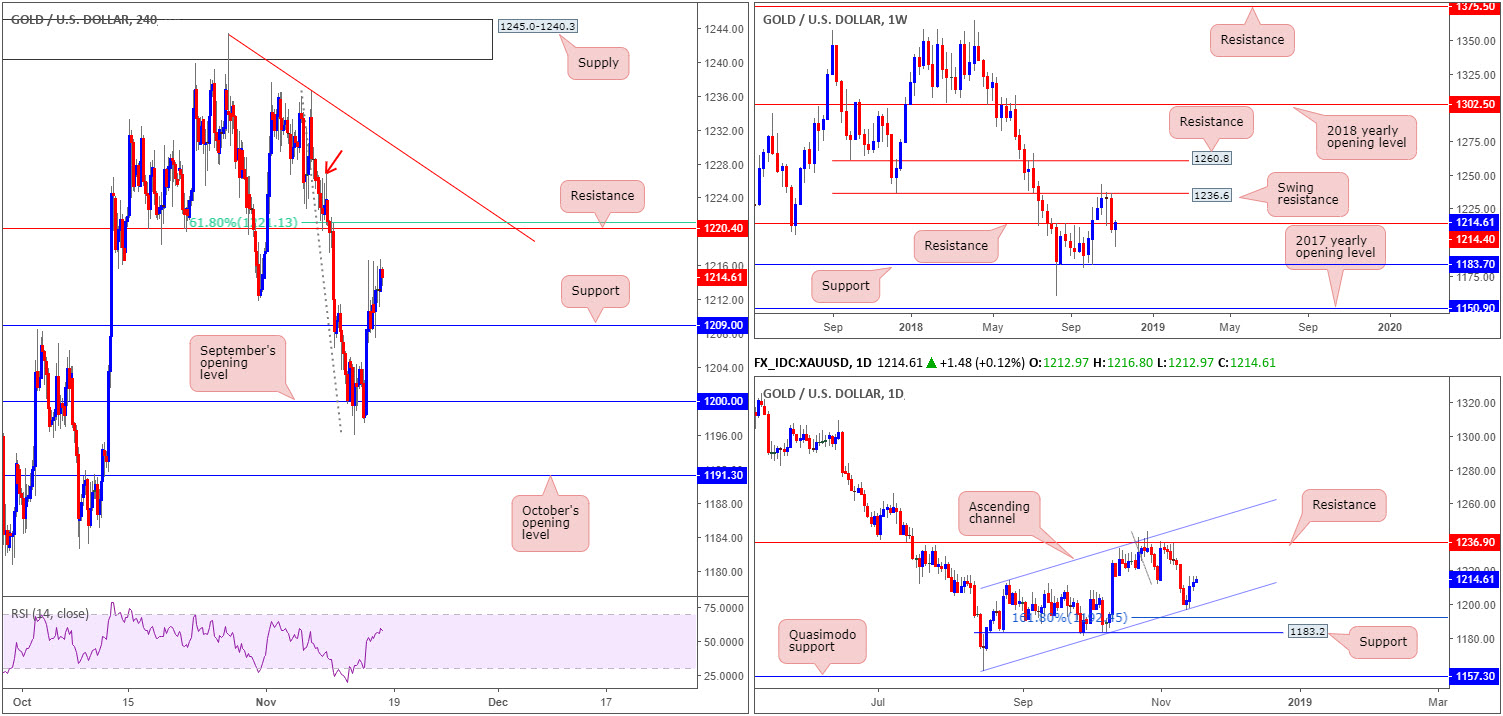
Demand for the safe-haven metal increased Thursday, as the US dollar index continues to emphasize an indecisive tone around 97.00. H4 support at 1209.0, as you can see, provided a platform for buyers to lift price action to highs of 1216.4. Although yesterday’s advance was far from earth shattering, further buying could still be in the offing towards H4 resistance plotted at 1220.4, which happens to merge with a 61.8% Fib resistance at 1121.1.
Against the backdrop of H4 flow, though, weekly price is seen testing resistance at 1214.4. This remains a key level on this scale, and therefore could eventually pressure bullion lower. Contrary to this, however, daily movement shows room to potentially advance as far north as resistance at 1236.9, followed by channel resistance (taken from the high 1214.3).
Areas of consideration:
Though weekly and daily timeframes present opposing structure, a sell from the H4 resistance mentioned above at 1220.4/61.8% Fib resistance at 1121.1 is a possibility. The combination of the noted H4 structures, along with nearby weekly resistance highlighted above at 1214.4, is likely to entice sellers into the market.
Conservative traders may opt to wait and see how H4 price action behaves before pulling the trigger. A bearish candlestick formation would help confirm seller interest, and also provide entry/stop parameters. For traders who prefer to enter without additional confirmation, a sell from 1220.4 with stop-loss orders positioned above 1226.9 (the top edge of a supply zone marked with a red arrow) is an alternative.
The use of the site is agreement that the site is for informational and educational purposes only and does not constitute advice in any form in the furtherance of any trade or trading decisions.
The accuracy, completeness and timeliness of the information contained on this site cannot be guaranteed. IC Markets does not warranty, guarantee or make any representations, or assume any liability with regard to financial results based on the use of the information in the site.
News, views, opinions, recommendations and other information obtained from sources outside of www.icmarkets.com.au, used in this site are believed to be reliable, but we cannot guarantee their accuracy or completeness. All such information is subject to change at any time without notice. IC Markets assumes no responsibility for the content of any linked site. The fact that such links may exist does not indicate approval or endorsement of any material contained on any linked site.
IC Markets is not liable for any harm caused by the transmission, through accessing the services or information on this site, of a computer virus, or other computer code or programming device that might be used to access, delete, damage, disable, disrupt or otherwise impede in any manner, the operation of the site or of any user’s software, hardware, data or property.


