
EUR/USD:
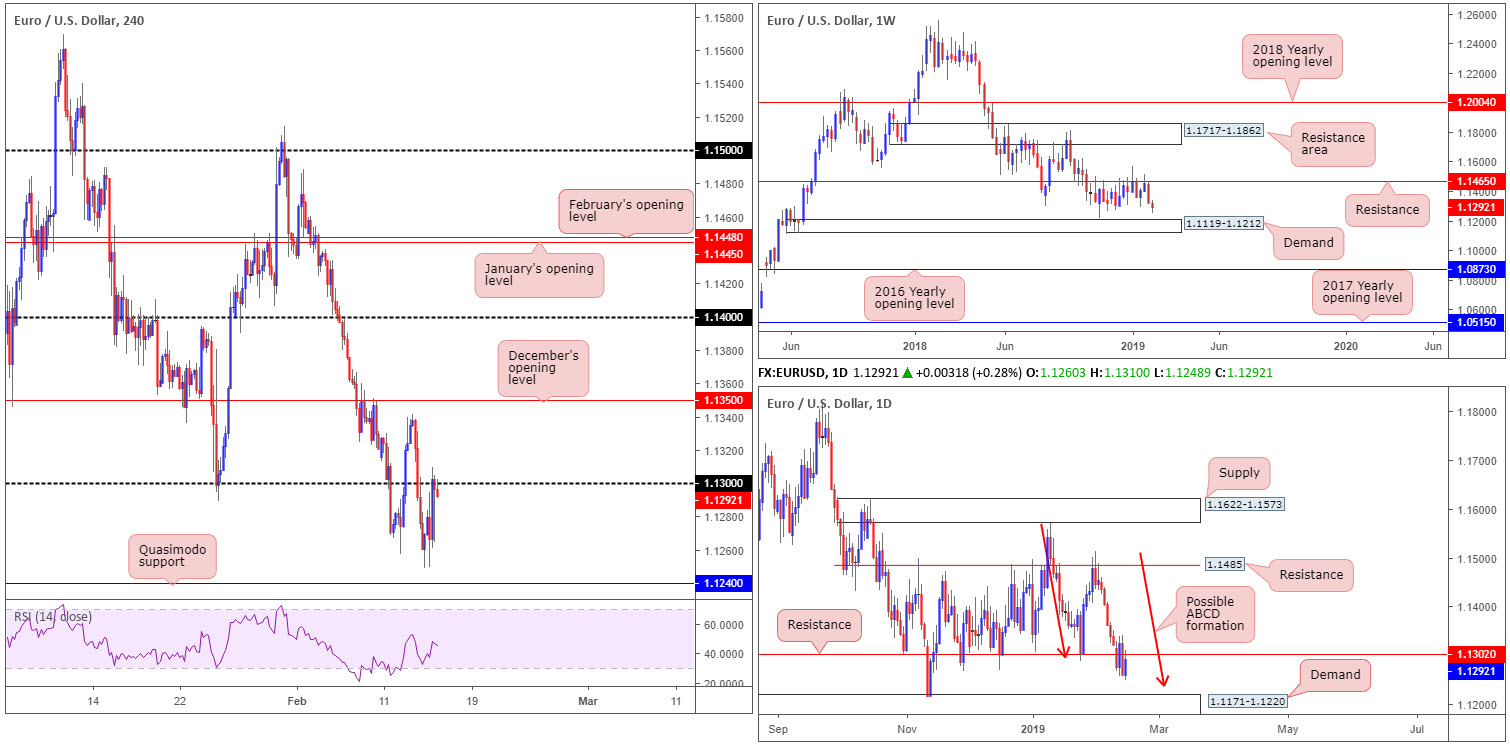
The single currency came under pressure amid European hours Thursday, largely weighed on by less-than-stellar German growth figures. Moves south, however, were fleeting as retail sales data out of the US came in lower than expected, therefore providing fresh impetus and dragging the EUR/USD H4 candles towards the 1.13 handle, which, as you can see, has held form into the close.
What gives 1.13 extra credibility is daily resistance at 1.1302. Note this barrier holds reasonably significant history, and in addition to this, let’s also not forget weekly price recently faded a long standing support/resistance at 1.1465 that shows room to press as far south as demand at 1.1119-1.1212.
The next downside target on the H4 scale, aside from yesterday’s lows around 1.1250ish, is a Quasimodo support located at 1.1240. Converging with 1.1240 is a possible daily ABCD bullish correction (red arrows) that completes a few pips north of a daily demand at 1.1171-1.1220 (glued to the top edge of the current weekly demand area).
Areas of consideration:
Between 1.1240/1.1220 (the H4 Quasimodo support at 1.1240 and the daily ABCD bullish completion also at 1.1240, as well as the top edge of demand printed at 1.1220) offers strong confluence to work with for a potential long. For conservative traders concerned regarding the dimensions of the buy zone: 20 pips, waiting for a H4 bullish candlestick formation to take shape is an option. That way, not only is there modest confirmation buyers are involved, traders have entry and stop parameters to work with as well.
What’s also interesting are possible shorts off 1.13, targeting the 1.1240/1.1220 buy zone. The research team likes this due to both the weekly and daily timeframes showing room to explore lower ground at current price (see above).
Today’s data points: US Prelim UoM Consumer Sentiment.
GBP/USD:
UK PM May lost her motion vote Thursday by a margin of 303 to 258. The Tory rebel ERG group were partly responsible for her defeat, after they chose to abstain the vote as the motion would have ruled out a no-deal Brexit option.
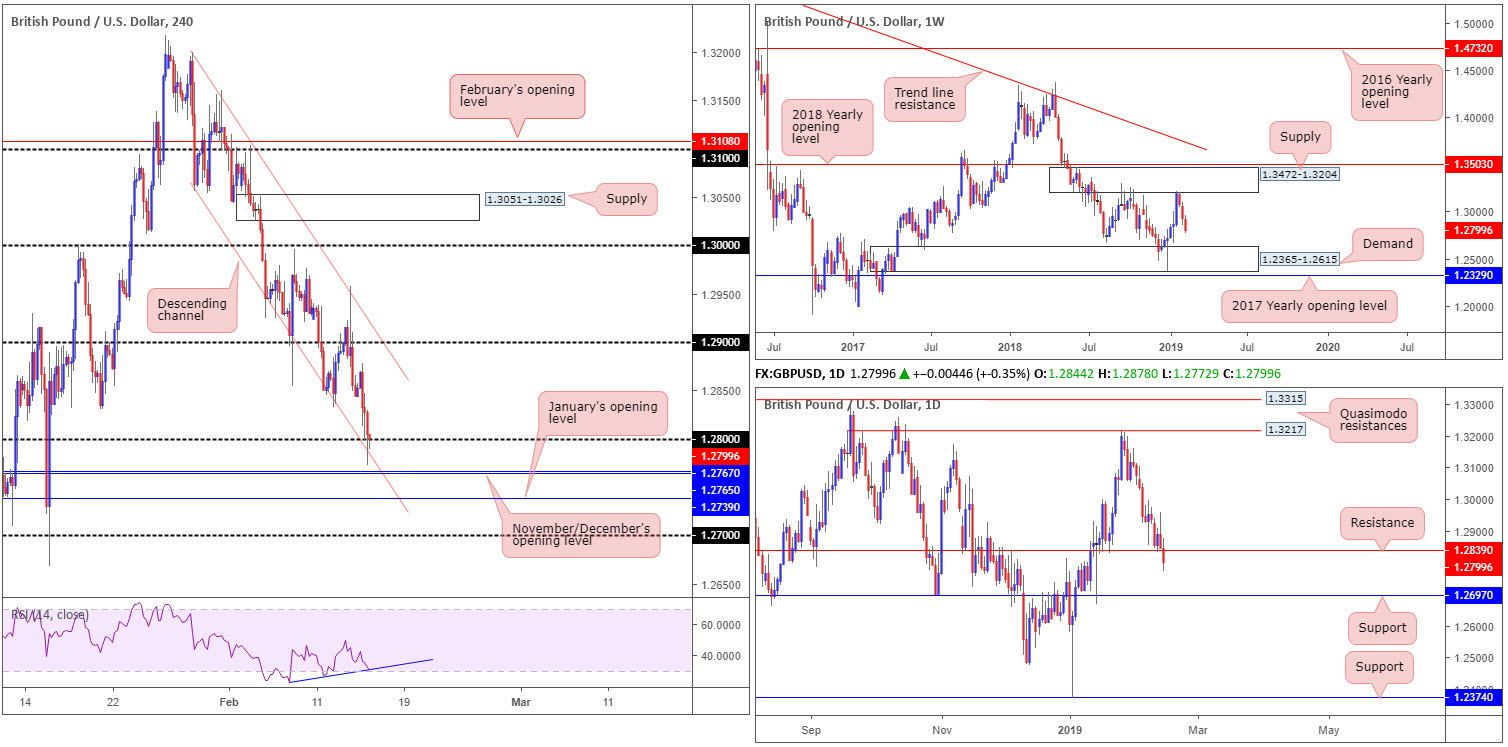
Pound sterling sustained further losses Thursday, losing grip of its 1.28 handle on the H4 scale and potentially exposing November/December’s opening levels at 1.2765/67, along with the yearly opening level at 1.2739. What’s also notable from a technical perspective on this timeframe is channel support (extended from the low at 1.3055), as well as the RSI indicator displaying divergence (blue line).
The story over on the bigger picture, nevertheless, is increasingly bearish. Weekly movement continues to explore lower ground after connecting with the underside of supply at 1.3472-1.3204 a couple of weeks ago. Further selling from current price could potentially stretch as far south as demand pencilled in at 1.2365-1.2615. In conjunction with weekly flow, daily support at 1.2839 (now acting resistance) was firmly taken out yesterday, highlighting support at 1.2697 as the next viable barrier in view.
Areas of consideration:
Searching for longs in this market, knowing we’re coming from weekly supply and have recently crossed beneath daily support, is chancy and best left on the sidelines, according to our technical studies.
According to the higher timeframes, looking for selling opportunities sub 1.28 and targeting 1.27 (daily support at 1.2697 – the next downside target on the daily timeframe – coincides with this level) is valid. The grumble, however, is we have three monthly opening levels to contend with on the H4 before reaching 1.27, which could potentially hamper downside movement (see above in bold).
Technically speaking, direction certainly favours sellers for the time being, though selling, as highlighted above, is problematic. For that reason, remaining flat is an option.
Today’s data points: UK Retail Sales m/m; US Prelim UoM Consumer Sentiment.
AUD/USD:
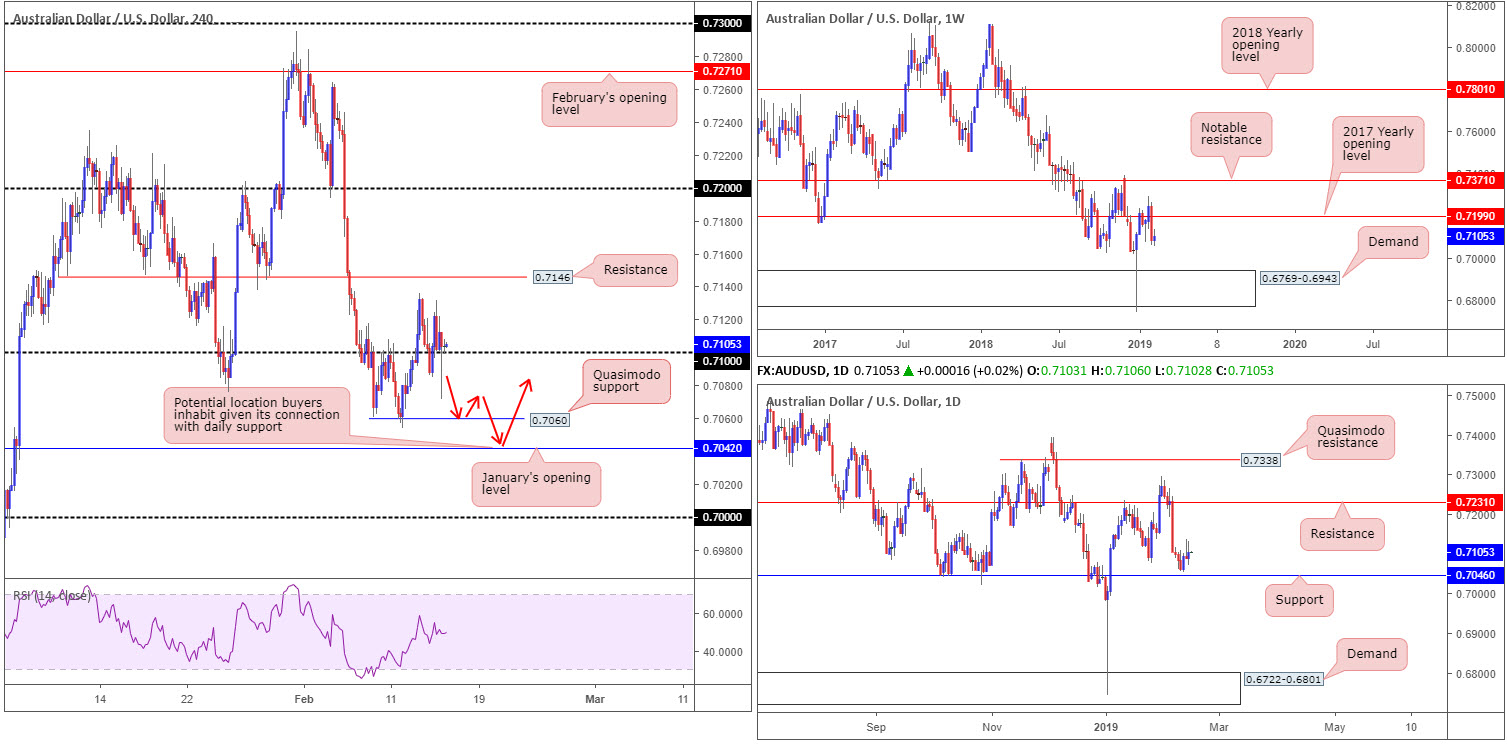
Underpinned by better-than-expected Chinese trade figures, the commodity-linked currency rose higher against its US counterpart in early Asia, reaching a peak of 0.7131. Things turned sour as London traders entered the fight, however, which eventually saw the candles whipsaw through 0.71 to lows of 0.7071 amid US hours. Aside from this, though, overall structure remains unchanged.
With 0.71 potentially weakened after yesterday’s push lower, H4 Quasimodo support at 0.7060 is in sight, tailed closely by January’s opening level at 0.7042. Although the H4 Quasimodo may ‘bounce’ price, the real support, according to our technical studies, rests at 0.7042, given it coincides with daily support at 0.7046.
While the combination of the H4 and daily levels may appear high probability, traders need to remind themselves weekly price displays room to press lower. After recapturing its 2017 yearly opening level at 0.7199, scope to press as far south as demand at 0.6769-0.6943 is visible.
Areas of consideration:
Although weekly price appears poised to discover lower levels this week, a reaction from January’s opening level mentioned above on the H4 timeframe at 0.7042, knowing it aligns closely with daily support at 0.7046, remains a possible level for the watchlist today. On the whole, it is trader dependent on what entry method is used to confirm 0.7042 as support, if any. Some traders may prefer to drill down to the lower timeframes and search for a resistance-turned support setup to trade. Others may opt to wait for candlestick confirmation off the H4 timeframe. Irrespective of the method employed, both provide entry/stop parameters to work with and, by extension, confirm buyer intent.
Today’s data points: US Prelim UoM Consumer Sentiment.
USD/JPY:
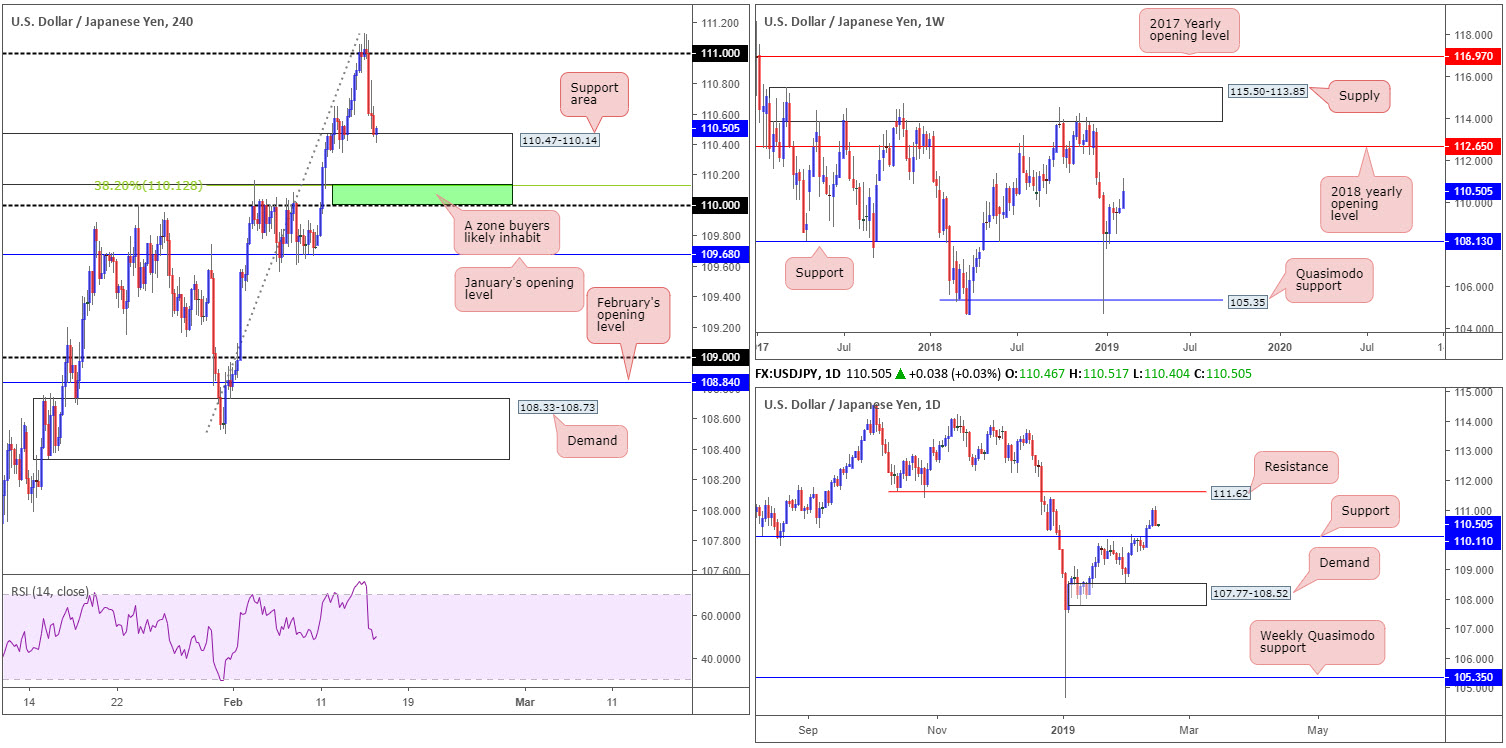
A sharp decline in US retail sales in December along with a negative reading for the US producer price index sent the USD/JPY pair sharply lower Thursday. Erasing all of Wednesday’s gains, the push south witnessed the H4 candles connect with a support area coming in at 110.47-110.14. Beneath this zone, traders may also want to pencil in daily support plotted at 110.11, shadowed closely by the 110 handle. Both levels boast relatively strong history, with the daily barrier positioned close by a 38.2% H4 Fibonacci support value at 110.12.
In terms of where the research team stand on the weekly timeframe, the unit is eyeing further upside towards the 2018 yearly opening level at 112.65.
Areas of consideration:
Having observed weekly action poised to attack higher levels, the green zone marked on the H4 timeframe between 110/110.12 (the round number 110, the daily support at 110.11 and the 38.2% H4 Fibonacci support at 110.12) is worthy of the watchlist this morning. The only caveat, nevertheless, is the possibility of a stop run materialising through 110 (common viewing around psychological numbers). To help avoid being stung, waiting for additional H4 candlestick confirmation to form is an idea. Not only does this confirm buyer intent, it provides traders entry and stop barriers to work with.
Today’s data points: US Prelim UoM Consumer Sentiment.
USD/CAD:
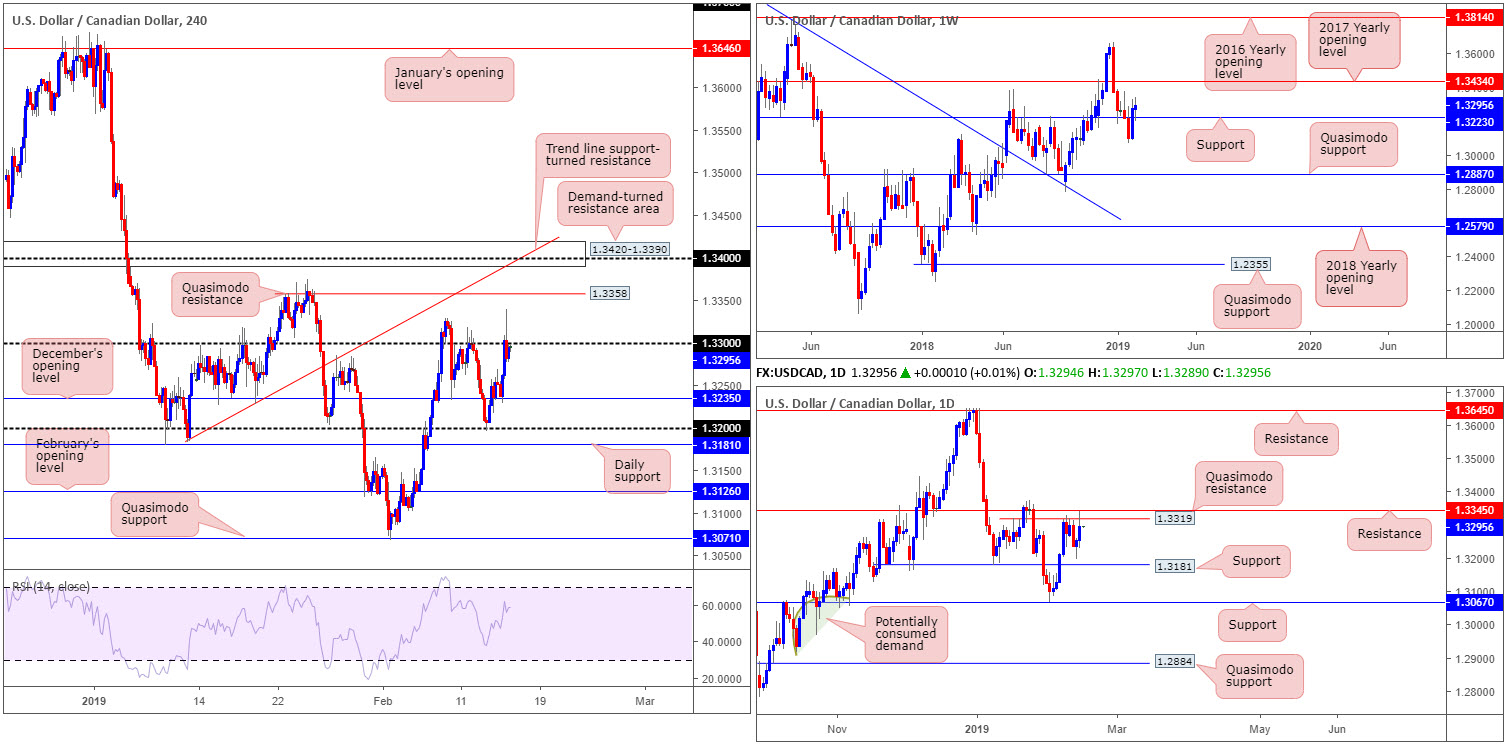
Kicking off this morning’s piece glancing over the weekly timeframe, support at 1.3223 remains firmly in the fold after so far surviving a retest this week. Assuming buyers remain in the driving seat, further upside towards the 2017 yearly opening level at 1.3434 could be in store. On the other side of the spectrum, though, daily movement is testing both a Quasimodo resistance at 1.3319 and a resistance level at 1.3345.
A closer reading on the H4 timeframe has the candles kissing the underside of 1.33, as we write. This came about following an advance off December’s opening level at 1.3235. Beyond 1.33, the next upside target now rests at Quasimodo resistance drawn from 1.3358.
Areas of consideration:
H4 traders, thanks to the unit breaking through 1.33 and likely tripping a truckload of sellers’ stop-loss orders, are likely eyeing a breakout play above 1.33 today, targeting the H4 resistance mentioned above at 1.3358. The only problem is although H4 structure exhibits potential to the upside, the daily Quasimodo resistance rests at 1.3319. This leaves almost no room for manoeuvre. While you could argue we have weekly price supporting higher prices, which is true, buying into daily resistance is still an incredibly chancy move. Would it not be better to place this market on the back burner until something more attractive is seen?
On account of the above, the research team labels this market flat today.
Today’s data points: US Prelim UoM Consumer Sentiment.
USD/CHF:
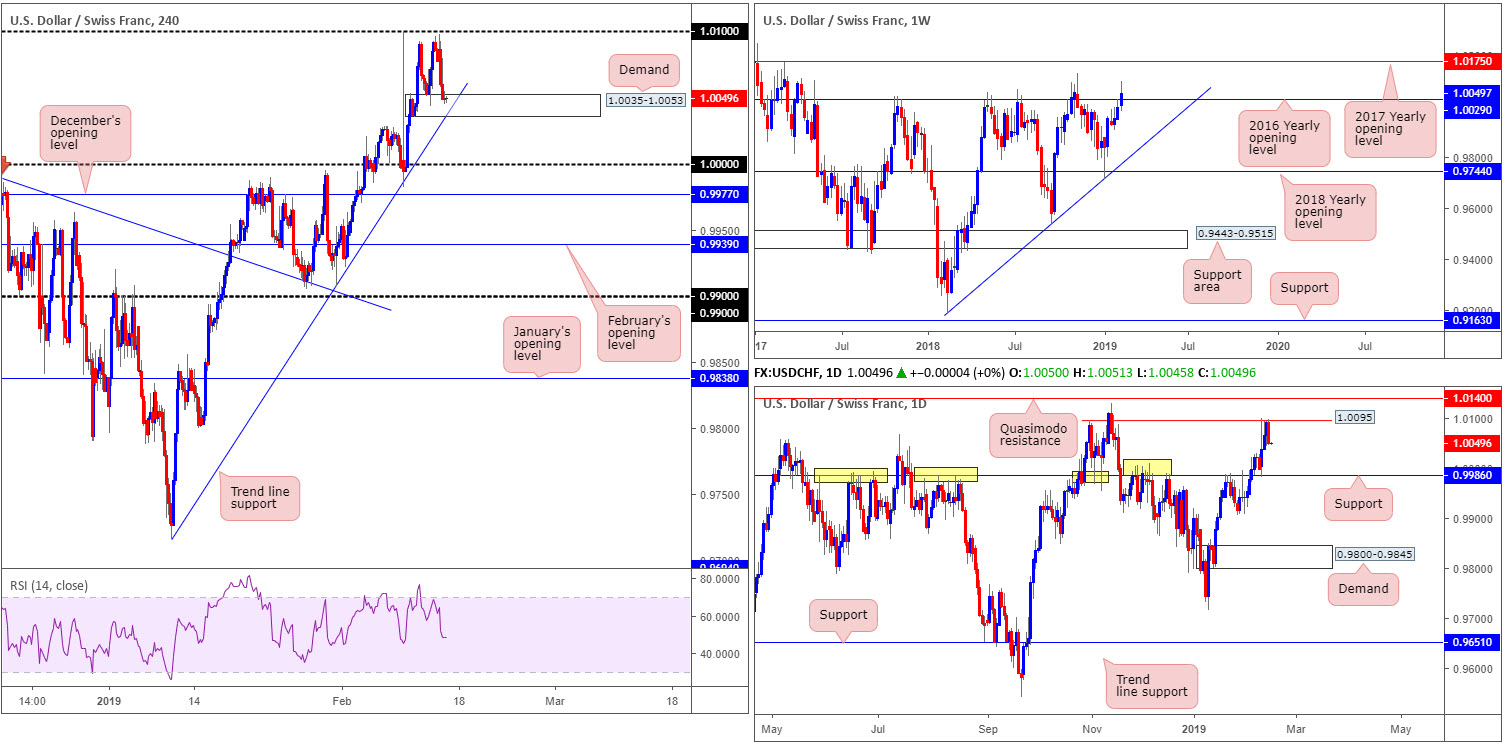
The USD/CHF surrendered ground a few pips south of its 1.01 handle Thursday, weighed on by lacklustre data out of the US. As is evident from the H4 chart, the next area of interest on this scale is found nearby in the shape of a trend line support (extended from the low 0.9716) that intersects with a tested demand zone at 1.0035-1.0053.
Technically speaking, yesterday’s selloff could have something to do with the fact price action tested a Quasimodo resistance at 1.0095. Note the move off this level printed a near-full-bodied bearish candle that now has eyes on a test of support coming in at 0.9986.
While weekly price is visibly attempting to establish some ground above the 2016 yearly opening level at 1.0029, the levels history as a resistance may draw in sellers.
Areas of consideration:
While the current H4 demand and intersecting trend line support is a tempting platform to initiate longs from, daily price trading from a Quasimodo resistance with room to move lower and weekly price tackling a monster of a resistance, will likely overthrow the H4 barriers.
An area likely on the radar for many traders is 1.0000 (parity – stop-loss orders can be planted below December’s opening level at 0.9977). The psychological mark applied to the H4 timeframe is seen 14 pips north of daily support mentioned above at 0.9986. The combination of these two levels offers strong support, which may bounce price higher. The reason for a bounce over a large move simply comes down to where we’re coming from on the weekly timeframe.
Today’s data points: US Prelim UoM Consumer Sentiment.
Dow Jones Industrial Average (DOW 30):
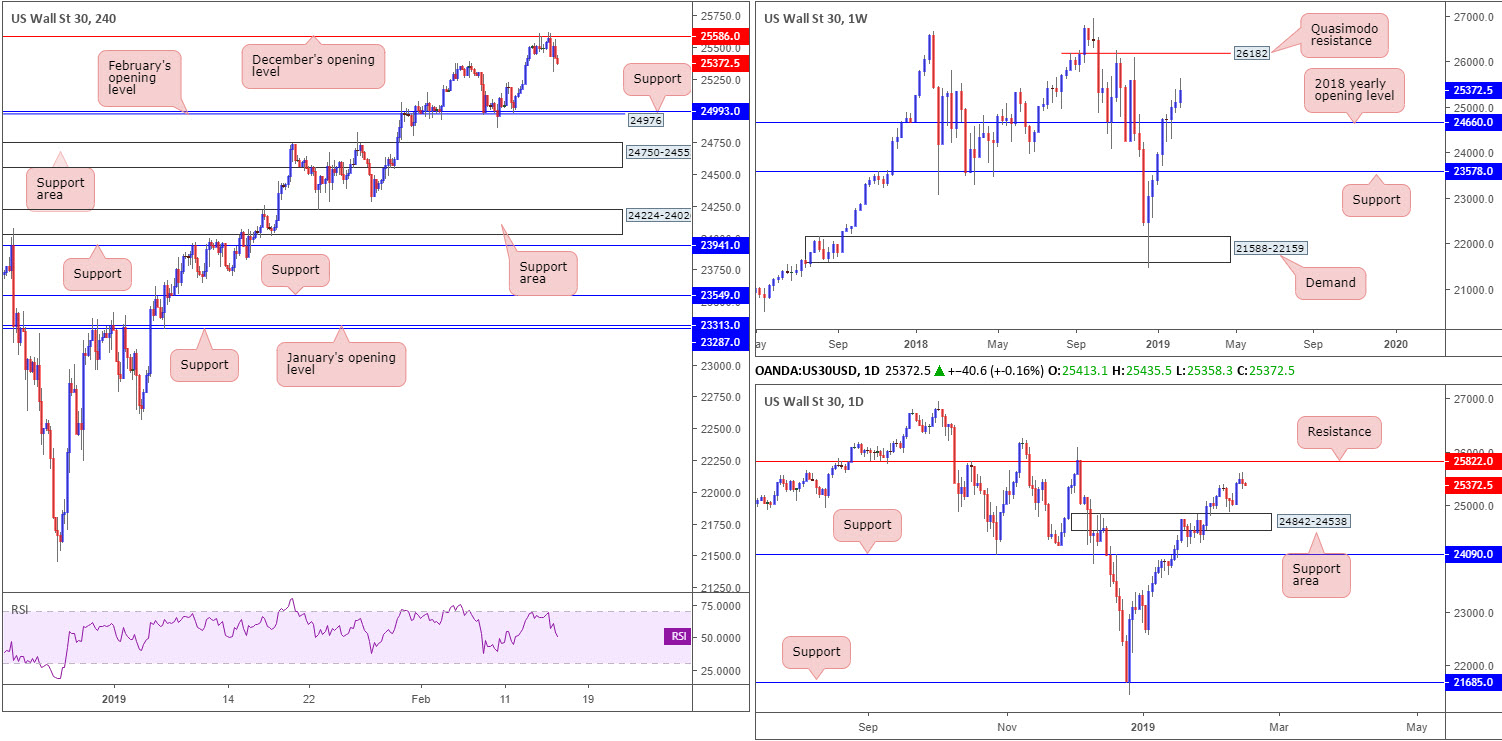
Disappointing macroeconomic data out of the US Thursday kept US equities on the losing side of the table. December’s opening level at 25586 on the H4 timeframe, as you can see, continues to offer the index resistance, with the next base of support not expected to emerge until reaching February’s opening level at 24993, followed closely by support at 24976.
Weekly price, on the other hand, continues to explore higher ground, with its next upside target not entering the fold until Quasimodo resistance at 26182. Despite this, daily flow could potentially throw a spanner in the works for weekly buyers as price is seen nearing resistance plotted at 25822.
Areas of consideration:
Longs from the H4 supports mentioned above at 24976/24993 are an option today should we reach this far south, given how well these barriers held price higher in recent trading. In spite of this, do remain cognizant of a possible fakeout through these level to nearby support area pictured at 24750-24555. As such, it may be an idea to consider waiting for additional bullish candlestick confirmation before pulling the trigger (entry and stop parameters can be defined according to the candlestick’s rules of engagement).
Today’s data points: US Prelim UoM Consumer Sentiment.
XAU/USD (GOLD):
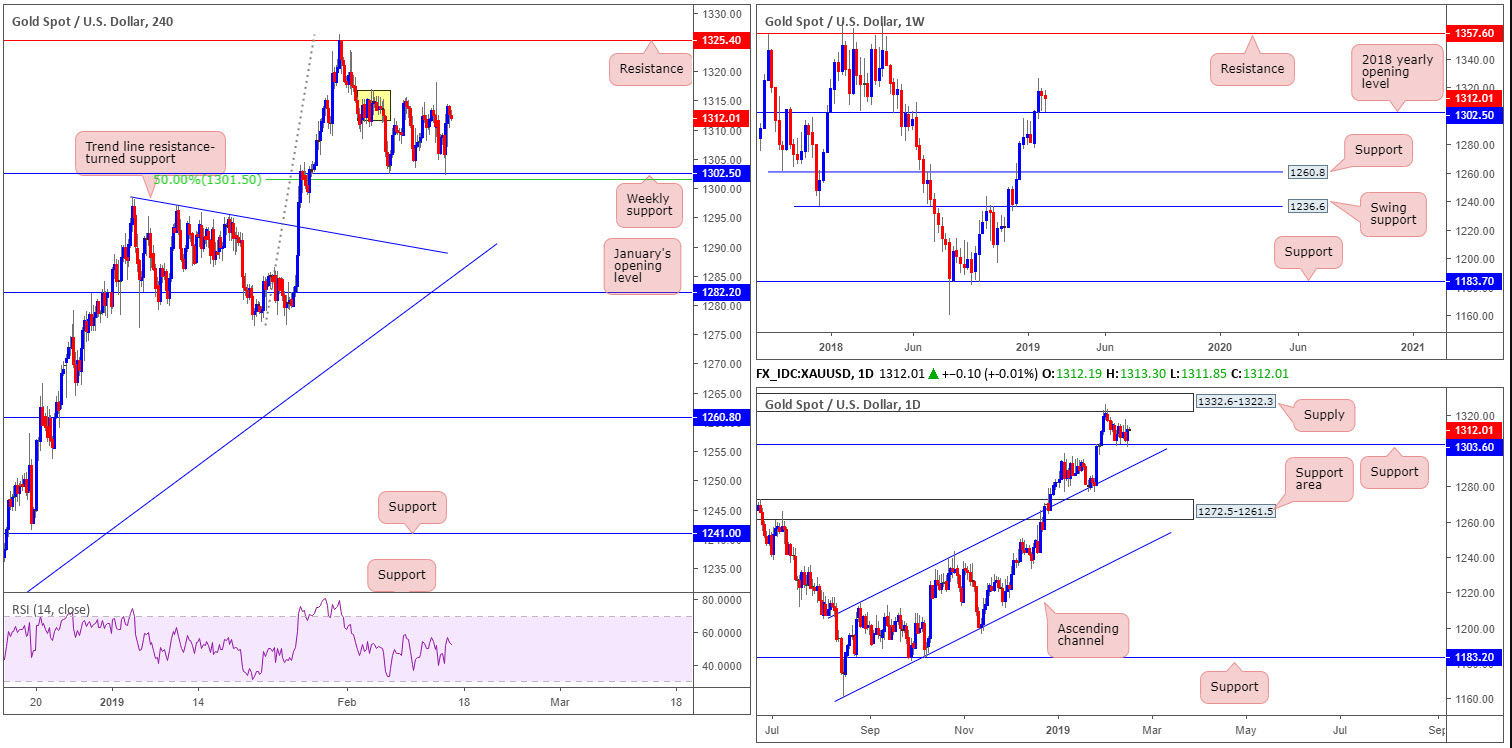
For those who read Thursday’s briefing you may recall the piece underlining that all three timeframes point to a possible upside move from the weekly support at 1302.5. A strong uptrend, combined with the noted weekly support, a daily support at 1303.6 and a H4 50.0% support value plotted at 1301.5, offered an incredibly strong floor of support. Yesterday’s report also highlighted H4 supply marked in yellow around 1316.9/1311.7 suffered a breach to the upside Wednesday, possibly unlocking the door towards H4 resistance at 1325.4.
As you can see, price behaved as expected and rebounded from the aforementioned weekly support level. Well done to any of our readers who managed to jump aboard.
Areas of consideration:
Traders who remain long may want to consider reducing risk to breakeven at this point, as some sellers may still inhabit the aforesaid H4 supply zone. The next upside target for buyers beyond here, however, is daily supply at 1332.6-1322.3, which happens to hold the H4 resistance level highlighted above within.
The use of the site is agreement that the site is for informational and educational purposes only and does not constitute advice in any form in the furtherance of any trade or trading decisions.
The accuracy, completeness and timeliness of the information contained on this site cannot be guaranteed. IC Markets does not warranty, guarantee or make any representations, or assume any liability with regard to financial results based on the use of the information in the site.
News, views, opinions, recommendations and other information obtained from sources outside of www.icmarkets.com.au, used in this site are believed to be reliable, but we cannot guarantee their accuracy or completeness. All such information is subject to change at any time without notice. IC Markets assumes no responsibility for the content of any linked site. The fact that such links may exist does not indicate approval or endorsement of any material contained on any linked site.
IC Markets is not liable for any harm caused by the transmission, through accessing the services or information on this site, of a computer virus, or other computer code or programming device that might be used to access, delete, damage, disable, disrupt or otherwise impede in any manner, the operation of the site or of any user’s software, hardware, data or property.


