EUR/USD:
Weekly Timeframe: The weekly timeframe shows that price recently spiked below (only by a few pips mind you) a weekly demand area coming in at 1.0499-1.0740. The question we would love an answer to is to whether this was a fakeout for higher prices, or consumption to go lower? Let’s take a look to see what the lower timeframes make of this…
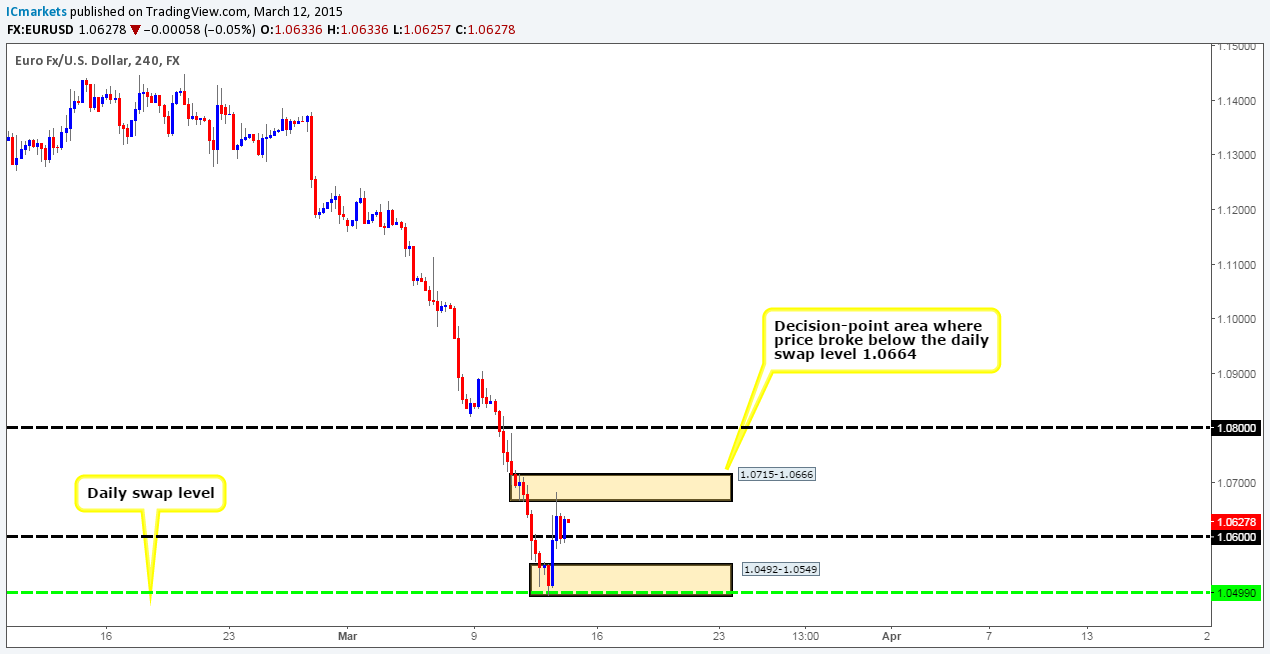
Daily Timeframe: The daily timeframe is not really offering us much more than the weekly timeframe since price is currently seen rebounding from the 1.0499 daily swap (support) level, which, as you can probably remember, is the low of the aforementioned weekly demand area. However, what the weekly timeframe is not showing us is the fact that the bounce seen from 1.0499 has pushed price up to the underside of a daily swap level positioned at 1.0664. A convincing push above here would likely pave the way north towards a daily supply area seen at 1.0905-1.0821.
4hr Timeframe: Looking at the 4hr timeframe, we can see that price is now retesting the 1.0600 handle, following a recent push into a fresh 4hr decision-point supply area seen at 1.0715-1.0666 (positioned just above the daily swap level 1.0664).
On the assumption that the buyers can hold the Euro above 1.0600 today, this will likely attract further buying power for a second attack of the aforementioned 4hr decision-point supply area. Our team has reported that a close above this area would, in effect, be our cue to begin watching for price to retest this zone as demand – take note of the clear run seen above to 1.0800! In addition to this, a close above this barrier would also likely confirm that the recent break below weekly demand could very well be a fakeout, since a clean close above this area would also, at the same time, take out the 1.0664 daily swap level, thus suggesting buying strength has entered the market.
With regards to selling, even if price breaks below 1.0600, risk/reward would be less than 1 from here down to 4hr demand at 1.0492-1.0549, which is not exactly tempting we have to be honest!

Current buy/sell orders:
- Buy orders: Flat (Predicative stop-loss orders seen at: N/A).
- Sell orders: Flat (Predicative stop-loss orders seen at: N/A).
GBP/USD:
Weekly Timeframe: The weekly chart shows that the GBP/USD is now trading just above a weekly swap level seen at 1.4832. This level, in our opinion, is quite a significant one since if you look to the left; you’ll notice that this price area was in fact the origin of a year-long uptrend seen back in mid-2013.
Daily Timeframe: At this point in time, the buyers and sellers are seen battling for position within a daily demand area coming in at 1.4812-1.4949, which, as you can probably see, encapsulates the aforementioned weekly swap level.
4hr Timeframe: The latest coming in from the 4hr timeframe shows price rebounded nicely from 1.4900. This move consequently forced the market to spike above the recently broken 4hr Quasimodo support level at 1.4970, into the psychological barrier 1.5000, which, as you can see, was clearly enough to support a sell off down to 1.4850 where supportive pressure is currently being seen.
Taking all the points above into consideration, our team has reported that no shorts will take place until price convincingly closes below the aforementioned weekly swap level. Conversely, should cable close above the 1.4900 number sometime today, we’ll begin watching for price to retest this level as support, and drive north back up to 1.4970.

Current buy/sell orders:
- Buy orders: Flat (Predicative stop-loss orders are seen at: N/A).
- Sell orders: Flat (Predicative stop-loss orders are seen at: N/A).
AUD/USD:
Weekly Timeframe: The weekly timeframe shows that buying interest is currently being seen from within weekly demand at 0.7449-0.7678. In addition to this, we can also see further support coming in from a long-term weekly trendline extended from the low 0.4775 seen way back in 2001.
Daily Timeframe: A clear reaction was seen yesterday around the upper limits of daily demand seen at 0.7449-0.7598 (located deep within the aforementioned weekly demand). Consequent to this, price has closed above a daily swap level coming in at 0.7691, and as a result, likely cleared the path north towards daily supply seen at 0.7859-0.7789.
4hr Timeframe: Recent developments from the 4hr timeframe show price closed above 0.7600, and retested this number with a (deep) bullish pin bar candle. This move subsequently saw the Aussie Dollar rocket north, breaking above 0.7682 and testing a fresh 4hr supply area at 0.7738-0.7714, which, as you can probably see, has now forced the market into consolidation.
A breakout north from here would likely force the market to test a 4hr swap level seen just above at 0.7756. Shorting this level is not really a place we’d consider high probability since the 4hr supply (0.7738-0.7714), which would be considered demand at that point, could potentially repel the market and cause a loss. With that being said, the area that has really caught our eye for shorts recently is seen above here, within the green circle at 0.7802, the reasons for why are as follows:
- Friday’s NFP sell off began here, which means there could be unfilled sell orders left around this zone.
- Converging downtrend line extended from the high 0.7900.
- Located within daily supply at 0.7859-0.7789.
On the other hand, should a close below 0.7682 be seen today, we’ll then shift our attention to begin looking for price to retest this level as resistance, since there’s very little, as far as we can see, stopping price from plunging down to 0.7600 from here.

Current buy/sell orders:
- Buy orders: Flat (Predicative stop-loss orders seen at: N/A).
- Sell orders: 0.7802 [Tentative – confirmation required] (Predicative stop-loss orders seen at: dependent on where one confirms this level).
USD/JPY:
Weekly Timeframe: The weekly timeframe shows that price is currently lingering just below a major weekly Quasimodo resistance level coming in at 122.18.
Daily Timeframe: Looking at the daily picture, we can see that price remains consolidating just below a daily supply area visible at 122.61-121.54 (encapsulates the aforementioned weekly Quasimodo resistance level). Assuming that further selling is seen from here, price will very likely visit the daily swap level positioned below at 120.45.
4hr Timeframe: For those who read our previous report on the USD/JPY, you may recall us mentioning to watch for confirmed sells around the 4hr supply area at 122.01-121.67 down to 121.00. Well done to anyone who got in on this move!
So that we’re all on the same page here, let’s just quickly recap. The weekly chart shows price lingering JUST BELOW a weekly Quasimodo resistance level; while the daily chart has hit supply already (see above). Therefore, where does this leave us on the 4hr timeframe? Taking a closer look, we believe that the 4hr supply at 122.01-121.67 could very well be a fake. What we mean by this is price reacted nicely at this area already, thus giving traders the confidence to short here once again. However, lurking just above this level, as you can see in green, is the aforementioned weekly Quasimodo resistance level just begging to see some action. Therefore, this 4hr supply may have been planted here by pro money to attract millions of traders to place shorts here again, and set their buy stops where? Right above the zone, which will be a beautiful pocket of liquidity for well- funded traders to sell into from the weekly level. With this in mind, we have decided to set a pending sell order at 122.16 to try and catch this potential fakeout.
Conversely, if price does not do the above, and continues to trade south, a close below 121.00 is what we’ll be looking for since this will open the trapdoor down towards the daily swap level at 120.45. The reason we believe price would drop this far is simply because demand has already likely been consumed – take note of the two obvious demand consumption tails seen marked with blue arrows at 120.83/120.62.

Current buy/sell orders:
- Buy orders: Flat (Predicative stop-loss orders seen at: N/A).
- Sell orders: 122.16 (Predicative stop-loss orders seen at: 122.55).
