
EUR/USD:
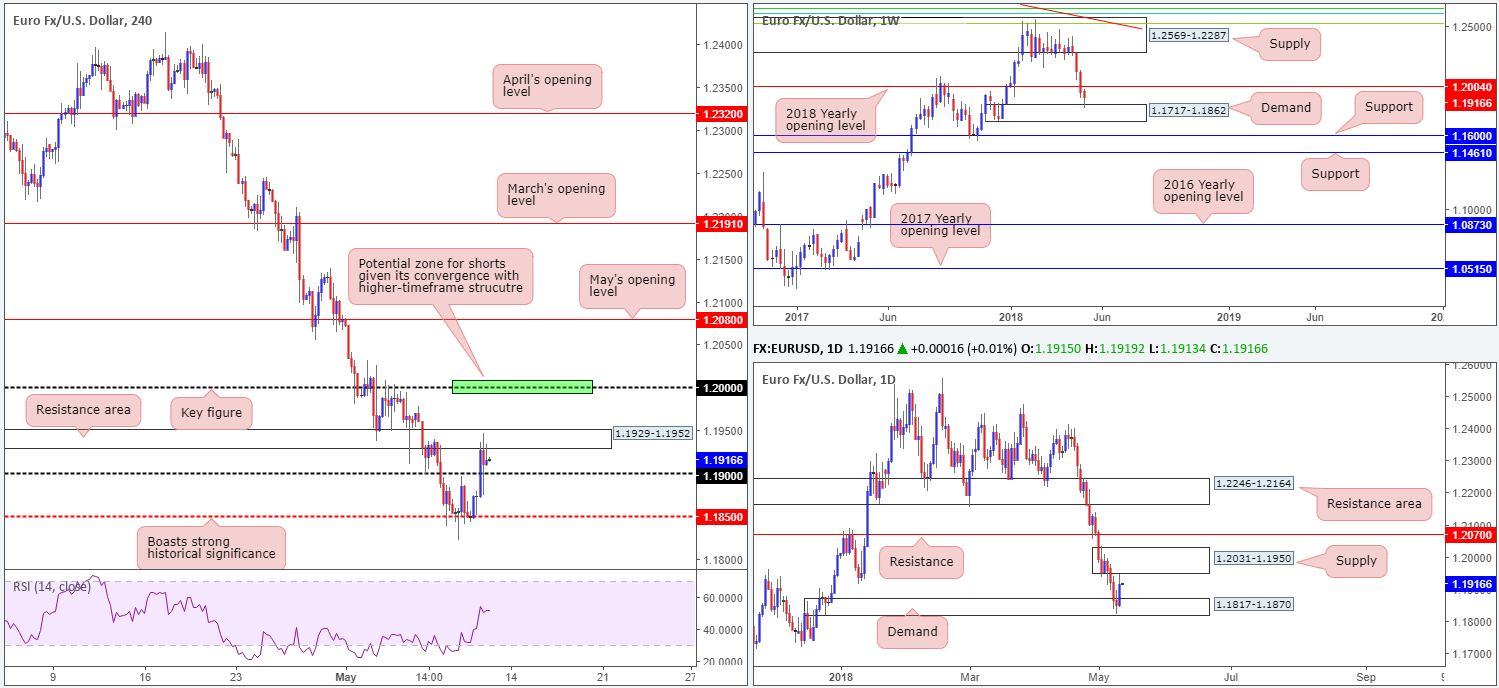
Breaking a four-day bearish phase, the single currency, as you can see, recovered in strong fashion on Thursday. In response to lower-than-expected US inflation numbers, H4 price reclaimed the 1.19 landmark and addressed a H4 resistance area plotted at 1.1929-1.1952. In addition to this, traders may also want to pencil in that this H4 zone is in fact glued to the underside of a daily supply zone printed at 1.2031-1.1950.
As highlighted in Thursday’s report, weekly demand at 1.1717-1.1862 is a vital area to be aware of in this market – note this area’s strong momentum to the upside. According to this scale, we feel yesterday’s test of this zone could attract additional buying and eventually see the unit retest the underside of the 2018 yearly opening level at 1.2004. Adding weight to the possibility of further upside is monthly supply seen on the US dollar index at 95.13-92.75.
Potential trading zones:
While weekly action portends further upside, traders need to remain cognizant of the current daily and H4 resistances.
A H4 close beneath 1.19 would, in our opinion, be considered a bearish cue and suggest that the bears may be hungry for another test of daily demand at 1.1817-1.1870/H4 mid-level support 1.1850. This is not a move we would highlight as a potential trade, however, since weekly price still shows room to appreciate.
A violation of the current H4 resistance area, on the other hand, exposes the key figure 1.20. Note that this psychological level is fixed within the walls of the current daily supply and converges nicely with the 2018 yearly opening level mentioned above on the weekly timeframe at 1.2004. Therefore, this could be an area to note down for potential shorting opportunities when, or indeed if, price reaches this point. Stop-loss orders, technically speaking are best placed above the confines of daily supply (1.2031).
Data points to consider today: ECB President Draghi speaks; US prelim UoM consumer sentiment.
GBP/USD:
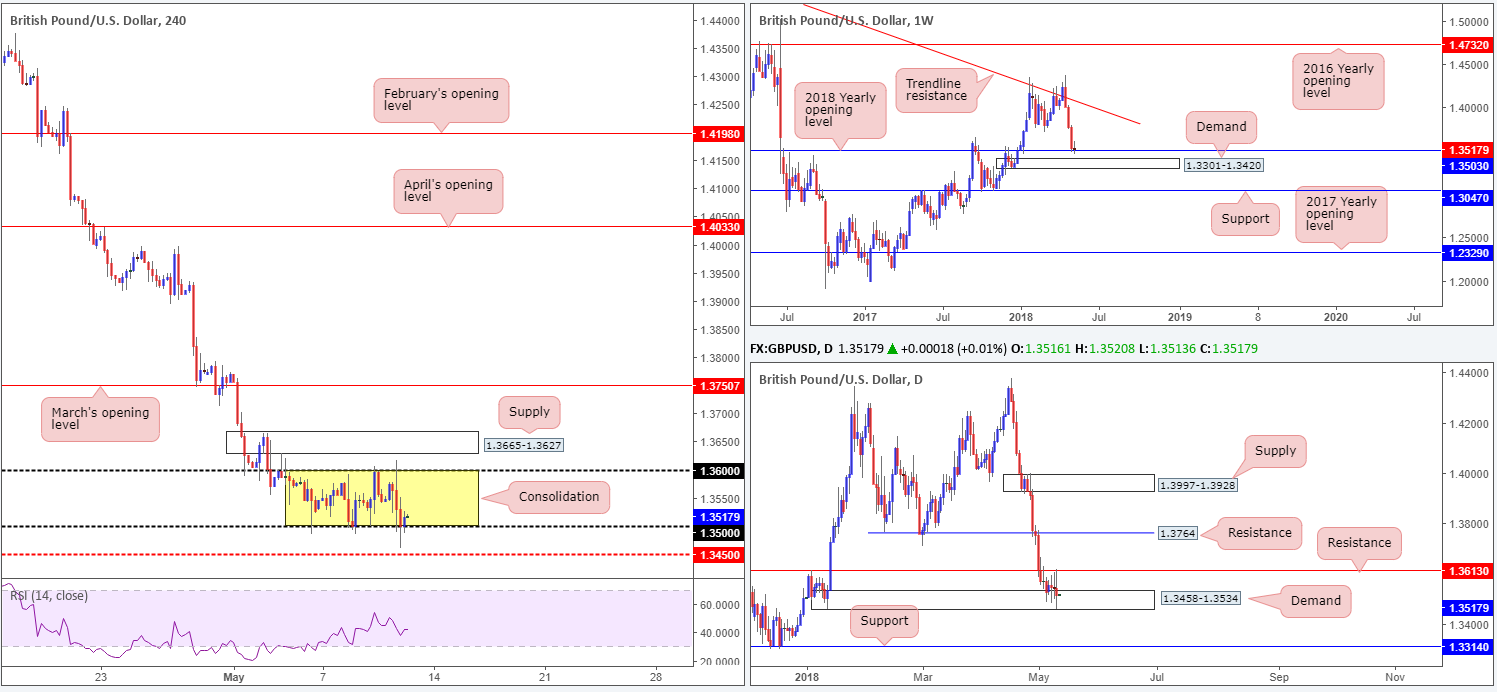
The British pound tumbled lower on Thursday following the BoE’s decision to lower inflation forecasts and keep interest rates unchanged. The move, as you can see, eventually struck fresh lows of 1.3460 and brought the 1.35 handle back into the fight on the H4 timeframe.
Despite yesterday’s downside move, H4 price continues to emphasize a consolidative process between 1.36/1.35. This is also bolstered by a surrounding daily demand zone at 1.3458-1.3534 and daily resistance coming in at 1.3613. Also worth noting is that the current consolidation is taking place from the 2018 yearly opening level seen on the weekly timeframe at 1.3503.
Potential trading zones:
Through the lens of a technical trader, the pendulum still favors a correction to the upside according to weekly structure. However, the clear downtrend this market is in right now could be too much for the buyers to take on!
On account of current structure, traders have the opportunity to trade the range seen on the H4 timeframe (1.36/1.35). We would strongly advise placing stop-loss orders beyond the surrounding daily zones, though, as this will help avoid a nasty surprise in the form of a fakeout, which are all too common around psychological numbers!
Data points to consider today: US prelim UoM consumer sentiment.
AUD/USD:
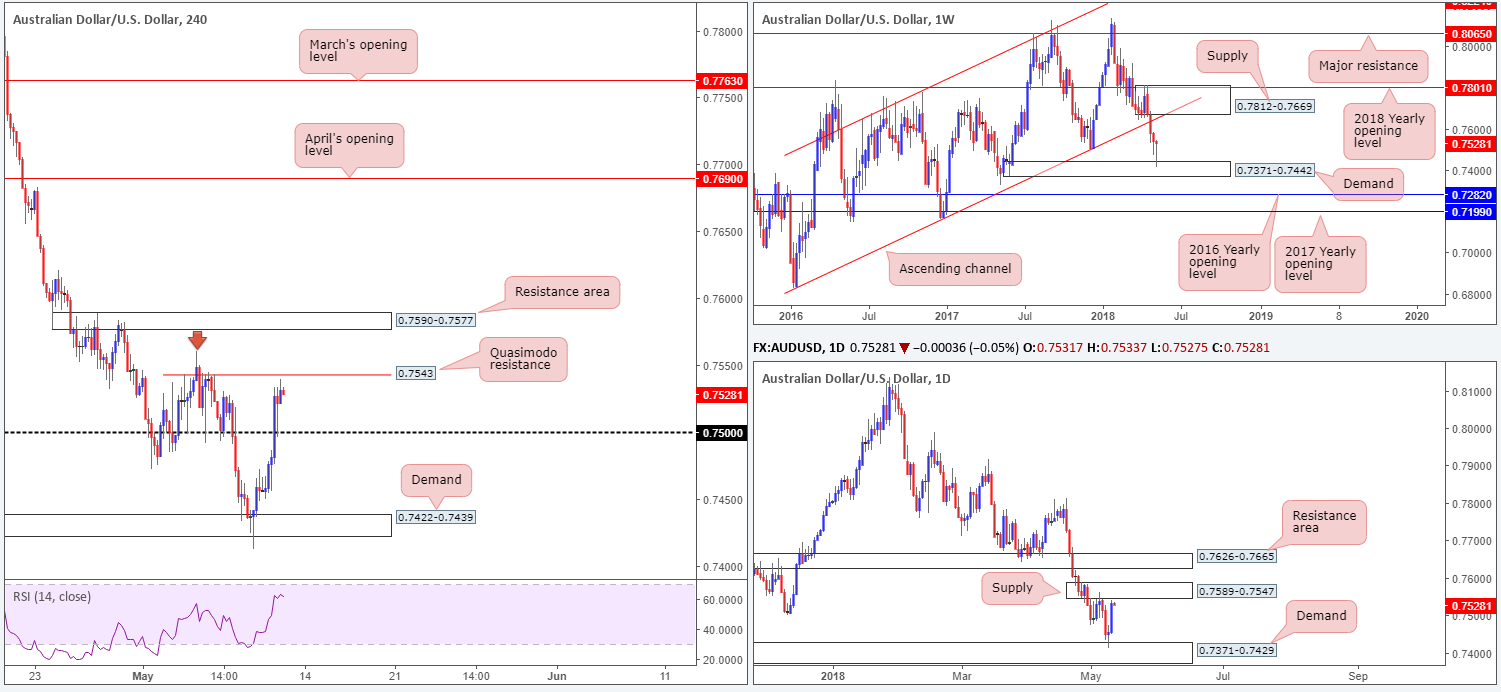
As a noted top performer among G10 currencies, the Australian dollar advanced strongly against its US counterpart during Thursday’s segment. On the back of strong commodity prices, a deterioration in USD demand and AUD/NZD jumping above 1.08 (initial move came after RBNZ decision), the AUD/USD ended the day firmly above the 0.75 region.
The technicals also appear to have played a key role in yesterday’s movement. The commodity currency is seen strongly bid from weekly demand positioned at 0.7371-0.7442 and its partner demand captured on the daily timeframe at 0.7371-0.7429. This was all noted in Thursday’s report.
Although momentum to the upside is incredibly strong right now, traders need to remain aware of the overall picture and what it is telling us. H4 price is seen nearing a H4 Quasimodo resistance at 0.7543, with the head of this formation (marked with a red arrow) bolstered by a nearby daily supply at 0.7589-0.7547. Therefore, collectively these areas could hamper further upside today.
Potential trading zones:
Overall, we do believe Aussie bulls have more gas left in the tank. Weekly price shows room to trade as far north as weekly supply plotted at 0.7812-0.7669. On top of this, let’s also remember that there is monthly supply seen in motion on the US dollar index at 95.13-92.75.
Nevertheless, this does not mean we will not experience corrective pullbacks in the interim. Traders might want to prepare for the possibility of a downside move off of the current H4 Quasimodo resistance, owing to its relationship with daily supply. Ideally, though, to keep the bullish vibe alive we would not want to see the H4 candles close beneath 0.75. For that reason, intraday shorts coming off 0.7543 should consider tightening up once/if 0.75 comes into play.
Data points to consider today: US prelim UoM consumer sentiment.
USD/JPY:
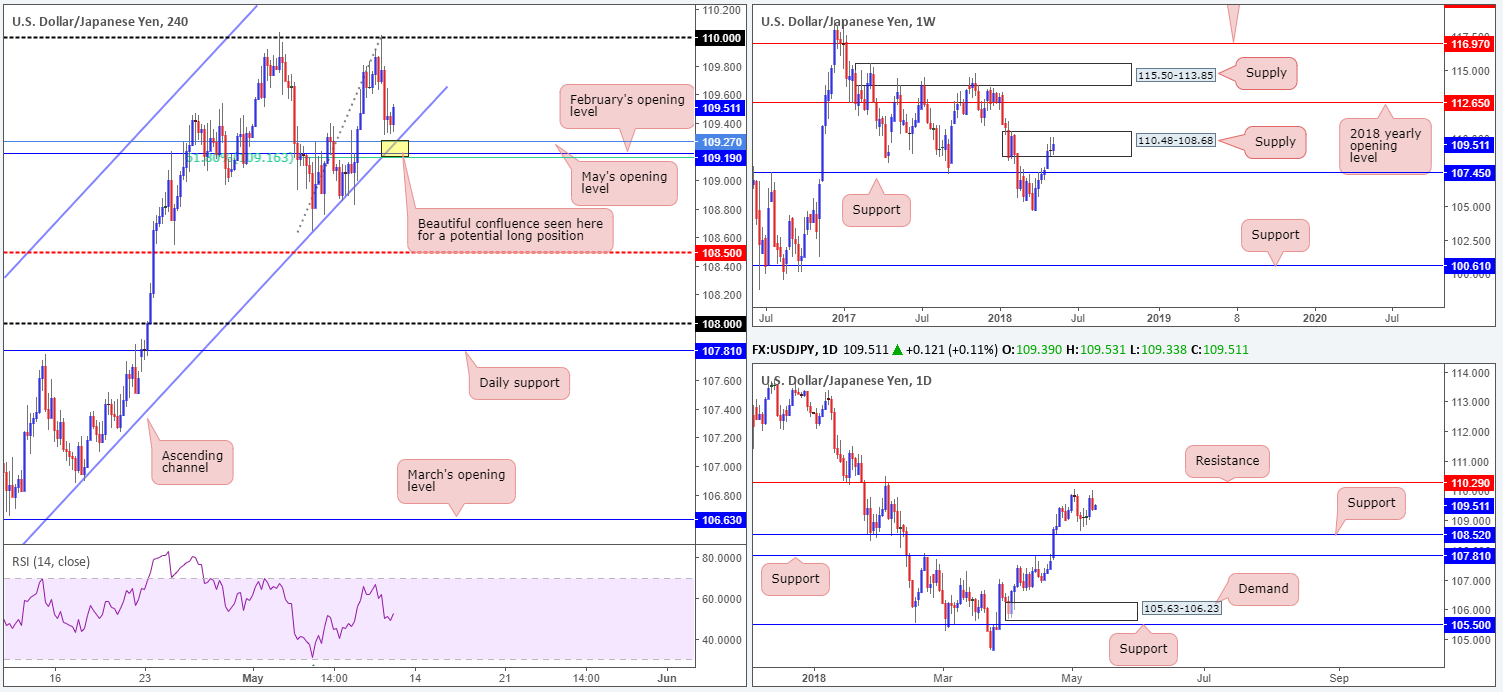
The safe-haven Japanese yen prospered on the back of retreating US Treasury yields and a miss on US inflation figures on Thursday. As is evident from the H4 timeframe, the 110 handle capped upside for the second time this month and concluded trade bottoming just north of 109.19/109.27: February and May’s opening levels and a H4 channel support extended from the low 104.62.
On the bigger picture, weekly supply at 110.48-108.68 continues to remain in the fight. A topside breach of this base clearly exposes the 2018 yearly opening level at 112.65. Daily movement, on the other hand, shows clean resistance remains within the noted weekly supply marked at 110.29.
Potential trading zones:
The area that jumps out at us this morning comes in on the H4 timeframe between 109.16/109.27 – yellow zone (comprised of the monthly opening levels mentioned above, the noted H4 channel support and a 61.8% H4 Fib support value at 109.16). Although the confluence here is strong, and a bounce higher is likely to take place, remember that we are trading within weekly supply. To that end, aggressive trade management is advised should you manage to pin down a long from 109.16/109.27 today.
Data points to consider today: US prelim UoM consumer sentiment.
USD/CAD:
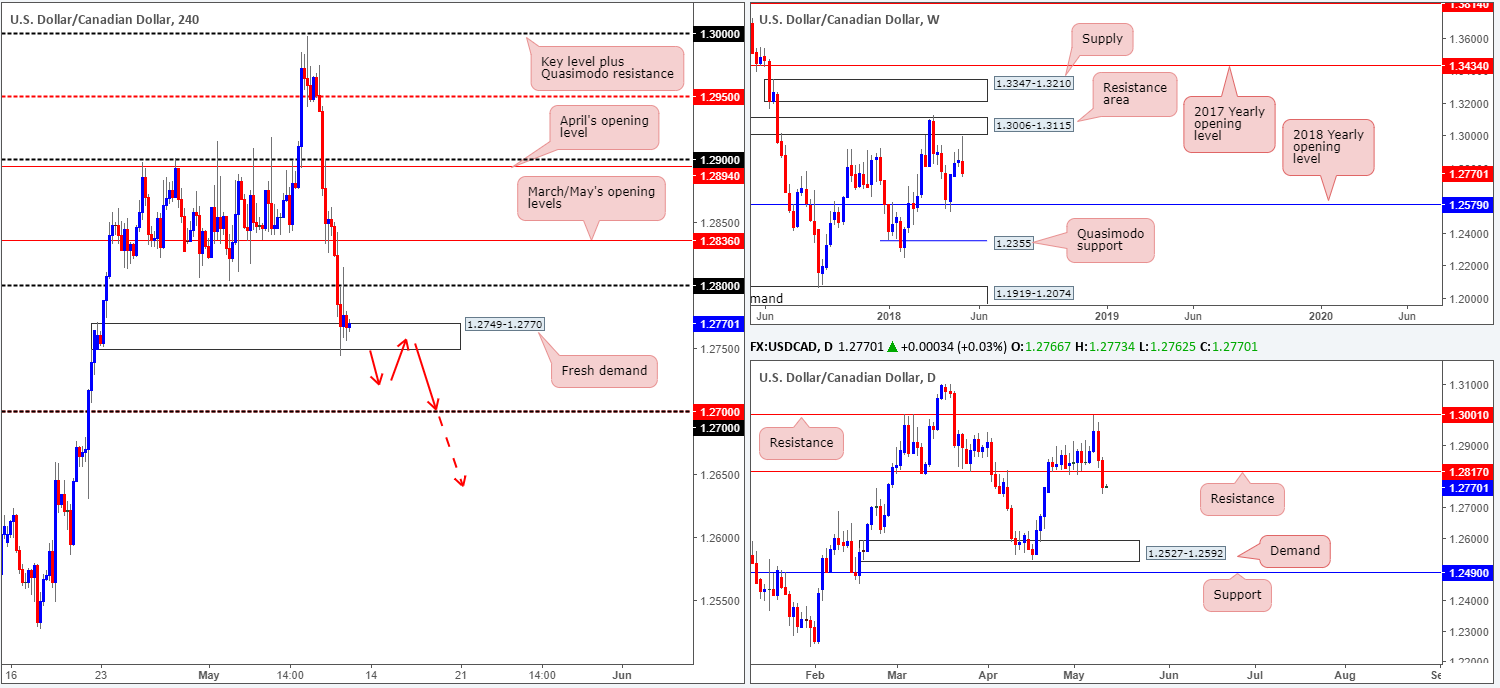
The USD, as you can see, registered its second consecutive daily loss against its Canadian counterpart on Thursday. Engulfing both March/May’s opening levels at 1.2836 and the 1.28 handle on the H4 timeframe, the pair concluded the day testing a fresh H4 demand zone based at 1.2749-1.2770. As expected, a bullish response materialized from this area, but appears to be somewhat overwhelmed on selling interest located at 1.28. Also worthy of note is the H4 RSI indicator is currently displaying nice-looking divergence.
According to the weekly timeframe, this market could be in for more downside yet as the next support target does not come into view until we reach the 2018 yearly opening level at 1.2579. In conjunction with weekly flow, daily price recently obliterated a daily support level at 1.2817 (now acting resistance). The next port of call on this scale does not come onto the radar until we reach demand placed at 1.2527-1.2592, which also happens to encapsulate the noted 2018 level.
Potential trading zones:
Although we absolutely love fresh supply and demand areas, trading the current H4 demand is precarious. Not only has it already suffered a minor breach to the downside, both weekly and daily timeframes indicate further selling could be in store! Therefore, trade this zone with caution.
In the event of a decisive H4 close beyond the noted H4 demand, the 1.27 handle is likely the next support on the hit list. A retest to the underside of the broken demand as resistance (as per red arrows), therefore, could open up a possible shorting opportunity. Given higher-timeframe structure, though, we’d ultimately be looking for 1.26 as a final take-profit target.
Data points to consider today: US prelim UoM consumer sentiment; Canadian employment data; Gov. Council member Wilkins speaks.
USD/CHF:
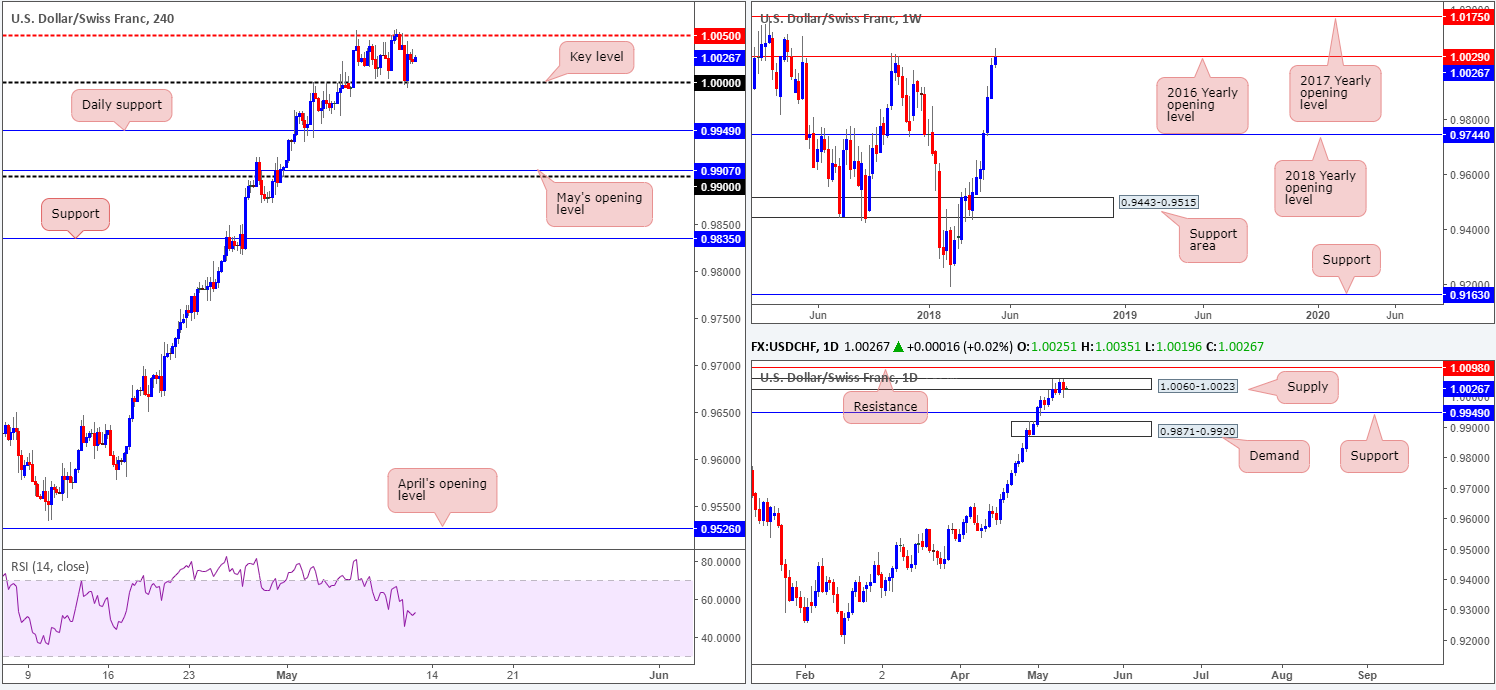
Following a modest bout of selling off the H4 mid-level resistance at 1.0050, parity (1.0000) was brought into the fray during yesterday’s movement which held beautifully as support. To those looking at only the H4 timeframe, this would have likely been a textbook long play given the trend. As weekly price is seen trading off the 2016 yearly opening level at 1.0029 and daily price remains within supply at 1.0060-1.0023, though, the buyers could potentially struggle to run higher with this!
Just to be clear, the highlighted higher-timeframe structures is not to say that any longs in play from 1.0000 will not work out, it is just something worthy of taking into account.
Potential trading zones:
At current price, this is what we have noted down currently:
A H4 close above 1.0050 followed up with a retest as support offers a potential intraday long play to consider, targeting daily resistance at 1.0098/1.01 handle.
A H4 close beneath 1.0000 followed up with a retest as resistance, on the other hand, has the daily support level at 0.9949 to target.
Data points to consider today: US prelim UoM consumer sentiment.
DOW 30:
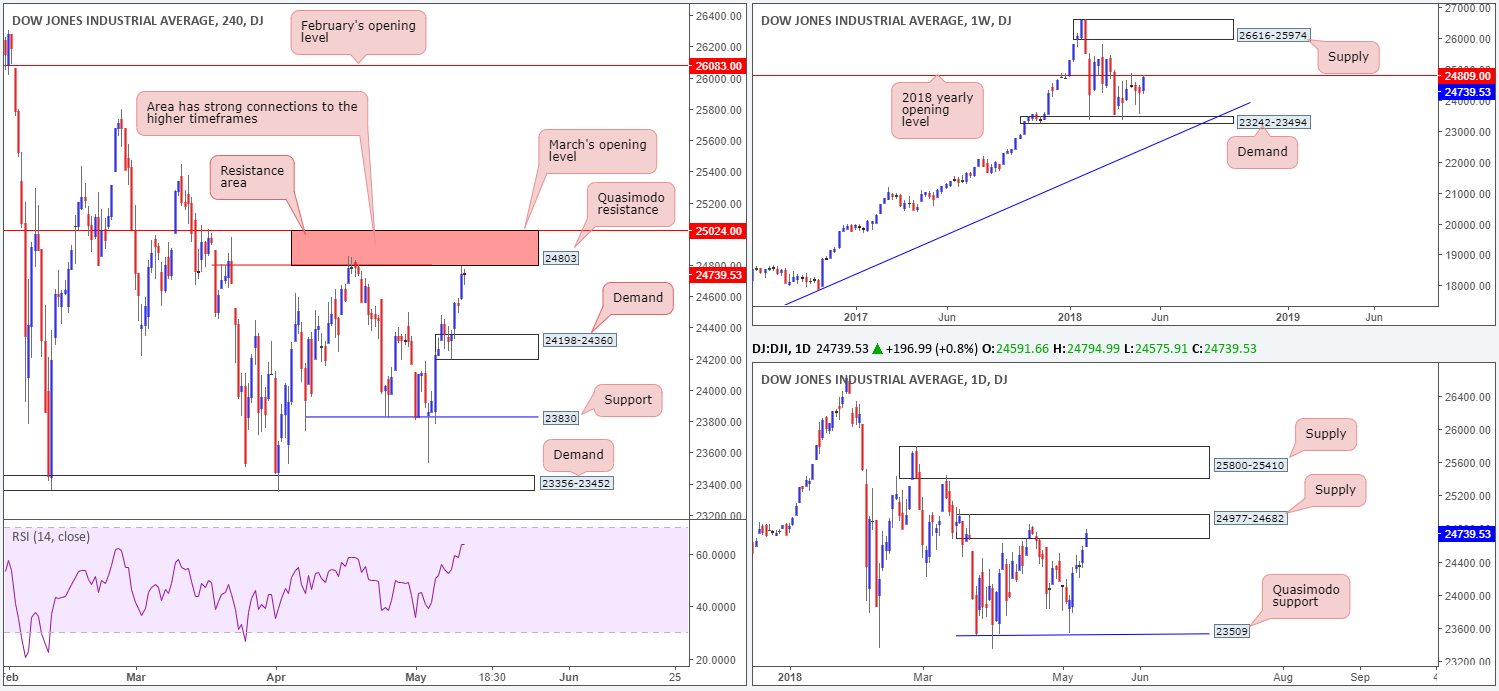
US equities printed another day of gains on Thursday amid easing inflation fears and a firmer risk appetite. The H4 supply area at 24579-24448 was, as expected, taken out (now acting support area) and therefore cleared the path north for the index to cross swords with a H4 resistance zone marked in red from 25024/24803 (comprised of March’s opening level and a H4 Quasimodo resistance). This is an area the team has been making a lot of noise about recently. The reason behind this comes down to its connections with daily supply noted at 24977-24682,and also due to the H4 zone housing the 2018 yearly opening level at 24809 seen on the weekly timeframe.
Potential trading zones:
Keeping it Simple Simon this morning, should H4 price enter the noted red area of resistance seen on the H4 timeframe and chalk up a full or near-full-bodied H4 bearish candle, then this could be time to begin thinking about shorts. Should the above come to fruition, the initial downside target to be aware of can be seen in the shape of a H4 demand base located at 24198-24360.
Data points to consider today: US prelim UoM consumer sentiment.
GOLD:
Across the board, USD demand diminished on Thursday, influenced by less-than-stellar US inflation numbers along with the fact that the currency is seen trading from a strong-looking monthly supply zone seen on the US dollar index at 95.13-92.75.
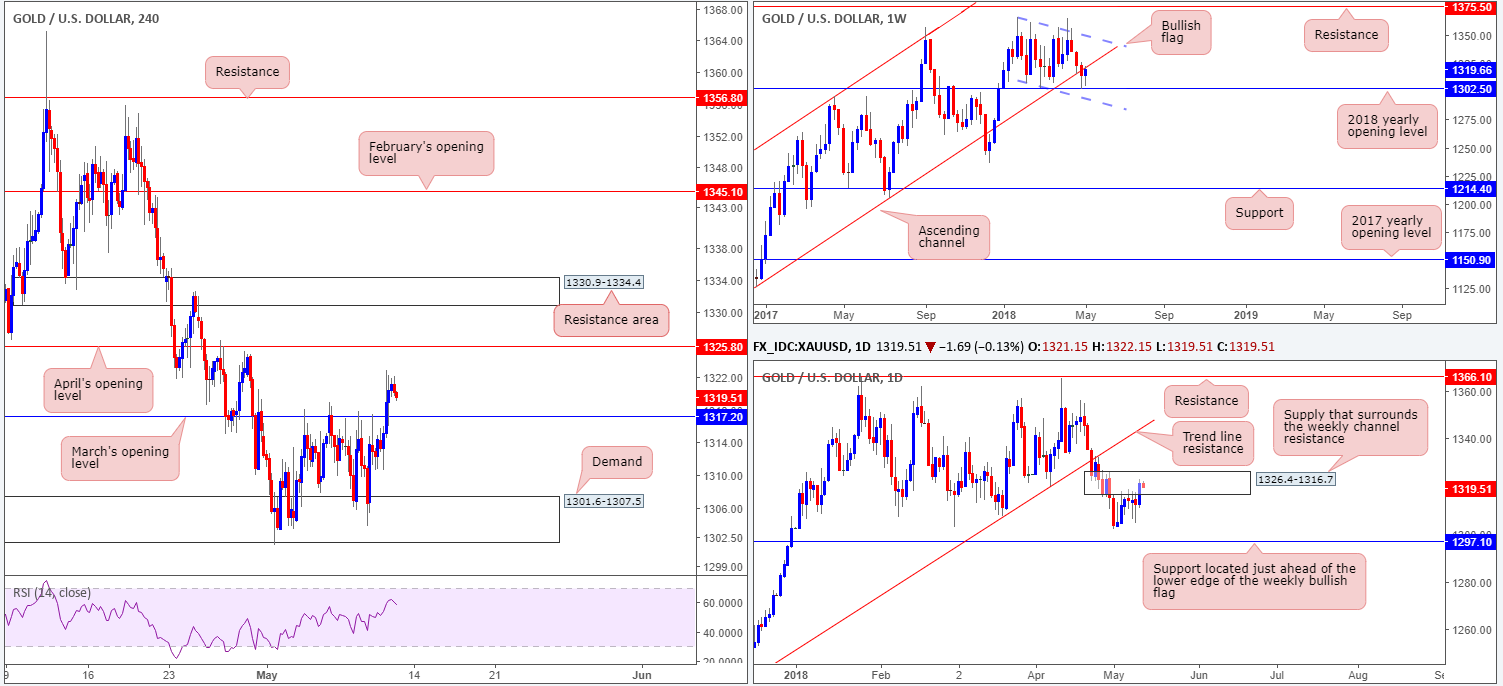
March’s opening level seen on the H4 timeframe at 1317.2 was firmly taken out during the course of yesterday’s trade, consequently exposing April’s opening level at 1325.8. Does this give rise to a potential retest (long) play at 1317.2? Not necessarily! This is because daily price resides within the walls of a daily supply zone printed at 1326.4-1316.7, which surrounds a weekly channel resistance taken from the low 1122.8 (currently being tested). Therefore, sellers are likely looking to get active.
Potential trading zones:
April’s opening level mentioned above at 1325.8 could be an area to consider for shorting opportunities today, as it is firmly positioned within the upper limit of the said daily supply.
While stop-loss orders are best positioned above the daily supply (1326.4), traders may want to contemplate waiting for a H4 bearish rotation candle (preferably a full-bodied formation) to form before pulling the trigger (stops to be positioned above the candle’s wick). This is simply due to how close the monthly opening level is positioned to the top edge of the aforementioned daily supply!
The first take-profit target from this angle falls in at 1317.
This site has been designed for informational and educational purposes only and does not constitute an offer to sell nor a solicitation of an offer to buy any products which may be referenced upon the site. The services and information provided through this site are for personal, non-commercial, educational use and display. IC Markets does not provide personal trading advice through this site and does not represent that the products or services discussed are suitable for any trader. Traders are advised not to rely on any information contained in the site in the process of making a fully informed decision.
This site may include market analysis. All ideas, opinions, and/or forecasts, expressed or implied herein, information, charts or examples contained in the lessons, are for informational and educational purposes only and should not be construed as a recommendation to invest, trade, and/or speculate in the markets. Any trades, and/or speculations made in light of the ideas, opinions, and/or forecasts, expressed or implied herein, are committed at your own risk, financial or otherwise.
The use of the site is agreement that the site is for informational and educational purposes only and does not constitute advice in any form in the furtherance of any trade or trading decisions.
The accuracy, completeness and timeliness of the information contained on this site cannot be guaranteed. IC Markets does not warranty, guarantee or make any representations, or assume any liability with regard to financial results based on the use of the information in the site.
News, views, opinions, recommendations and other information obtained from sources outside of www.icmarkets.com.au, used in this site are believed to be reliable, but we cannot guarantee their accuracy or completeness. All such information is subject to change at any time without notice. IC Markets assumes no responsibility for the content of any linked site. The fact that such links may exist does not indicate approval or endorsement of any material contained on any linked site.
IC Markets is not liable for any harm caused by the transmission, through accessing the services or information on this site, of a computer virus, or other computer code or programming device that might be used to access, delete, damage, disable, disrupt or otherwise impede in any manner, the operation of the site or of any user’s software, hardware, data or property.


