
Lower timeframe confirmation: simply means waiting for price action on the lower timeframes to confirm direction within a higher timeframe area. For example, some traders will not enter a trade until an opposing supply or demand area has been consumed, while on the other hand, another group of traders may only need a trendline break to confirm direction. As you can probably imagine, the list is endless. We, however, personally prefer to use the two methods of confirmation mentioned above in our trading.
EUR/USD:
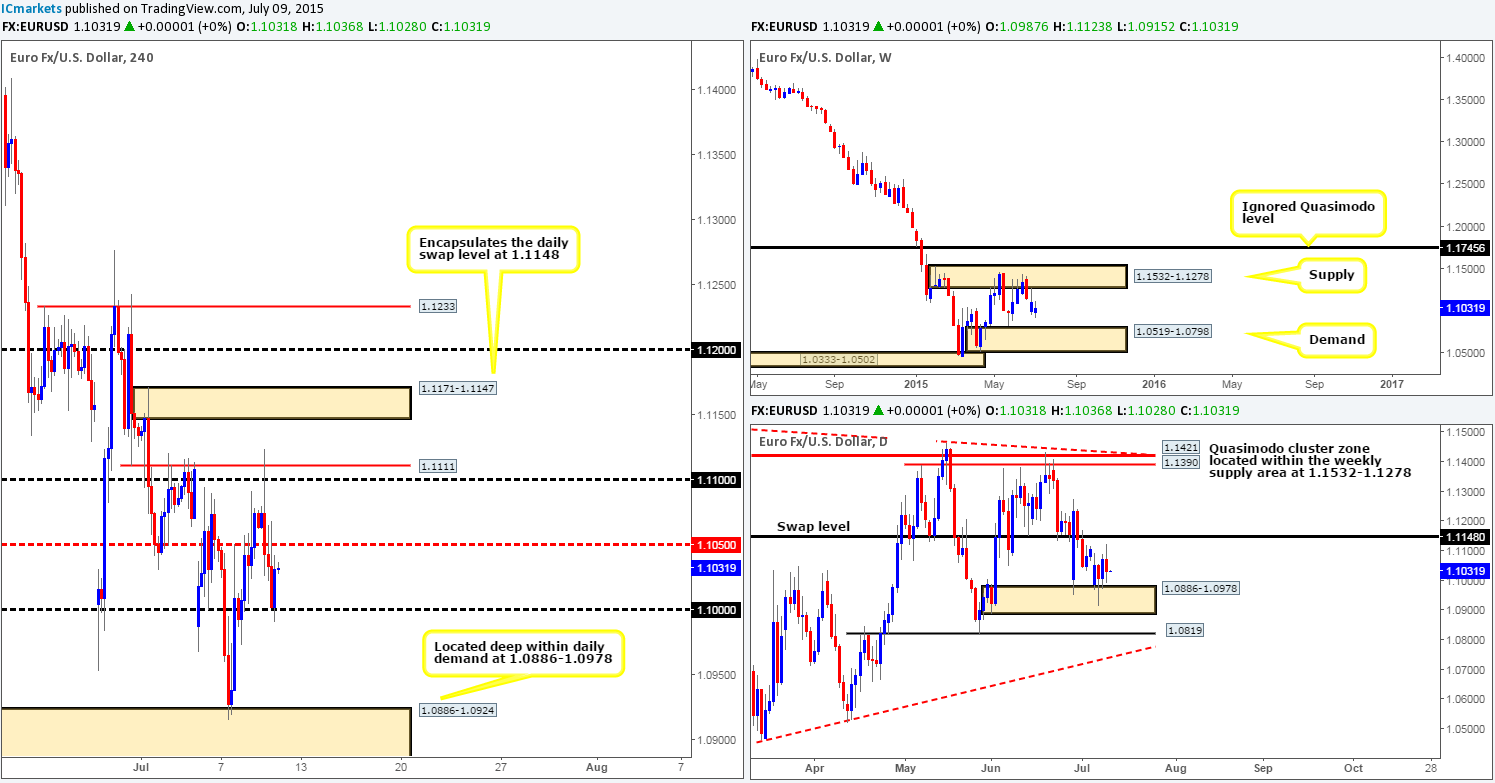
After price shook hands with the 1.1100/1.1111 barrier yesterday, a strong wave of offers came into the market. This saw the mid-level number 1.1050 taken out and retested as resistance before price continued plummeting towards 1.1000, which as you can clearly see has so far held firm. Fundamentally, we believe this decline in value was caused by the lack of Greek news regarding a bailout proposal.
Concerning the higher timeframes, we are seeing very little harmony at this point. The weekly timeframe is still somewhat range bound between weekly demand at 1.0519-1.0798 and weekly supply at 1.1532-1.1278, while the daily timeframe shows price still hovering above daily demand coming in at 1.0886-1.0978.
With today being the last trading day of the week, and the seemingly never-ending Greece situation looking to trail into the weekend once again, our team has decided to play it relatively cautious today and only trade if price comes into contact with areas which are supported by higher timeframe structures:
- As per yesterday’s analysis, we still have our eye on the 4hr supply zone at 1.1171-1.1147, which not only encapsulates a daily swap level at 1.1148, but also converges with both a Fibonacci retracement value of 0.618% and the mid-level number resistance at 1.1150.
- The 4hr demand area at 1.0886-1.0924, which if you look across to the daily chart, you’ll see it has the backing of a daily demand zone coming in at 1.0886-1.0978.
Levels to watch/live orders:
- Buys: 1.0886-1.0924 [Tentative – confirmation required] (Stop loss: 1.0878).
- Sells: 1.1171-1.1147 [Tentative – confirmation required] (Stop loss: 1.1176).
GBP/USD:
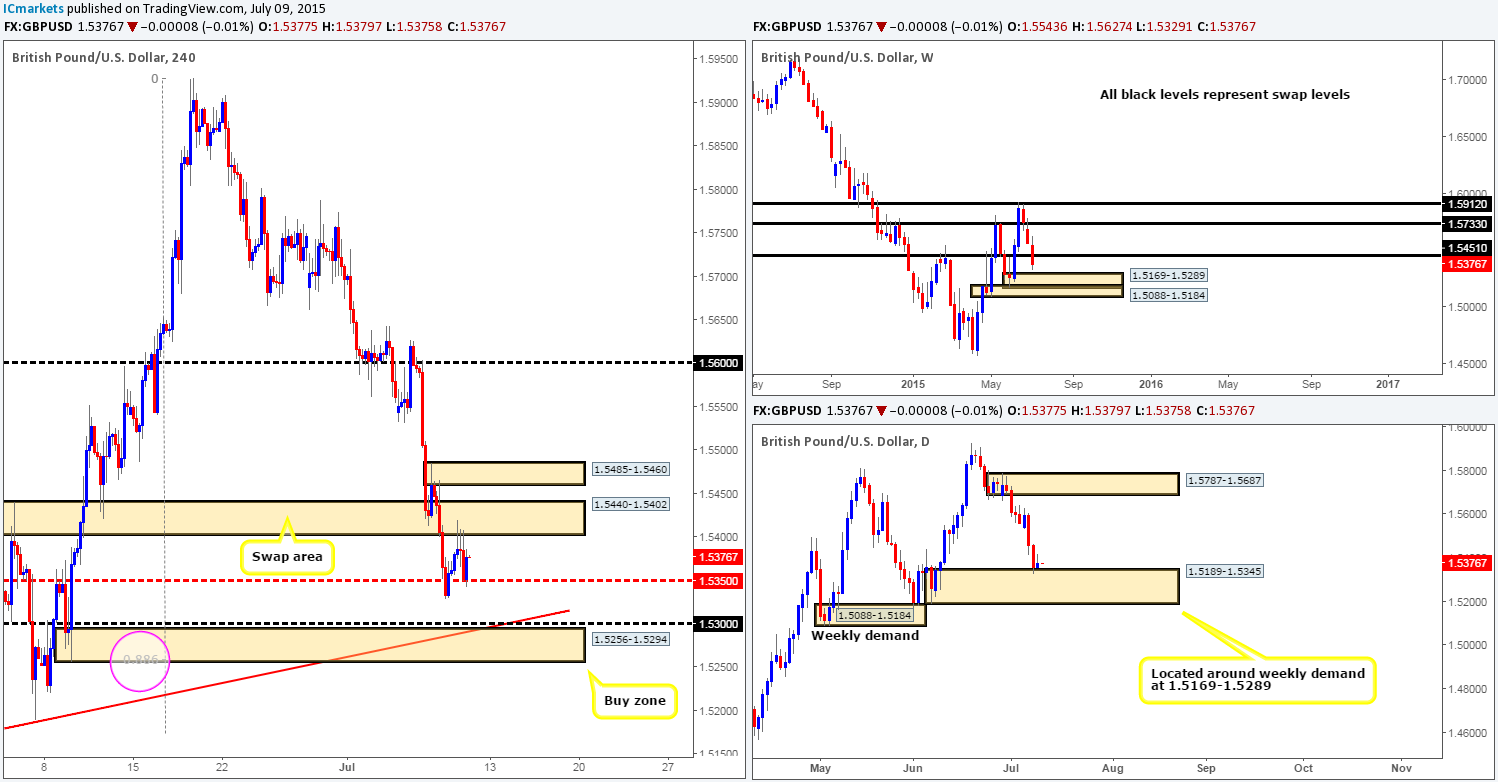
During the course of yesterday’s sessions, we can see that the GBP/USD pair spent much of its time ranging between the 4hr swap area seen at 1.5440-1.5402 and the mid-level hurdle 1.5350.
In the bigger picture, the weekly chart reveals that price is now within touching distance of the weekly demand area at 1.5169-1.5289, while on the daily chart; price is already grappling with a larger daily demand base seen at 1.5189-1.5345. Under these circumstances, we feel there is eventually going to be a push lower to connect with the weekly demand zone, which in turn will likely force price to cross paths with a 4hr demand area at 1.5256-1.5294. This 4hr demand is a high probability turning point in our opinion for the following reasons:
- It is located not only within weekly but also daily demand as well (1.5169-1.5289 – 1.5189-1.5345).
- Additional support from the round number 1.5300.
- Additional support from the deep Fibonacci retracement value 0.886.
- 4hr converging trendline taken from the low 1.5169.
Therefore, should price hit this area (preferably next week as we’re not keen on leaving positions open this weekend), we intend on entering long here with 50% of our usual position size using a market order. The remaining 50% will be used if and only if we see lower timeframe confirming price action.
Levels to watch/ live orders:
- Buys: 1.5256-1.5294 [50% of the position will be taken at market, the remaining 50% will need lower timeframe confirmation] (Stop loss: 1.5242).
- Sells: Flat (Stop loss: N/A).
AUD/USD:
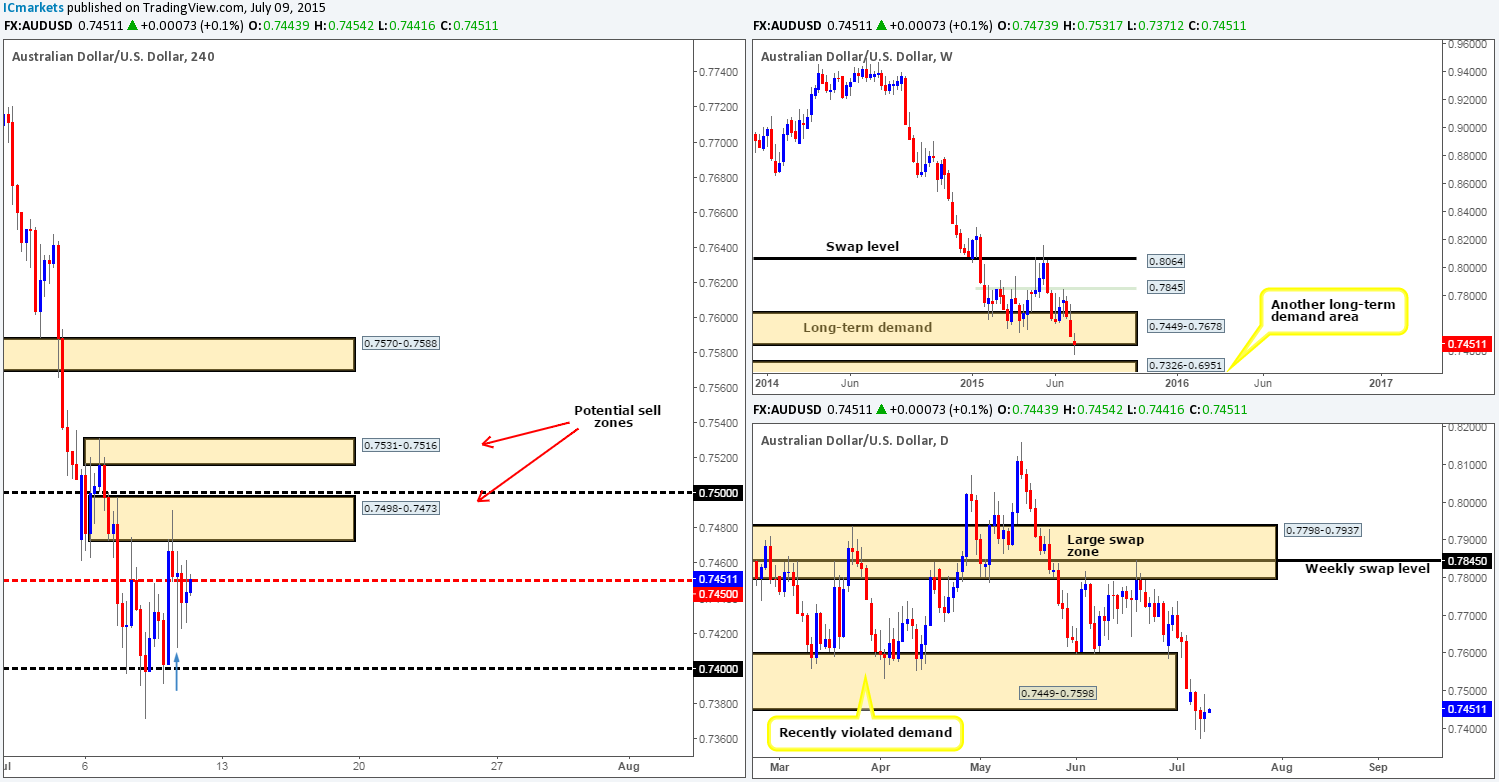
Early on into yesterday’s sessions, a strong surge of bids hit this market from the 0.7400 handle. This saw price obliterate 0.7450 and jab into a 4hr supply zone seen at 0.7498-0.7473, which eventually pushed prices back below 0.7450 to end the day at 0.7443. The tail seen marked with a blue arrow at 0.7411 is important to us since it has likely stabbed into bids at the 4hr demand to its left at 0.7391-0.7431. With this, price has been forced to once again attack 0.7450 which has so far seen very little bearish response. That being the case, we’re likely going to see this pair rally in the short term to connect back up with the 4hr supply area at 0.7498-0.7473, or even the 4hr supply zone seen above it at 0.7531-0.7516.
Just to be clear here guys, even though we believe a small move north will be seen here, we have absolutely no interest in entering into any long positions. What we are interested in though is selling at either of the above said 4hr supply areas as long as it is supported by lower timeframe confirming price action.
The reason for our interest in these two areas comes from the bigger picture. The long-term weekly demand area at 0.7449-0.7678, and its partner demand on the daily timeframe at 0.7449-0.7598 were recently violated. And as far as we can see, the nearest higher timeframe support structure now is the long-term weekly demand area seen at 0.7326-0.6951, suggesting that the overall direction is likely going to continue south alongside the prevailing weekly downtrend.
Levels to watch/ live orders:
- Buys: Flat (Stop loss: N/A).
- Sells: 0.7498-0.7473 [Tentative – confirmation required] (Stop loss: 0.7502) 0.7531-0.7516 [Tentative – confirmation required] (Stop loss: 0.7535).
USD/JPY:
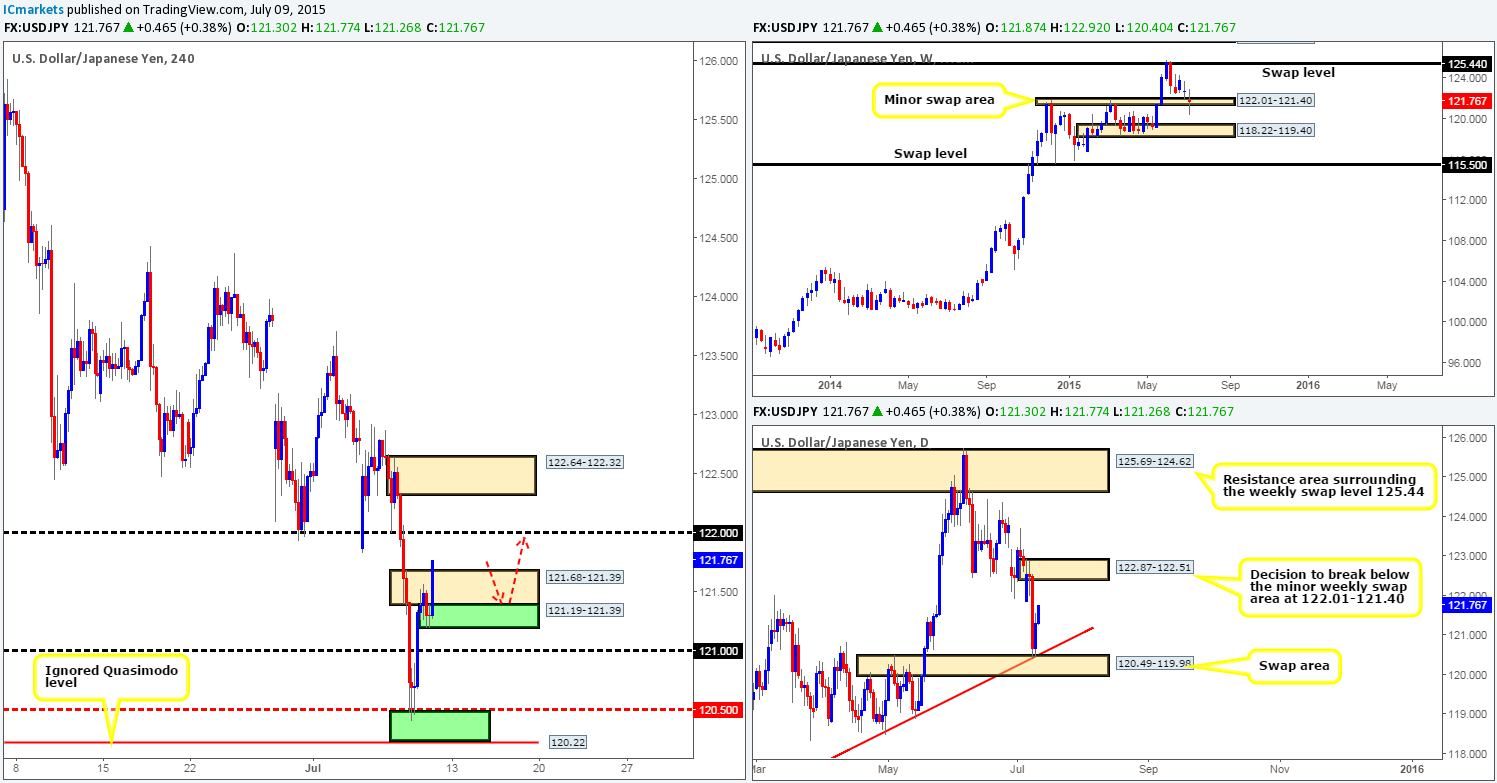
For those of you who read our previous report on the USD/JPY pair, you may recall us mentioning to keep an eye on the green area at 120.50/120.00 for confirmed buys. Unfortunately we missed the move from here entirely since we were not satisfied with what the lower timeframe action was telling us – how wrong we were!
Going forward, we can see price has just recently engulfed a 4hr supply area coming in at 121.68-121.39, which has potentially opened the gates for the market to challenge 122.00. With that, if we see price retrace down to the recently formed 4hr demand area in green at 121.19-121.39 before hitting 122.00 (our target), we’d look at probably taking a small confirmed long position as per the red arrows.
In support of higher prices today, strong buying is being seen from the daily swap area at 120.49-119.98 (boasts daily trendline convergence from the low 115.84), which shows room to move north until price hits daily supply at 122.87-122.51. On top of that, the weekly timeframe is also showing supportive pressure coming from a minor weekly swap area seen at 122.01-121.40.
Levels to watch/ live orders:
- Buys: 121.19-121.39 [Tentative – confirmation required] (Stop loss: 121.14).
- Sells: Flat (Stop loss: N/A).
USD/CAD:
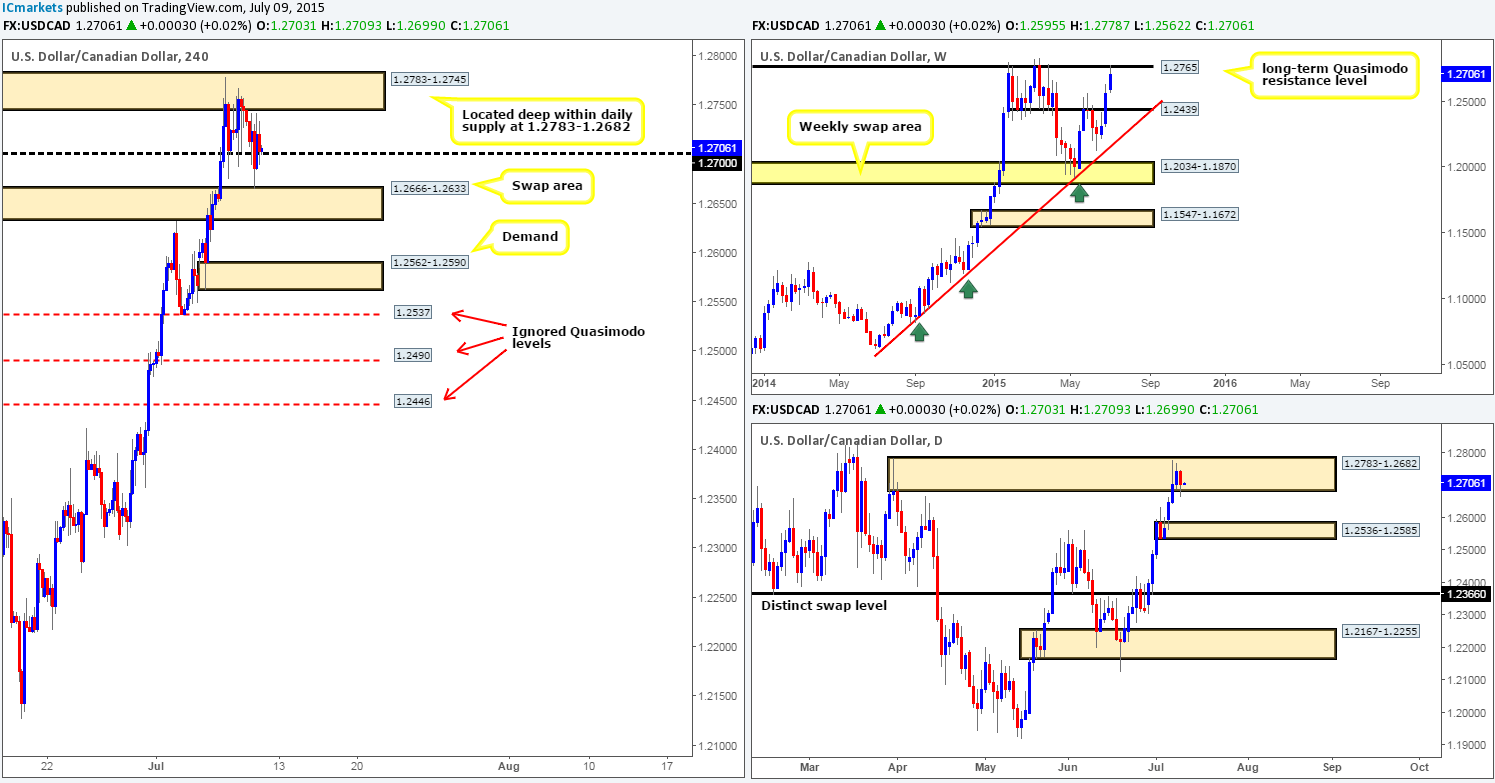
Yesterday’s action shows price did eventually break below 1.2700, resulting in price connecting up with a 4hr swap area coming in at 1.2666-1.2633, which has so far held firm.
We are very eager to short this pair since price is currently touching gloves with a long-term weekly Quasimodo resistance level at 1.2765, and is also positioned deep within a daily supply zone at 1.2783-1.2682. Despite this though, there is very little room for prices to move lower on the 4hr timeframe before reaching the daily demand area at 1.2536-1.2585. As such, in the absence of clearer price action, we’ve decided to remain flat on this pair for the time being.
Levels to watch/ live orders:
- Buys: Flat (Stop loss: N/A).
- Sells: Flat (Stop loss: N/A).
USD/CHF:
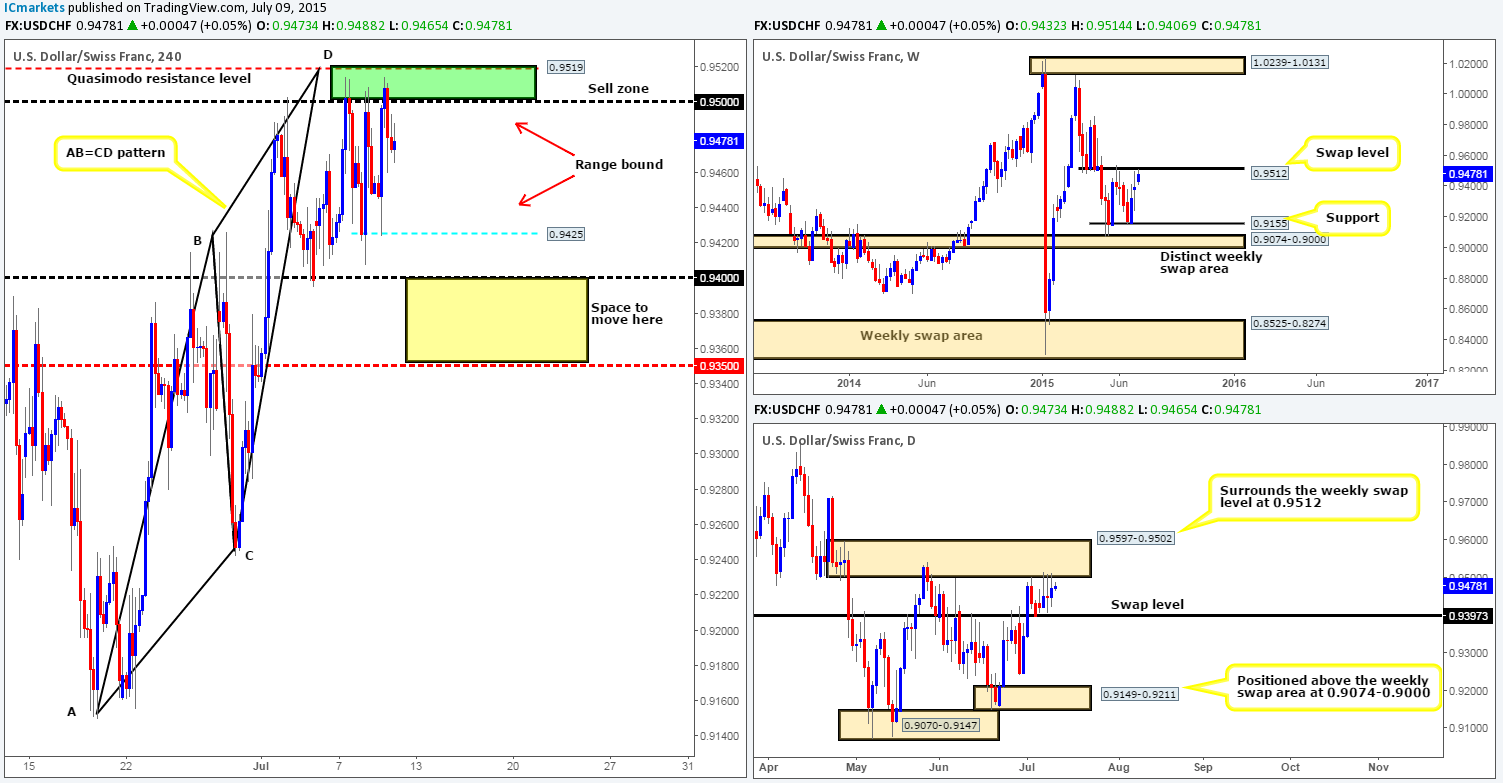
From the 4hr timeframe, it appears that a consolidation area is currently being chiseled out between the green sell zone (Harmonic AB=CD pattern completion) at 0.9500/0.9519 (positioned around a weekly swap level at 0.9512 and also located just within a daily supply zone coming in at 0.9597-0.9502) and a minor 4hr support level coming in at 0.9425.
In the bigger picture, however, price is still seen kissing the underside of a weekly swap level at 0.9512, while action on the daily timeframe shows that the buyers and sellers are currently sandwiched in between 0.9397 (daily swap level) and 0.9597-0.9502 (daily supply area which surrounds the aforementioned weekly swap level).
With all of the above taken into consideration, this is what we have noted so far…
- Trading within the current 4hr range (see above) is certainly a possibility today from where we’re standing (tentative buys seen at 0.9428, sells at 0.9498). Nevertheless, this does not mean we’re going to place pending orders at each side of this consolidation area and be done with it. For us to risk capital here, we would require lower timeframe price action to confirm some sort of strength exists before jumping in, as ranging environments such as this are usually prone to some very nasty fakeouts.
- If the lower limit 0.9425 is breached today, we’ll then focus our attention on 0.9400 as below this number the path south appears clear for selling down to the mid-level number 0.9350.
Levels to watch/ live orders:
- Buys: 0.9428 [Tentative – confirmation required] (Stop loss: dependent on where one confirms this level).
- Sells: 0.9498 [Tentative – confirmation required] (Stop loss: 0.9525).
DOW 30:
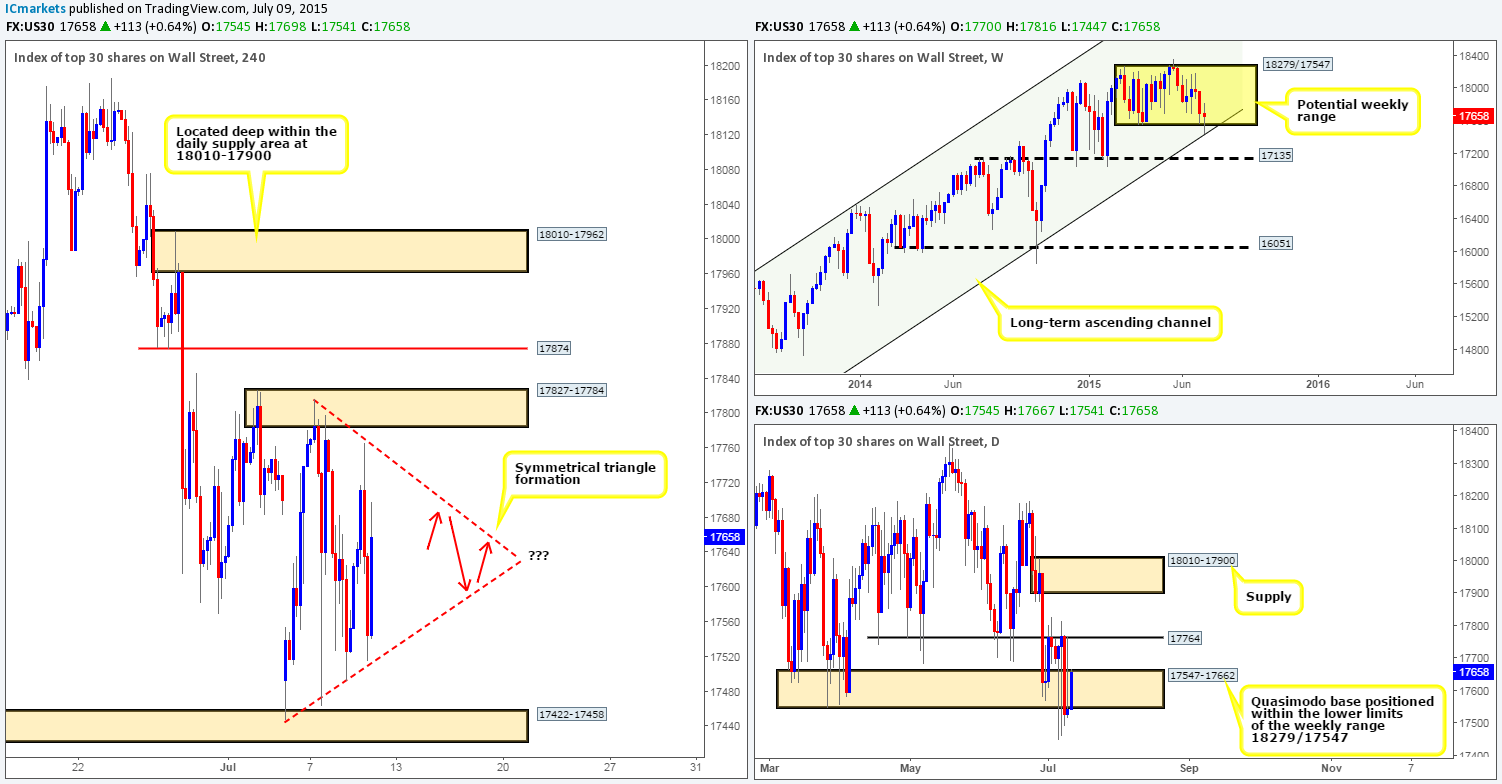
Our first impression upon opening the 4hr chart of the DOW this morning was three words – what a mess! It is simply one big whipsaw of aggressive buying and selling between the 4hr supply area at 17827-17784 and the 4hr demand area coming in at 17422-17458, which, appears to be forming a symmetrical triangle as we speak (down trendline taken from the high 17816 – up trendline taken from the low 17447).
Moving up the scale, we can see that the weekly timeframe shows some buying pressure coming in from the lower limits of a potential weekly range at 18279/17547, which as you can see, is also backed up by the converging long-term weekly ascending channel taken from the low 10402 and high 13270. The daily chart on the other hand reveals that over the past few days price has been munching on stop orders below the daily Quasimodo base seen at 17547-17662 (located within the aforementioned weekly range). Could this just be one big fakeout into the weekly ascending channel line? Food for thought…
Going into today’s sessions, traders could look to take advantage of this present whipsaw motion we have going on, on the 4hr timeframe at the moment by attempting to fade the compressing trendlines to end the week. However, we would highly recommend waiting for the lower timeframes to confirm some sort of strength is present before risking capital since there is really not very much stopping price from faking out to its surrounding 4hr supply and demand areas (see above for levels).
Levels to watch/ live orders:
*Watch for reactions at the compressing 4hr trendline levels*
- Buys: Flat (Stop loss: N/A).
- Sells: Flat (Stop loss: N/A).
XAU/USD: (Gold)
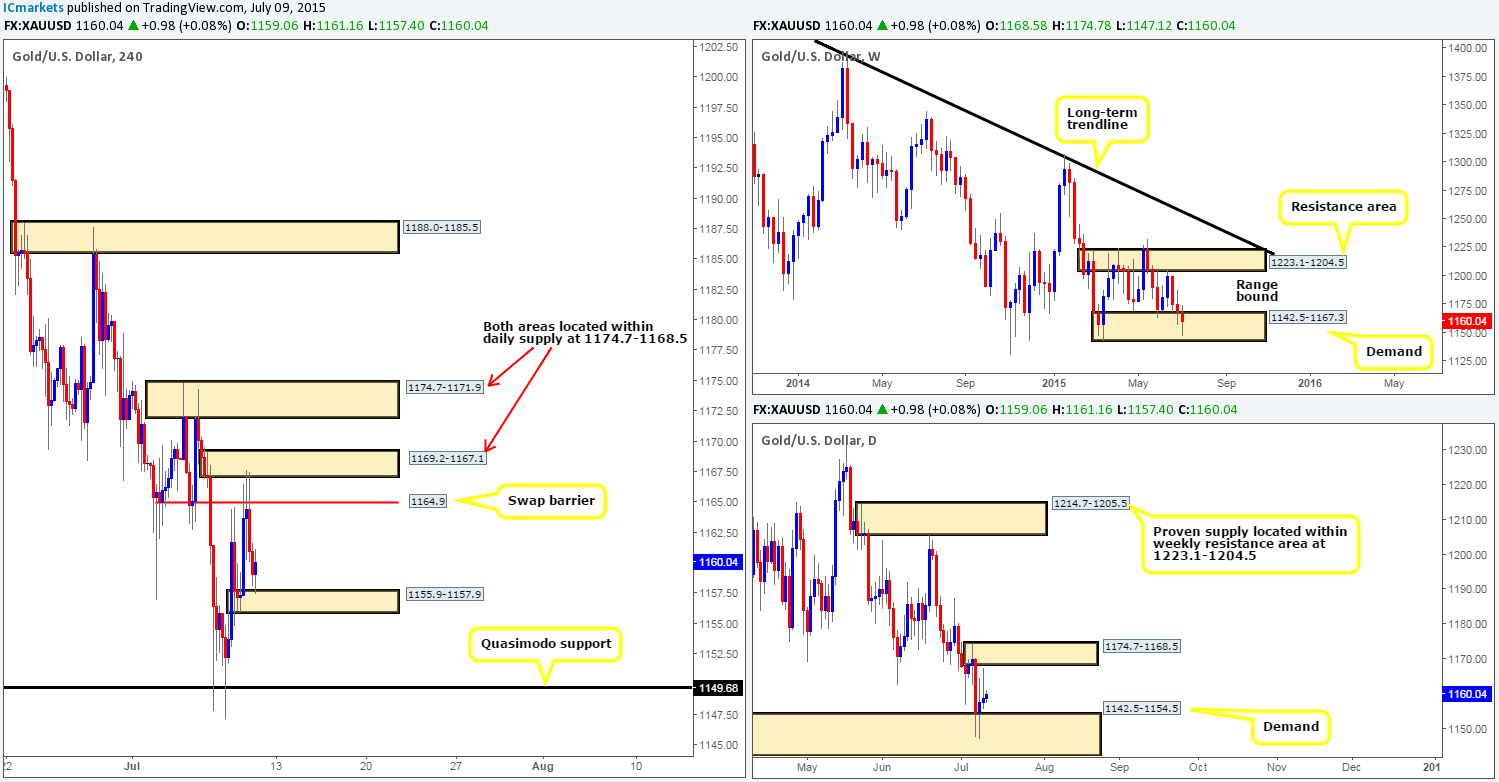
Going into the early hours of the European session yesterday the bulls were seen pressing forward. Price was driven above a 4hr swap barrier at 1164.9 into an almost invisible area of 4hr supply at 1169.2-1167.1, which, as you can see, pushed this market down to a 4hr demand area formed earlier that day at 1155.9-1157.9.
Now, with price sitting within a weekly demand area (1142.5-1167.3) at the moment, and room being seen on the daily timeframe to move higher, we’re going to attempt to enter long at the current 4hr demand area during today’s sessions. Nonetheless, seeing as how a reaction has already been seen from here, we’re going to have to resort to waiting for a lower timeframe confirming signal to form before we can enter. Should everything go to plan though, the first-take profit target for this trade will be the 4hr swap barrier at 1164.9. If we manage to get above here, we’ll then be looking for price to take out the already partially consumed 4hr supply area at 1169.2-1167.1 and head up to the next 4hr supply seen at 1174.7-1171.9 (both 4hr areas area located within daily supply at 1174.7-1168.5).
Levels to watch/ live orders:
- Buys: 1155.9-1157.9 [Tentative – confirmation required] (Stop loss: 1154.7).
- Sells: Flat (Stop loss: N/A).


