Aside from technical indicators and Japanese candlestick patterns, another main component of technical analysis is chart formations. Remember that the concept behind technical analysis is that price patterns tend to repeat themselves, which means that these chart patterns more or less result to the same price behavior later on.
The sheer number of classic chart formations may seem intimidating and difficult to memorize at first but this comes with practice. More often than not, the names of the chart formations describe how the patterns look like on the charts.
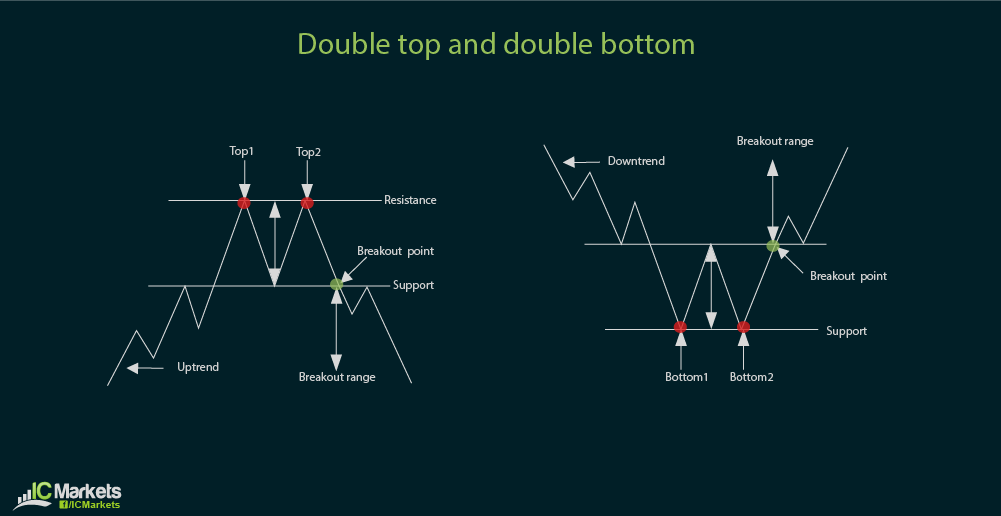
For instance, the double top and double bottom patterns are one of the easiest ones to remember. A double top looks like two peaks in price action while the double bottom looks like two lows.

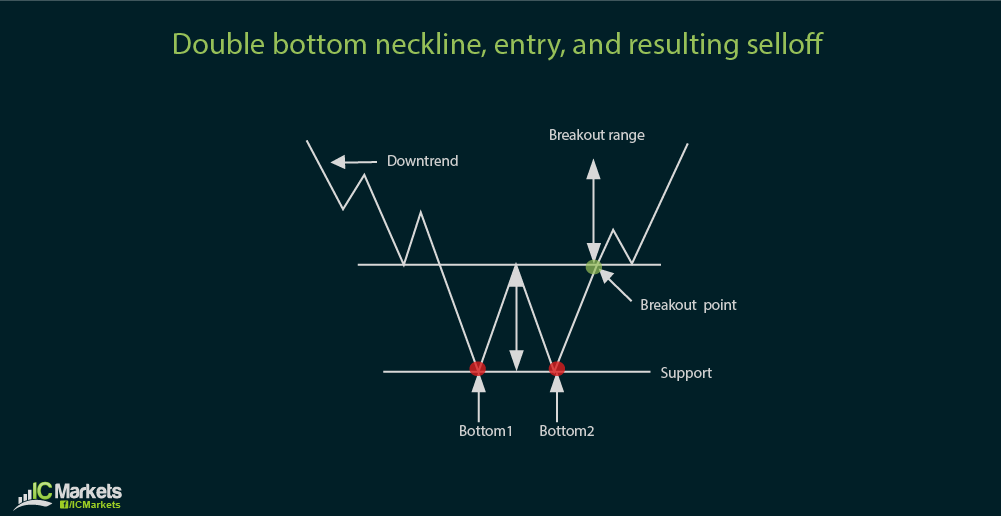
These are considered reversal signals, as a break beyond the neckline of the formation suggests the start of a new trend. To trade this, you can set a buy order above the neckline of a double bottom or set a sell order below the neckline of a double top.
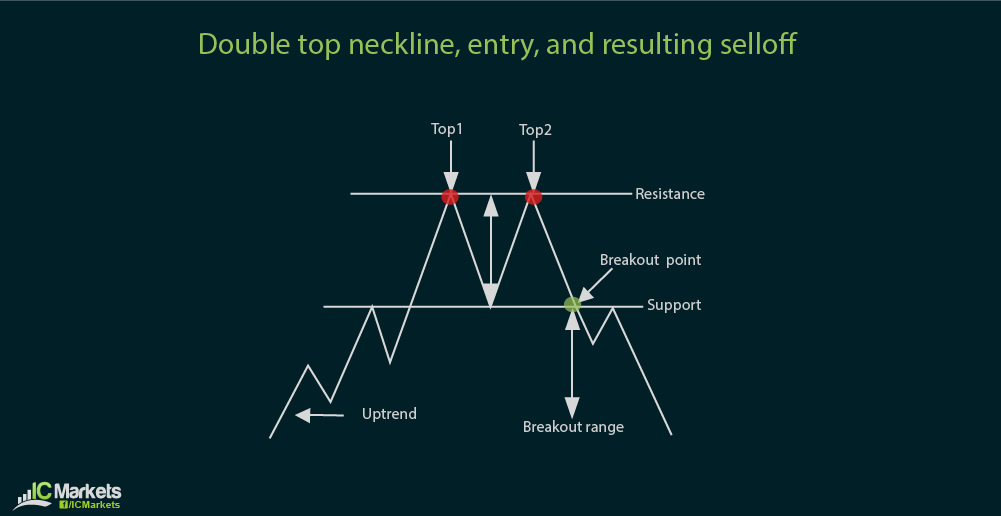
Drawing necklines take practice but a good rule of thumb to remember is to simply connect the price turn in between the bottoms or the tops with a horizontal line.
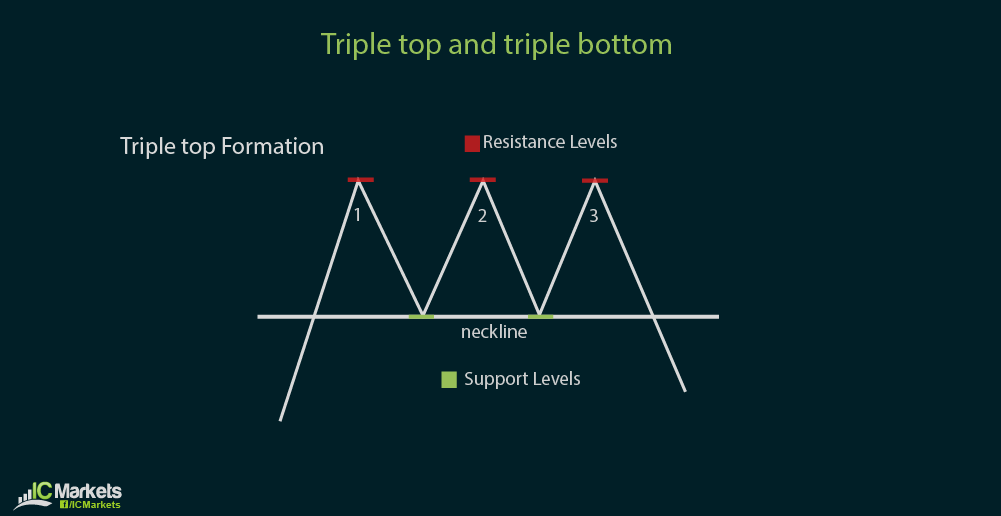
A variation of the double top and double bottom is the triple top and triple bottom, which are also reversal signals. These are rare finds though but can be potent signals of a new trend.
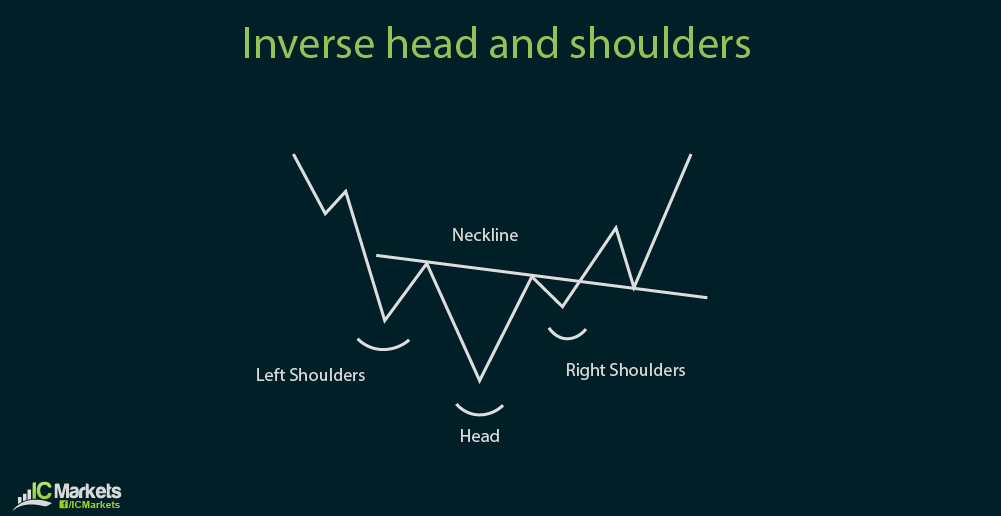
A more complex reversal chart pattern is the head and shoulders. When it forms on top of an uptrend, it is a sign that a selloff might take place if price is able to break below the neckline.

Conversely, an inverse head and shoulders pattern forming at the bottom of a downtrend is a sign that price will turn and may move in an uptrend after breaking above the neckline.
Another group of chart patterns is the triangle formations. These can be descending, ascending, or symmetrical.
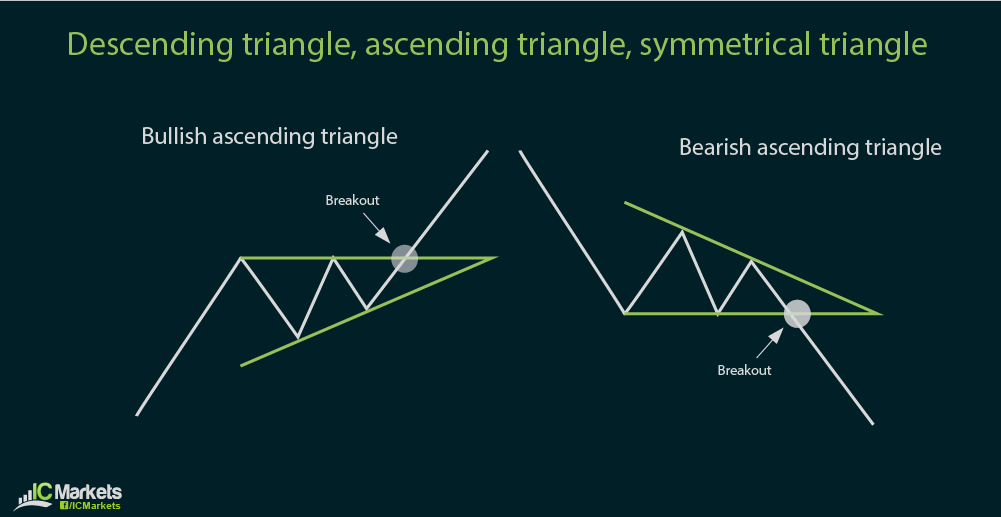
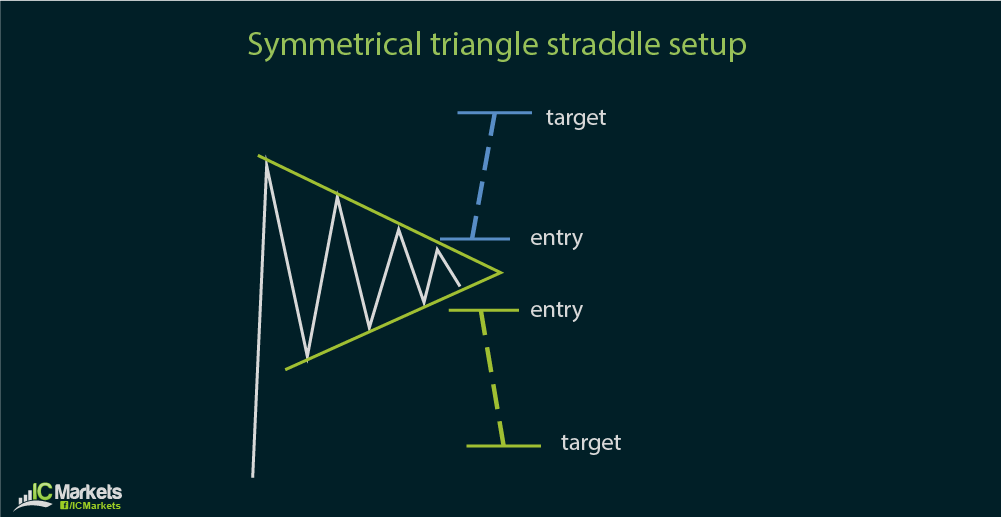
There is no hard and fast rule in saying whether these formations result to reversals or continuations. When price is consolidating tighter towards the rightmost tip of the triangle, it is a sign that a breakout may occur in either direction. Traders try to catch an up or down move by setting buy and sell orders outside the triangle.
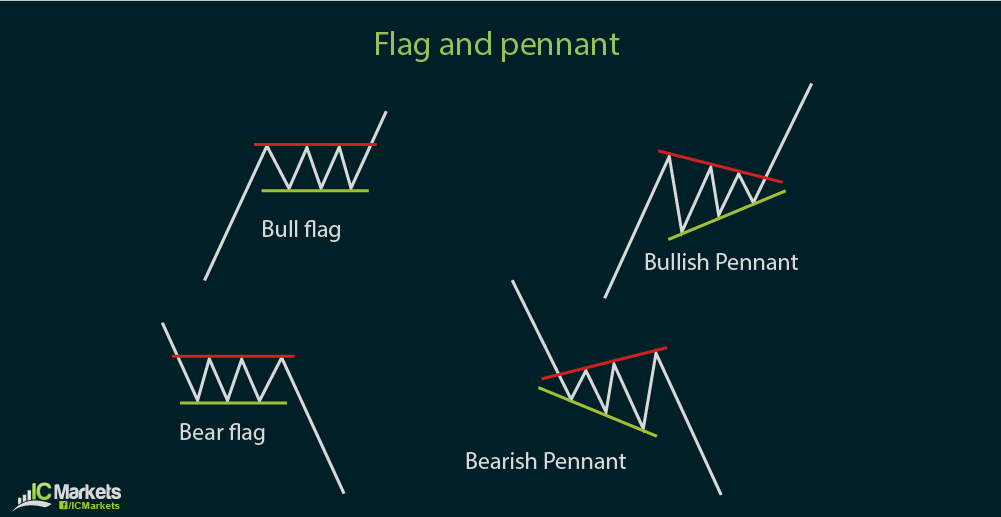
Last but not least, another popular group of chart formations are the flags and pennants. These are typically treated as continuation patterns, as price simply consolidates for a short while inside a flag or pennant before resuming its ongoing trend.
There are other kinds of chart patterns such as wedges or cup and handle formations, which will be covered in a later section.