A note on lower timeframe confirming price action…
Waiting for lower timeframe confirmation is our main tool to confirm strength within higher timeframe zones, and has really been the key to our trading success. It takes a little time to understand the subtle nuances, however, as each trade is never the same, but once you master the rhythm so to speak, you will be saved from countless unnecessary losing trades. The following is a list of what we look for:
- A break/retest of supply or demand dependent on which way you’re trading.
- A trendline break/retest.
- Buying/selling tails/wicks – essentially we look for a cluster of very obvious spikes off of lower timeframe support and resistance levels within the higher timeframe zone.
- Candlestick patterns. We tend to only stick with pin bars and engulfing bars as these have proven to be the most effective.
For us, lower timeframe confirmation starts on the M15 and finishes up on the H1, since most of our higher timeframe areas begin with the H4. Stops usually placed 5-10 pips beyond your confirming structures.
EUR/USD:
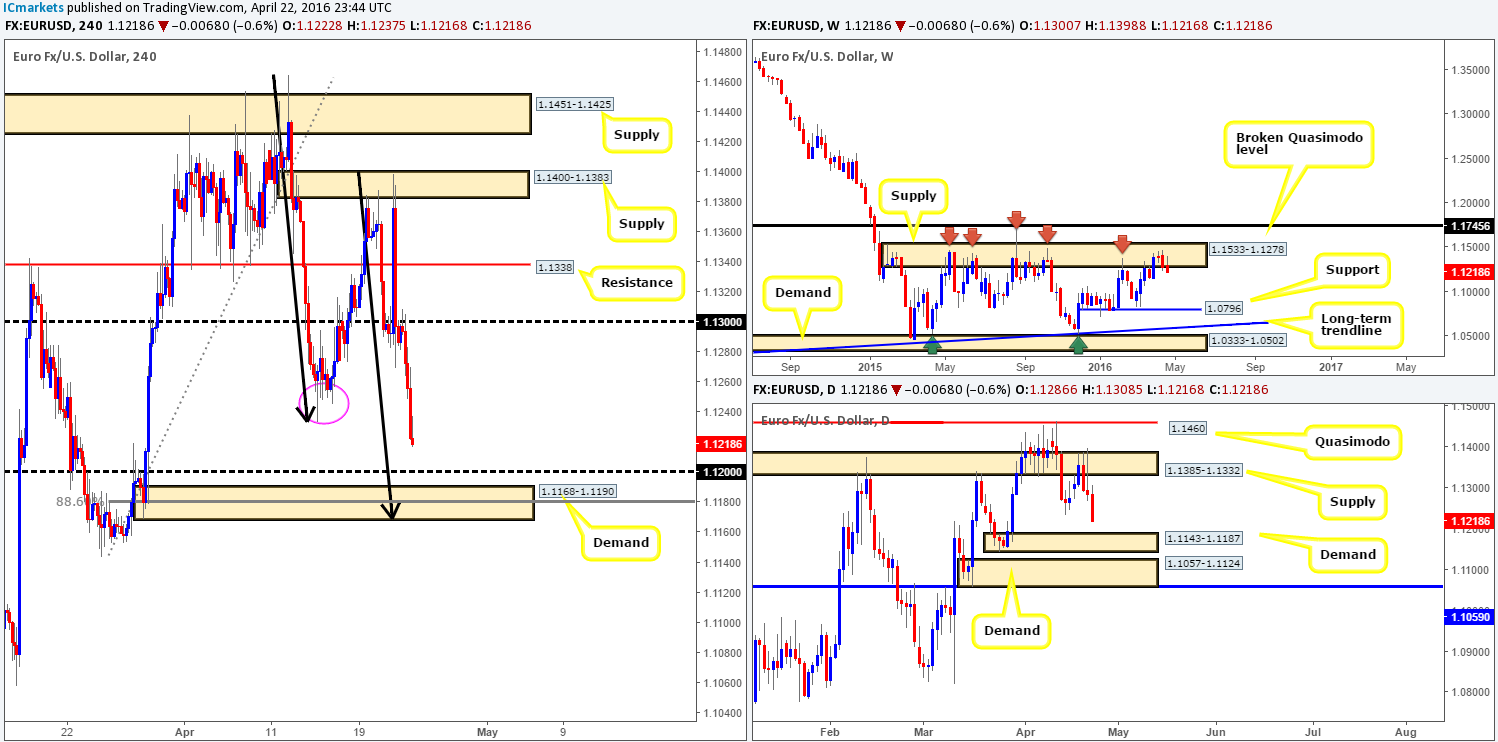
The past week saw the single currency take its second consecutive loss from within the confines of weekly supply seen at 1.1533-1.1278, erasing around 60 pips of value and ending the week closing on its lows at 1.1218. The decline from here should not really come as much of a surprise as this area has held price lower since May 2015. Speaking from the weekly timeframe, the next obvious downside target can be seen around weekly support chalked in at 1.0796, so do keep an eye on this number going forward.
As bearish as the weekly chart appears, daily price shows the pair approaching a fresh demand base taken from 1.1143-1.1187, where we expect to see some sort of reaction should price reach this low this week. Nevertheless, traders also need to be prepared for the possibility that this market could whipsaw through this zone in order to connect with nearby demand lurking just below it at 1.1057-1.1124.
A quick recap of Friday’s movement on the H4 shows that early on in the session; the EUR retested the 1.1300 handle as resistance before plummeting lower. Well done to any of our readers who managed to board this train before it departed as this was a noted move to watch for in Friday’s report. Seeing as the lows made on the 14/15th April (pink circle) were consumed a few hours before the market closed for the week, our focus is now firmly pointing in the direction of H4 demand at 1.1168-1.1190 for a potential buy trade today/this week. We’ve built a case for entry on the following points:
- The H4 demand has incredible bullish momentum from the base.
- It ties in nicely with a deep 88.6% Fibonacci support at 1.1180.
- Psychological support 1.1200 sits just above, which will likely be faked in order to hit our buy zone.
- The H4 demand also converges nicely with an AB=CD bullish formation which terminates relatively deep within the zone at around 1.1171.
- Over on the USDX, which is inversely correlated to the EUR/USD, there’s a nice-looking bearish AB=CD pattern forming which also completes within the extremes of a H4 supply (95.23-95.49) at 95.47.
- And finally, let’s not forget that the daily demand noted above at 1.1143-1.1187 bolsters the current H4 demand area.
Despite the huge amount of confluence here guys, we cannot ignore the fact that weekly action is trading out of supply right now (see above). Therefore, we are not going to be placing pending buy orders at the above said H4 demand. Instead, we’ll be watching how the lower timeframe price action behaves before looking to risk capital on this idea. Should we spot a break/retest of lower timeframe supply, or a lower timeframe trendline break/retest or even simply a collection of buying tails around lower timeframe support, we’ll be confident in taking a long position in this market.
Levels to watch/live orders:
- Buys: 1.1168-1.1190 [Tentative – confirmation required] (Stop loss: dependent on where one confirms this area).
- Sells: Flat (Stop loss: N/A).
GBP/USD:
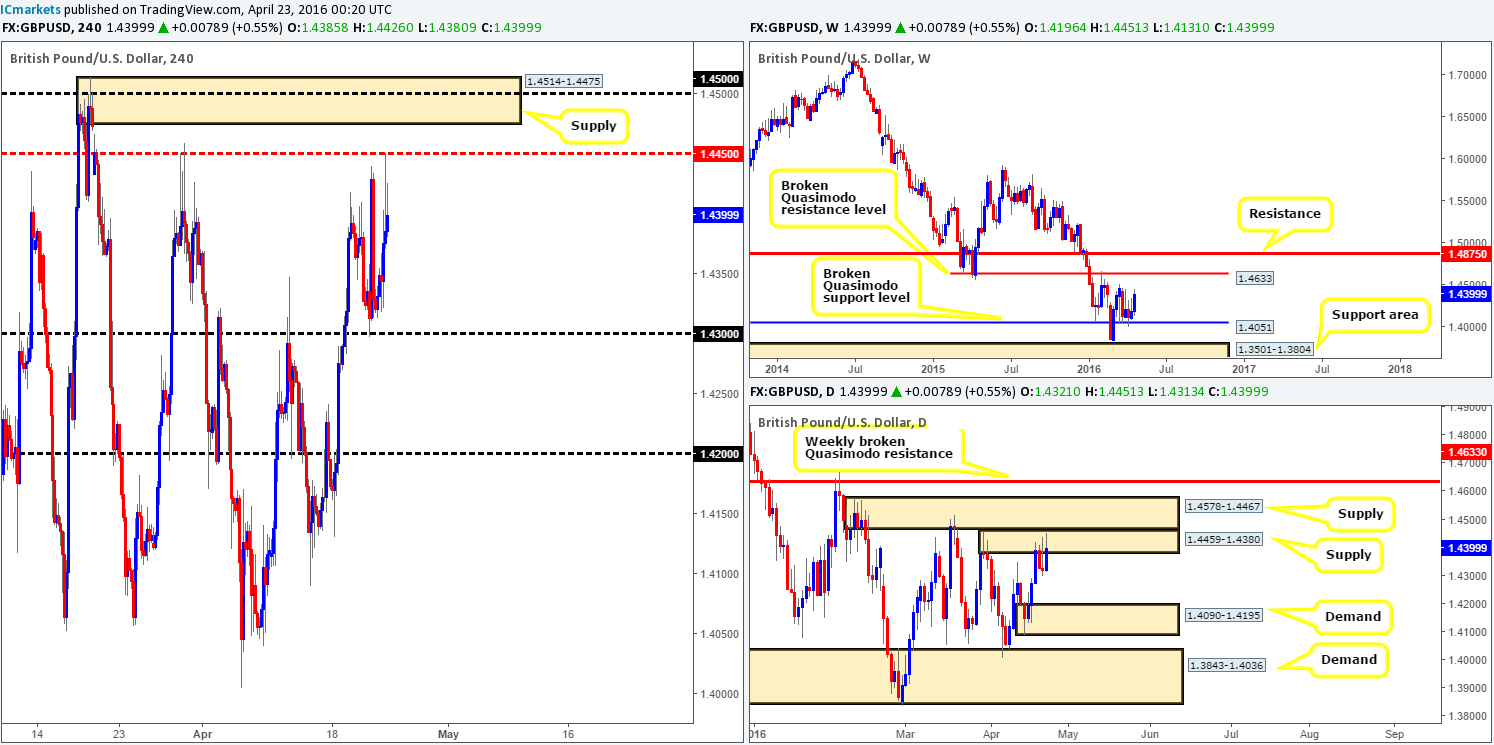
The GBP/USD managed to net around 200 pips during the course of last week’s trading, as price extended its bounce from the broken weekly Quasimodo support at 1.4051. As we already noted in Friday’s report, if we were solely trading the weekly timeframe current structure suggests that this pair could punch as high as the broken Quasimodo resistance line coming in at 1.4633. Therefore, this is certainly a number we would advise noting down going into this week’s trade.
Stepping down into the pits of the daily timeframe, price has been capped by supply seen at 1.4459-1.4380 since Tuesday last week, which, as you can see, is bolstered by another supply directly above at 1.4578-1.4467. As such, weekly bulls likely have their work cut out for them if they want to push things higher from here!
Moving over to the H4 chart, the mid-level resistance 1.4450 was clearly a favored number in this market last week. For all that though, this level, considering it has been visited twice already, is, in our opinion, likely weakening. Therefore, we now have our eye on the H4 supply sitting just above at 1.4514-1.4475 as a potential sell zone today/this week. We like the fact that it is housed within the larger daily supply at 1.4578-1.4467 and that it fuses with psychological resistance 1.4500. The only drawback to shorting this H4 supply is of course where the weekly action is currently positioned (see above), so we would recommend only risking capital here should one be able to confirm this zone with a lower timeframe sell setup (for confirmation techniques, please see the top of this report).
Levels to watch/live orders:
- Buys: Flat (Stop loss: N/A).
- Sells: 1.4514-1.4475 [Tentative – confirmation required] (Stop loss: dependent on where one confirms this area).
AUD/USD:
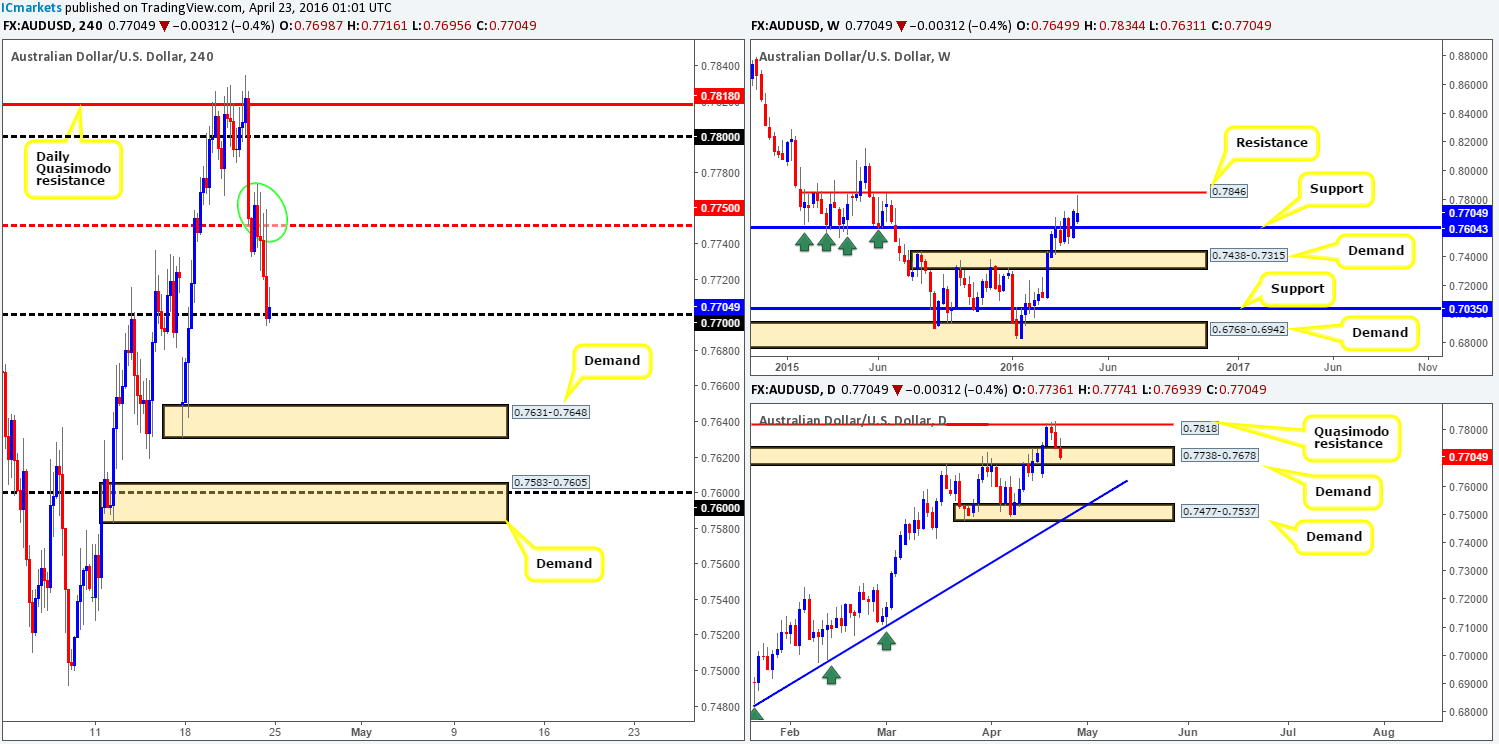
The commodity currency had a rather interesting week last week. Despite the pair closing a mere seventeen pips lower than the previous weekly close at 0.7704, we saw price range a healthy 200 pips. This, as can be seen from the weekly chart, saw the pair come within twelve pips of hitting quite an important barrier of resistance drawn in at 0.7846 before retreating into the close. Now, as far as we can see, this could spark further selling this week down to support given at 0.7604, so do keep this line noted in your watch lists as it could play a significant role during trade this week.
Despite what’s been noted above, the daily chart is, after three consecutive bearish days, now trading within the jaws of demand formed at 0.7738-0.7678. Therefore, it is possible that we may see some buying pressure come into the market before price reaches the above said weekly support! It will be interesting to see what the H4 timeframe makes of this…
On the H4 chart, as you can see, the Aussie settled for the week around psychological support 0.7700. The response so far has been soft, but given it was the last few hours of the trading week liquidity was bound to be thin. With the weekly timeframe suggesting some selling could be on the cards and the daily timeframe positioned within demand, here is our plan of attack going forward…
0.7700 is a very important number to us. Here’s why:
- If 0.7700 holds as support today, this may set the tone for a rally up to retest the H4 mid-level resistance at 0.7750. Judging by the candle action seen around this mid-way number (green circle), however, we feel offers are weak here, thus indicating further buying up to 0.7800 may take place (sits just beneath a daily Quasimodo resistance at 0.7818) should price reach 0.7750. Therefore, if one manages to spot a lower timeframe buy setup forming at 0.7700, it may be worth considering entering long (for confirmation techniques, please see the top of this report).
- If on the other hand 0.7700 caves in, this will likely prompt further downside to H4 demand at 0.7631-0.7648. Nevertheless, given the H4 demand at 0.7583-0.7605 which sits below fuses with both psychological support 0.7600 and also the weekly support mentioned above at 0.7604, we feel the market will be far more attracted to this region rather than the initial H4 demand. As a result, if 0.7700 is retested as resistance following a close lower, a short trade, targeting H4 demand at 0.7631-0.7648 followed closely by H4 demand at 0.7583-0.7605 could be something to look at.
Levels to watch/live orders:
- Buys: 0.7700 region [Tentative – confirmation required] (Stop loss: dependent on where one confirms this area).
- Sells: Watch for price to consume 0.7700 and look to trade any retest seen thereafter (lower timeframe confirmation required).
USD/JPY:
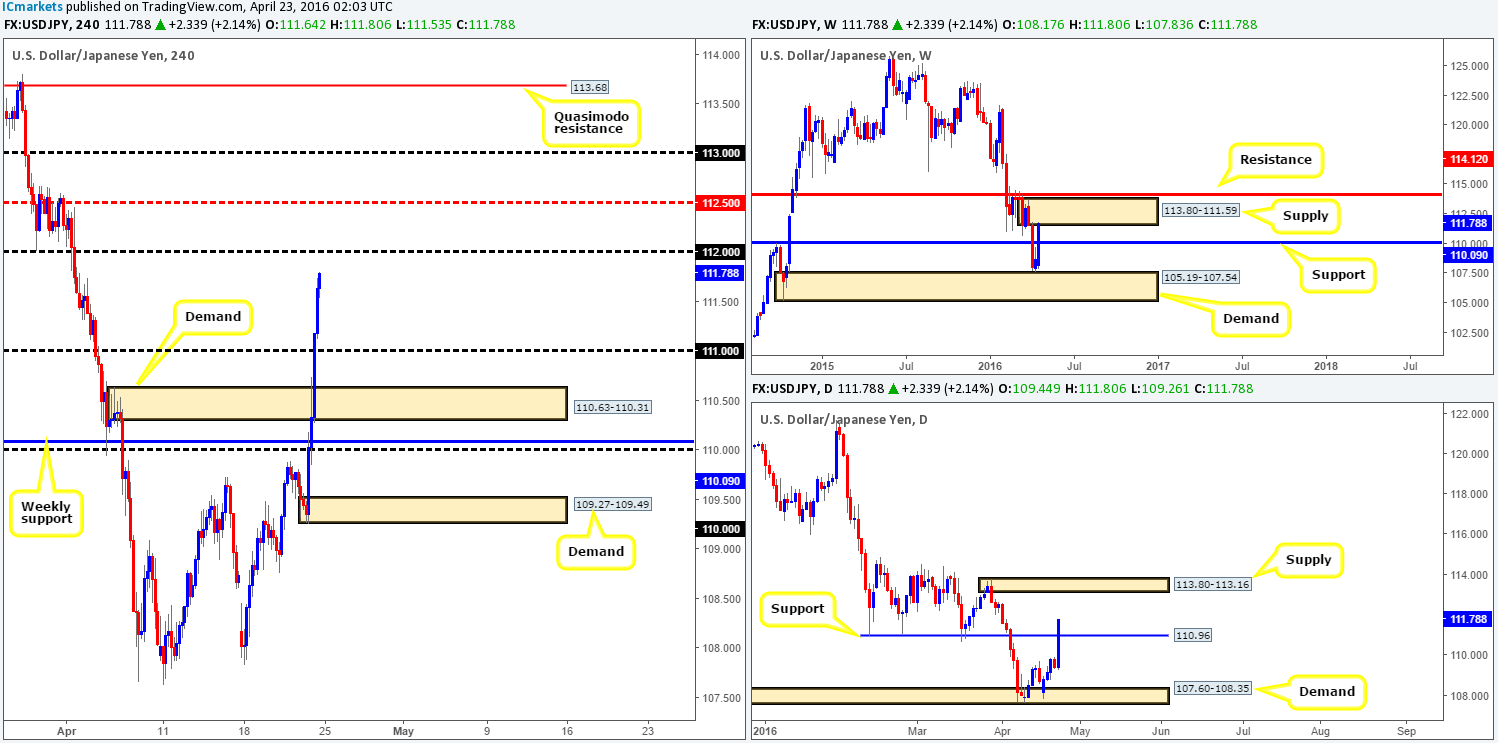
Following a very close shave with weekly demand at 105.19-107.54 two weeks back, price extended over 300 pips higher last week. As a result, weekly resistance at 110.09 (now acting support) was taken out, ending with the market closing around the underside of weekly supply (113.80-111.59) at 111.78. So with this in mind, we could witness some sort of a sell-off this week.
Casting our lines down into the daily chart, one can see that it was actually Friday’s trading that boosted gains for this pair, rallying a whopping 234 pips on the day. This move saw price wipe out resistance coming in at 110.96 (now acting support) and potentially open up the gates for this market to challenge supply at 113.80-113.16 (positioned within the extremes of the above said weekly supply). Fundamentally, this surge in buying came about following reports that the BoJ may announce negative interest rates at its next meeting.
Consequent to Friday’s aggressive move north, H4 action wrapped up the week just ahead of psychological resistance 112.00. Owing to price trading at a weekly supply zone (see above) right now, shorting from 112.00 or even the H4 mid-level hurdle 112.50 is certainly a possibility as long as one is patient enough to wait for the lower timeframes to confirm strength resides here. Reason being is let’s not forget that the daily picture shows price relatively free to head higher into weekly supply (see above).
As far as we see things, the ideal place to be looking for shorts this week, however, would be between 113.00 and the H4 Quasimodo resistance level at 113.68, since this area is located within both the weekly and daily supplies we mentioned above. We consider this to be an extreme price point so a relatively strong push south is expected from here!
Levels to watch/live orders:
- Buys: Flat (Stop loss: N/A).
- Sells: 112.50/112.00 region [Tentative – confirmation required] (Stop loss: dependent on where one confirms this area). 113.68/113.00 region [Tentative – confirmation required] (Stop loss: dependent on where one confirms this area).
USD/CAD:
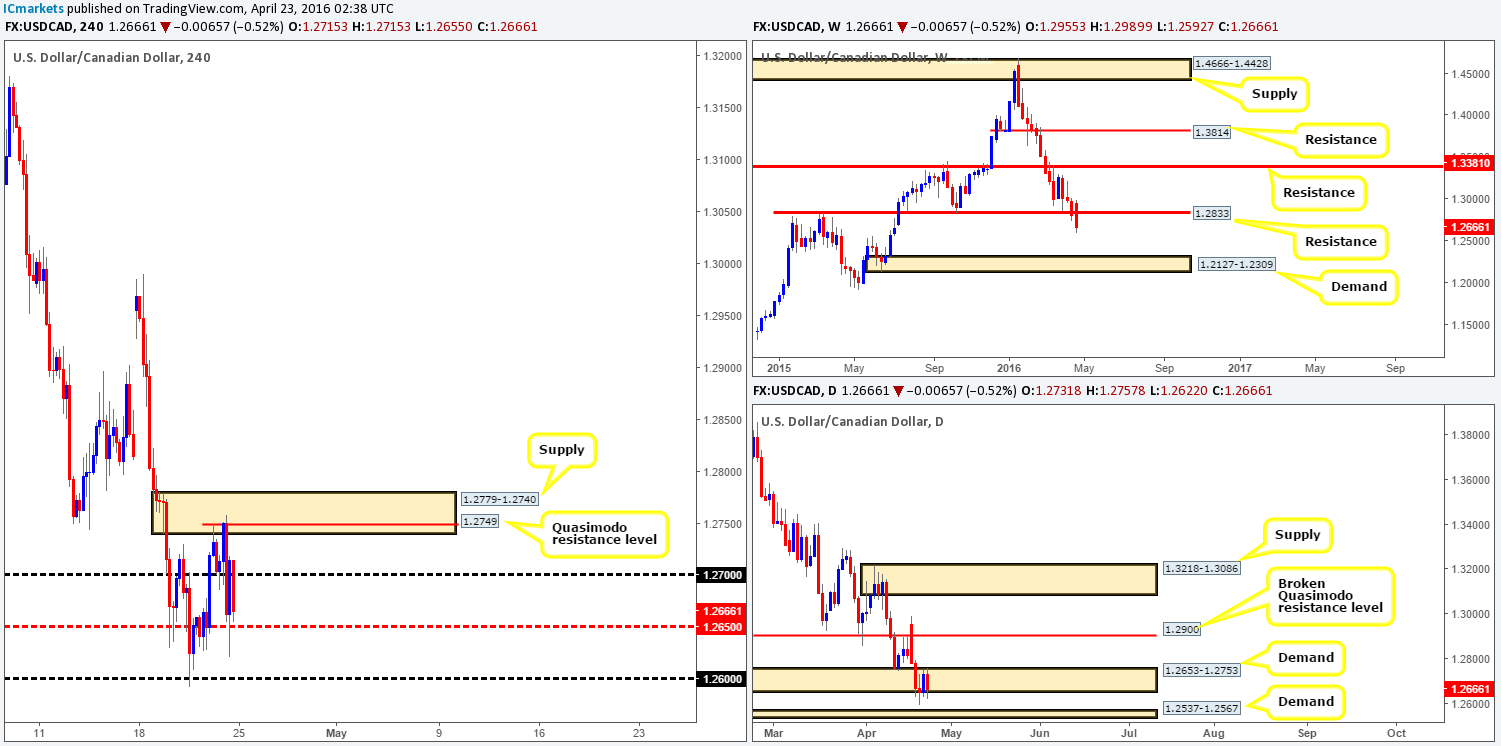
Last week’s trading saw the Loonie take yet another hit to the mid-section! Price completely engulfed weekly support coming in at 1.2833, closing the week out with a loss of 150 pips at 1.2666. With this pair sporting a downtrend since price peaked back in mid-January at 1.4689, it is possible price could head lower to cross swords with weekly demand chalked up at 1.2127-1.2309. Before the sellers can achieve this, however, both daily demands at 1.2653-1.2753 and 1.2537-1.2567 will need to be taken out. This would, as far as we can see, likely clear the path south towards another daily demand coming in at 1.2309-1.2397 which conveniently sits on top of the weekly demand mentioned above.
Turning our attention to the H4 chart, we can see that H4 supply at 1.2779-1.2740 did a sound job of holding price lower on Friday. With all three charts in mind, we’re quite interested in looking for shorts around the H4 Quasimodo resistance line at 1.2749 which, as you can see, is positioned nicely within the above said H4 supply. In saying that though, we would also consider a trade on any retest seen at 1.2650 should the H4 mid-level support give way, targeting 1.2600 first and foremost. We only say this simply because the current daily demand at 1.2653-1.2753 is looking extremely soft at the moment, and the next downside hurdle on the daily timeframe (as we mentioned above) does not come into the picture until the 1.2537-1.2567.
Levels to watch/live orders:
- Buys: Flat (Stop loss: N/A).
- Sells: Watch for price to consume 1.2650 and look to trade any retest seen thereafter (lower timeframe confirmation required). 1.2749 [Tentative – confirmation required] (Stop loss: dependent on where one confirms this level).
USD/CHF:
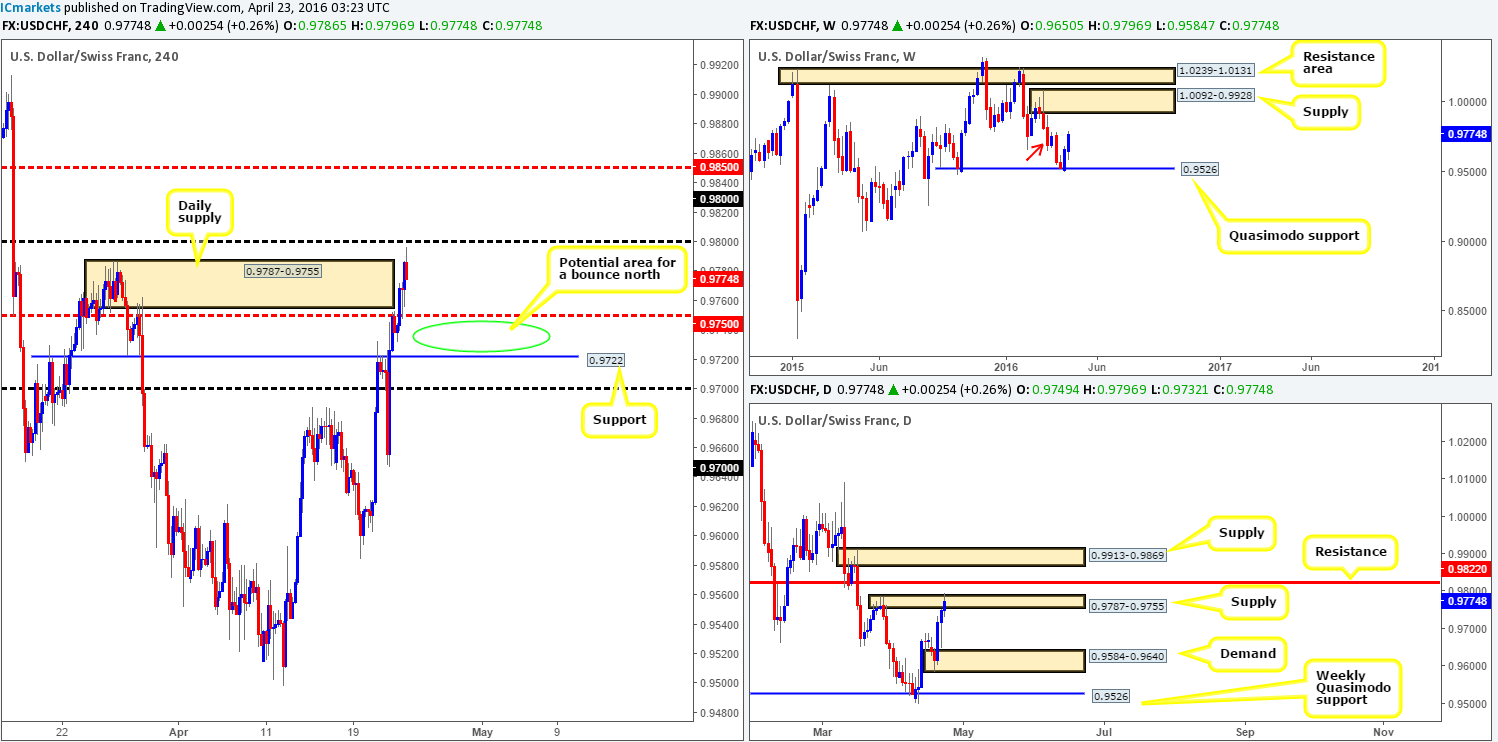
The USD/CHF enjoyed another relatively successful week, increasing its value by a further 105 pips by the close 0.9774. The bounce seen from the weekly Quasimodo support at 0.9526 two weeks ago, which printed a nice-looking bullish engulfing bar, clearly encouraged this recent surge in buying. What is more, we can see that price slightly broke above a small near-term weekly supply marked with a red arrow at 0.9787-0.9695, suggesting a continuation move north up to the weekly supply at 1.0092-0.9928 could be on the horizon.
With this in mind, Friday’s trading saw the Swissy break above daily supply coming in at 0.9787-0.9755 (sits within the extremes of the above said weekly supply), potentially opening the trapdoor north up to daily resistance at 0.9822, followed closely by fresh supply drawn from 0.9913-0.9869 (sits just below weekly supply at 1.0092-0.9928).
Looking over to the H4 chart, price came within shouting distance of hitting psychological resistance 0.9800 following the break above the aforementioned higher-timeframe supplies. With higher-timeframe stop losses likely triggered (see above in bold), this market could potentially move higher, so it is our job to find an area of value in which to buy a pullback today/this week. The green circle seen between H4 mid-level support 0.9750 and H4 support at 0.9722 looks like a reasonable possibility for a decent bounce north, targeting 0.9800, followed by 0.9822 (the daily resistance) and then for a final target at around the daily supply at 0.9913-0.9869. We must emphasize, however, that we would not be confident enough to take a buy position here at market without lower timeframe confirmation (for confirmation techniques, please see the top of this report).
Levels to watch/live orders:
- Buys: 0.9722/0.9750 region [Tentative – confirmation required] (Stop loss: dependent on where one confirms this area).
- Sells: Flat (Stop loss: N/A).
DOW 30:
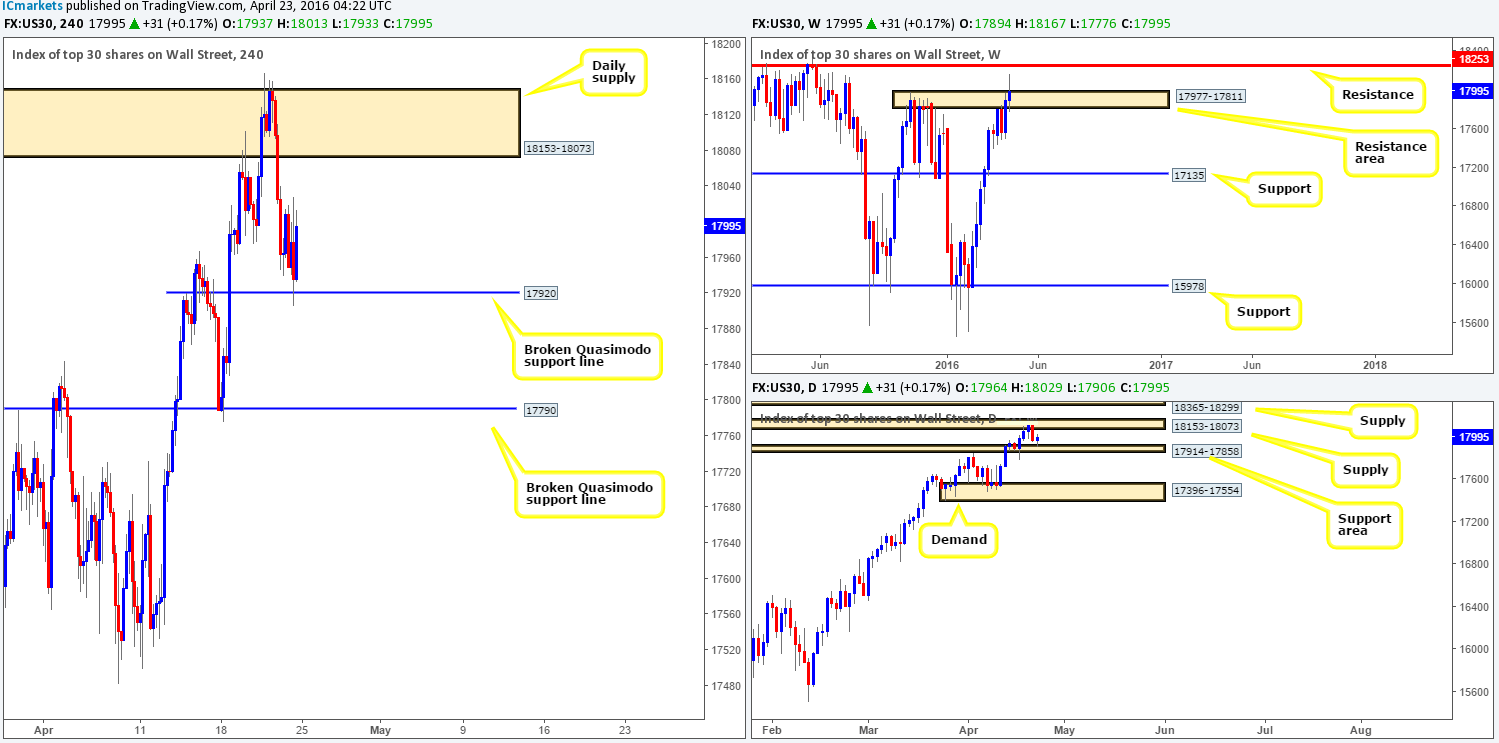
U.S. stocks, as you can see from the weekly chart, concluded trade by closing 100 points higher at 17995. Prior to the close, nonetheless, price made a run to highs of 18167 coming relatively close to connecting with resistance at 18253 before retreating, forming a significant rejection wick. This poses quite an important question: is the recent close above the current resistance area at 17977-17811 sufficient enough to consider this zone consumed? We’re uncertain due to the selling wick so let’s take a look lower down the scale to see what else is on offer…
The daily chart shows that price found active bids from a small support area penciled in at 17914-17858 on Friday, and ended forming an indecision candle with a slight edge seen going to the bulls. Therefore, this gives some recognition to the possibility that the aforementioned weekly resistance area is consumed and price is ready to advance. In addition to this, we can see that the daily supply sitting above current price at 18153-18073 was breached on Wednesday, adding extra weight to a potential move north this week.
Stepping across to the H4 chart, it’s clear to see that support materialized late Friday from a broken Quasimodo support line coming in at 17920, which forced price to highs of 18013 by the day’s end. Now, given what we’ve noted on the higher-timeframe picture (see above), we feel this H4 support will hold today and eventually punch this index back into the overhead daily supply mentioned above at 18153-18073. With this in mind, our attention will mostly be driven toward looking for lower timeframe long entries today between current price and 17920. If our analysis is correct, the weekly resistance at 18253 is where price is likely heading this week, so assuming one is able to pin down a buy setup it could work out very nicely indeed.
Levels to watch/live orders:
- Buys: 17920 region [Tentative – confirmation required] (Stop loss: dependent on where one confirms this area).
- Sells: Flat (Stop loss: N/A).
XAU/USD:
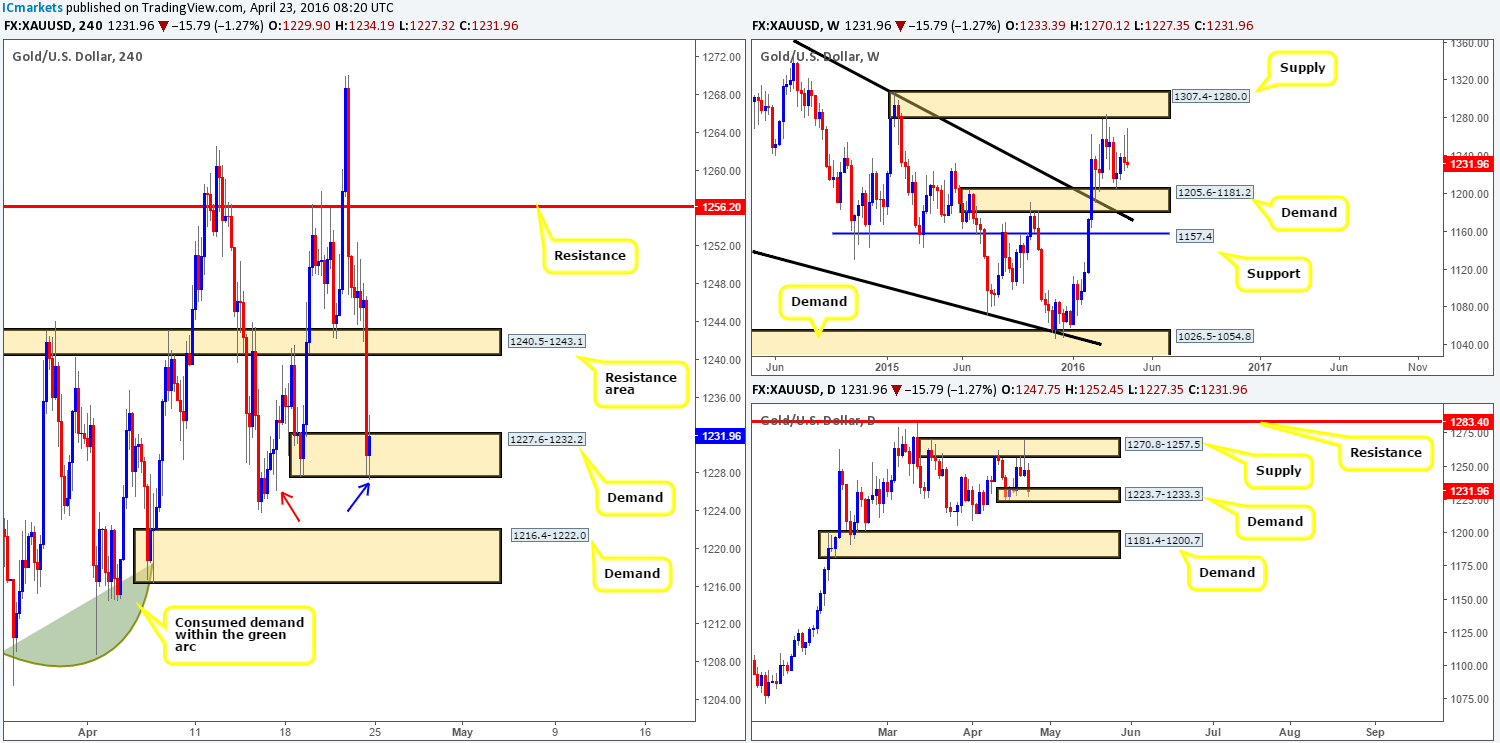
Although the precious metal ranged around $43 last week, price closed just over a $1 lower than the previous week’s close at 1231.9. What this did was form a rather large selling wick (similar to the previous week) mid-way between weekly supply drawn from 1307.4-1280.0 and demand coming in at 1205.6-1181.2. From our perspective, both areas hold approximately the same weight, and as such, the best we can do here is to keep an eyeball on the two zones for possible direction this week.
From the daily scale, trade ended the week closing within a small demand formed at 1223.7-1233.3. In light of the back-to-back weekly selling wicks and recent close lower (see above), this demand is likely to cave in with little supportive structure seen below until demand coming in at 1181.4-1200.7. This demand, nonetheless, commands respect owing to its first test forcing price to highs of 1284.4, and the fact that this demand was formed from the break of a considerable daily high to the left made on the 15th October at 1191.4.
A quick look at Friday’s trading on the H4 chart shows that the yellow metal broke through a H4 support area coming in at 1240.5-1243.1 (now acting resistance), and ended the day stabbing through H4 demand (see blue arrow) drawn from 1227.6-1232.2. In view of this and what we have noted above regarding the higher-timeframe picture, where do we go from here? With some longs likely squeezed out of the market from the current H4 demand, and demand just below likely consumed due to the long tail seen marked with a red arrow at 1226.1, we feel Gold is heading lower today/this week. The next available H4 demand, as far as we see, comes in at 1216.4-1222.0. Beyond here, price looks cramped and shows little active demand on the H4 timeframe until we reach daily demand at 1181.4-1200.7.
In light of the above points, our plan of action today will be to watch for price to close below the current H4 demand. If this comes to fruition, we’ll then move to step two which is watching for a retest of this area as supply followed by lower timeframe confirmation (for confirmation techniques, please see the top of this report). Should all of the above come into view, we’ll look to take partial profits at the H4 demand below at 1216.4-1222.0 and reduce some risk. From thereon, assuming price continues lower of course, we plan on trailing the remaining position down to the top-side of daily demand at 1200.7.
Levels to watch/live orders:
- Buys: Flat (Stop loss: N/A).
- Sells: Watch for price to consume 1227.6-1232.2 and look to trade any retest seen thereafter (lower timeframe confirmation required).