A note on lower timeframe confirming price action…
Waiting for lower timeframe confirmation is our main tool to confirm strength within higher timeframe zones, and has really been the key to our trading success. It takes a little time to understand the subtle nuances, however, as each trade is never the same, but once you master the rhythm so to speak, you will be saved from countless unnecessary losing trades. The following is a list of what we look for:
- A break/retest of supply or demand dependent on which way you’re trading.
- A trendline break/retest.
- Buying/selling tails – essentially we look for a cluster of very obvious spikes off of lower timeframe support and resistance levels within the higher timeframe zone.
- Candlestick patterns. We tend to only stick with pin bars and engulfing bars as these have proven to be the most effective.
For us, lower timeframe confirmation starts on the M15 and finishes up on the H1, since most of our higher timeframe areas begin with the H4. Stops usually placed 5-10 pips beyond your confirming structures.
EUR/USD:
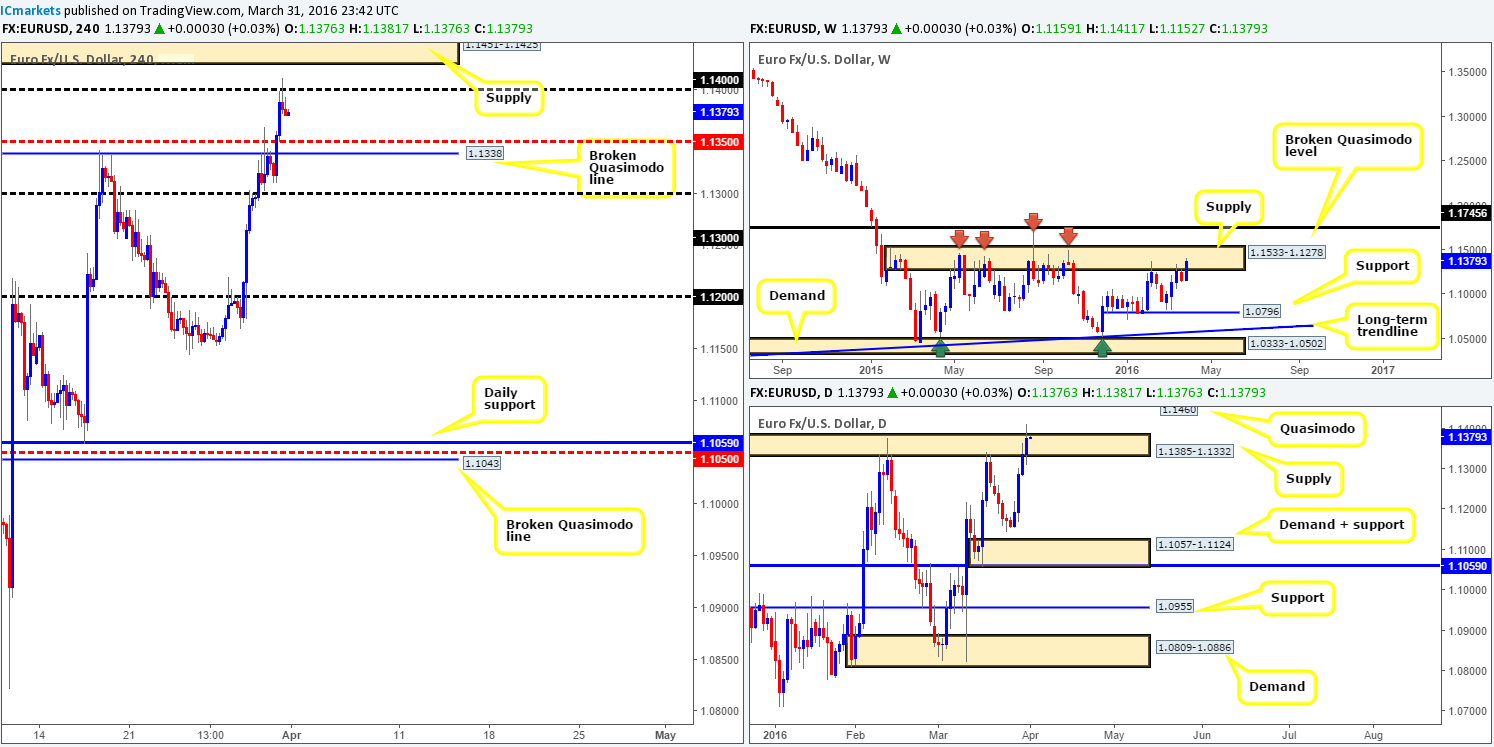
Starting with a quick look at the weekly chart this morning, we can see that despite the EUR being positioned within a major area of supply at 1.1533-1.1278 (held price lower since May 2015), the buyers continue to edge higher. The next key level above this zone can be seen at 1.1745 – a broken Quasimodo line. Daily action on the other hand shows that price recently punched through supply coming in at 1.1385-1.1332. This potentially wiped out a truckload of sellers’ stops and cleared the runway north up to 1.1460 – a clear-cut Quasimodo resistance line (located within the aforementioned weekly supply). Looking over at the H4 chart, offers were taken from the Quasimodo resistance line at 1.1338 alongside the mid-level barrier above at 1.1350 going into yesterday’s London session, forcing price to test the 1.1400 figure by the U.S. open.
Just so that we’re on the same page, let’s see what we have here. Weekly currently shows supply, indicating sells might be the path to take, whilst the daily shows potential for an upside move (see above). Therefore, one needs to be prepared for further buying into the weekly supply today! With that being said, the only area that really catches our eye is the H4 supply taken from 1.1451-1.1425 – sitting just above psychological resistance 1.1400 and just beneath the aforementioned daily Quasimodo resistance line. Should the EUR connect with this barrier today, waiting for lower timeframe confirmation is advisable. Reason being is a fakeout above the H4 area is highly likely due to the daily level lurking just above, and let’s not forget that it’s the mighty NFP release today, so as always, cautious trading is better trading!
Levels to watch/live orders:
- Buys: Flat (Stop loss: N/A).
- Sells: 1.1451-1.1425 [Tentative – confirmation required] (Stop loss: dependent on where one confirms this area).
GBP/USD:
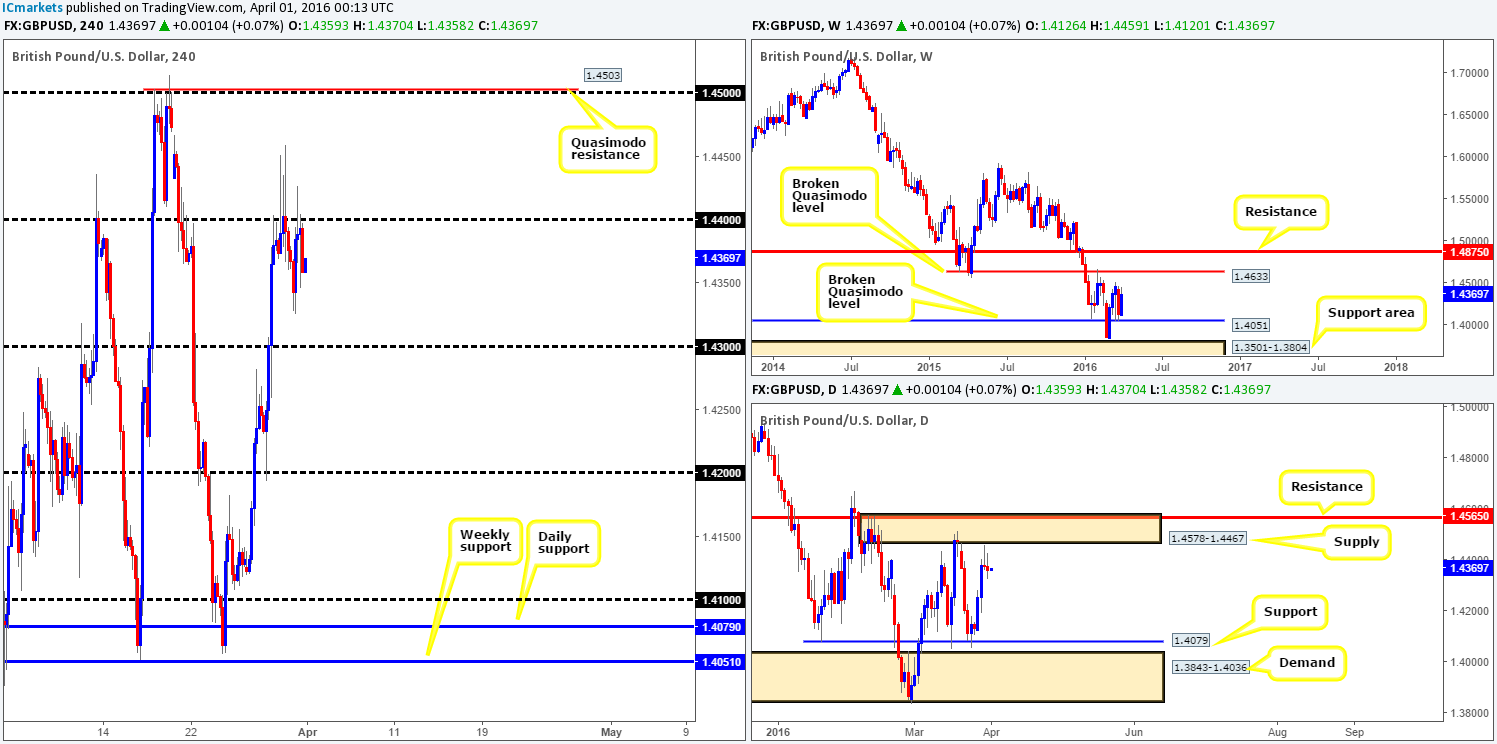
As can be seen from the H4 chart this morning, psychological resistance 1.4400 continues to provide a ceiling to this market, holding prices lower for two consecutive days now. Below the 1.4400 number, there appears room to run down to at least the 1.4300 line, whilst a break above 1.4400 opens the doors for prices to challenge the 1.4500 region.
Over on the daily chart, nonetheless, candle action still resembles somewhat of a bearish tone from where we’re standing. Two consecutive selling wicks with both candles closing in the red, and also the fact that Cable is trading directly beneath supply drawn from 1.4578-1.4467 suggests the bears may have an advantage here. Despite this, up on the weekly chart, the rebound from just above the broken Quasimodo line at 1.4051 still appears in reasonably good shape, with room being seen to advance at least until the 1.4514 region. Therefore, one needs to tread carefully if considering shorting this market!
With the above points in mind and the NFP data set to be released later on today, what levels take our fancy? Well, with somewhat conflicting signals coming in from the higher-timeframe picture (see above), the best we feel we can do is keep an eye on the round-number figures: 1.4400/1.4500/1.4300 for trade opportunities. We have purposely not marked up the mid-level hurdles 1.4450/1.4350 since the NFP volatility will likely stretch beyond these barriers to more extreme points. In closing, we would highly recommend not trading the above said levels in bold amid NFP today – trades are best taken pre/post this event!
Levels to watch/live orders:
- Buys: 1.4300 [Tentative – confirmation required] (Stop loss: dependent on where one confirms this level). Watch for price to consume 1.4400 and look to trade any retest seen thereafter (lower timeframe confirmation required).
- Sells: 1.4500 [Tentative – confirmation required] (Stop loss: dependent on where one confirms this level).
AUD/USD:
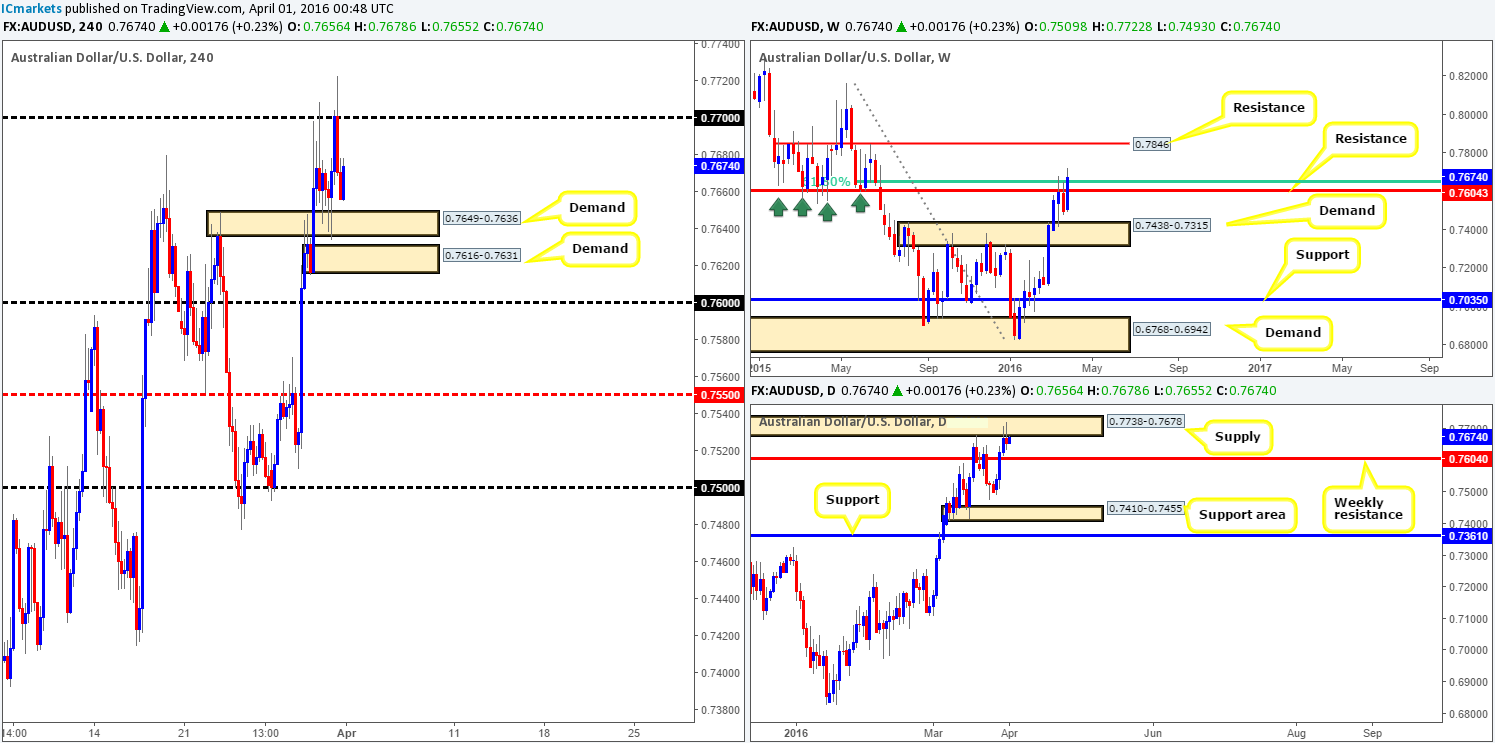
Kicking off our analysis with a quick peek at the weekly chart shows that the buyers and sellers continue to battle for position around the 61.8% Fibonacci resistance level at 0.7646. Judging purely on the candle action here, however, the bulls appear to be the favorites for the time being, with the current candle looking as though it wants to shake hands with resistance drawn from 0.7846. Casting our lines down into the daily chart, supply seen at 0.7738-0.7678 is currently suppressing buying pressure so weekly momentum could possibly begin to diminish here.
Winding down one more level to the H4 chart, price appears to be consolidating between the psychological resistance 0.7700 and demand coming in at 0.7649-0.7636. Now, if you ask us, it’s very unlikely the commodity currency will breakout beyond these barriers ahead of the U.S. employment report today. Due to the expected volatility during this event, nonetheless, we’ll be looking at the following structures beyond this range for trade opportunities:
Sells:
- H4 Supply at 0.7796-0.7775. This area, in our opinion, is the next fresh zone that will likely bounce prices. The areas below it have already been spiked thus reducing the chances of a reaction being seen.
Buys:
- Small H4 demand at 0.7616-0.7631. We’re not holding out much hope for this zone as the 0.7600 figure lurks just below and has ‘fakeout’ written all over it! In addition to this, 0.7600 lines up beautifully with the struggling weekly resistance line at 0.7604 which could potentially become support, thus adding weight here.
- Should the above buy zones fail, the H4 mid-level support 0.7550 will be the next port of call for a potential rebound as it’s held nicely as medium-term support and resistance since the 22nd March.
Levels to watch/live orders:
- Buys: 0.7616-0.7631 [Tentative – confirmation required] (Stop loss: dependent on where one confirms this area). 0.7600 [Tentative – confirmation required] (Stop loss: dependent on where one confirms this level). 0.7550 [Tentative – confirmation required] (Stop loss: dependent on where one confirms this level).
- Sells: 0.7796-0.7775 [Tentative – confirmation required] (Stop loss: dependent on where one confirms this area).
USD/JPY:
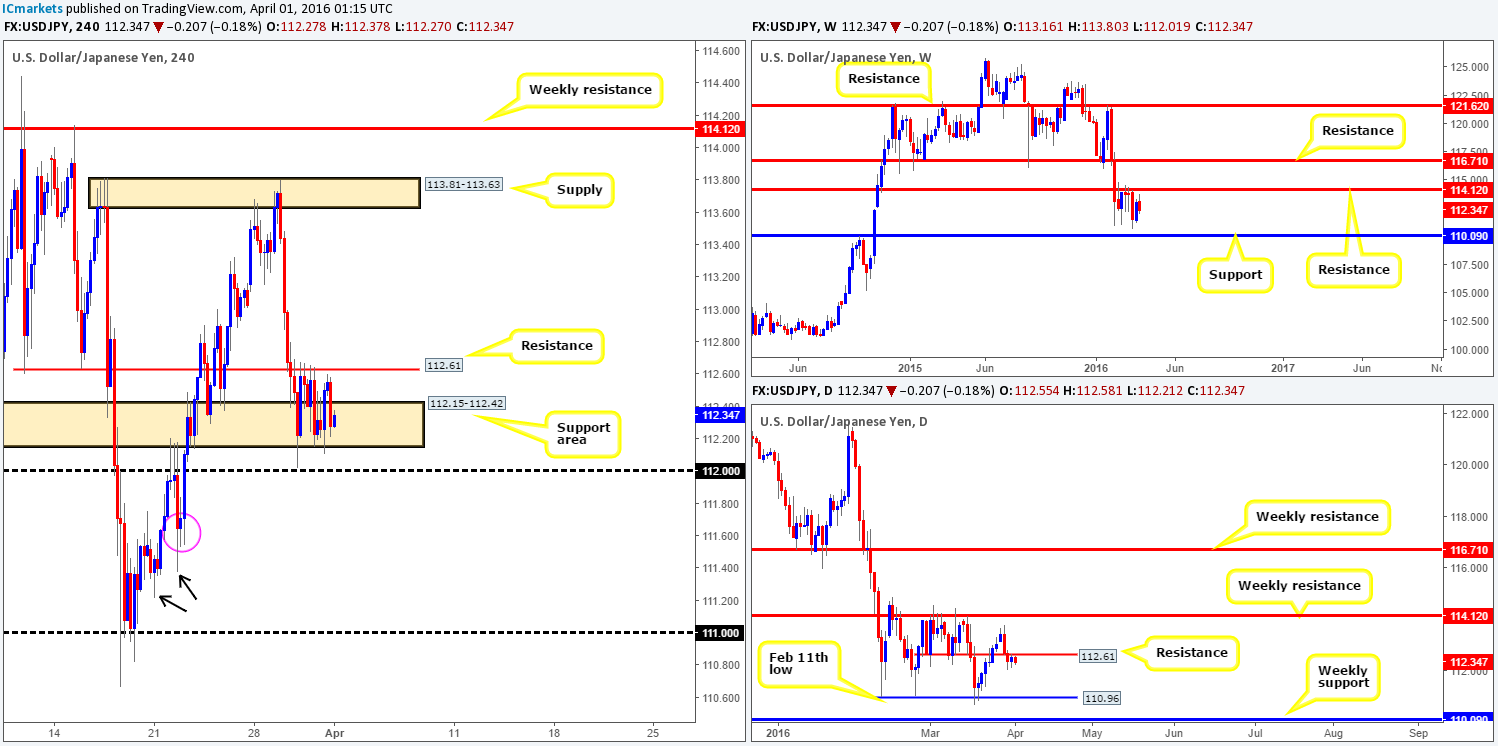
During the course of yesterday’s sessions, the USD/JPY remained fixed between the H4 support area at 112.15-112.42 and H4 resistance overhead at 112.61 (noted as resistance on the daily scale). Consequent to this rather lackluster performance, our outlook for this pair remains unchanged…
With stops likely removed from the current H4 support area, and some of the buying power consumed from 112.00, we’re looking for this unit to push lower today and possibly close beyond the 112.00 mark. Below this number we see little active H4 demand other than around the area marked with a pink circle at 111.53-111.71. Beyond here, however, there appears space for price to hit the 111.00 region, as demand seems to be consumed (see the H4 demand consumption tails marked with black arrows at 111.37/111.21).
In addition to the above, both the weekly and daily charts show clear space to move lower to at least daily support at 110.96 – effectively the 111.00 figure! On account of this, our plan of attack today will consist of watching for price to close below 112.00 and retest the underside of this line as resistance. Should we then manage to pin down a lower timeframe sell from here, we’d look to jump in short, and move our stop to breakeven once/if price reached the 111.60 mark. A close beyond this number would allow us to hold the position down to 111.00 – our final take-profit zone.
In light of the above, one needs to take into consideration that with the NFP report set to take center stage later on today, technicals may take a back seat, so as always, trade cautiously!
Levels to watch/live orders:
- Buys: Flat (Stop loss: N/A).
- Sells: Watch for price to consume 112.00 and look to trade any retest seen thereafter (lower timeframe confirmation required).
USD/CAD:
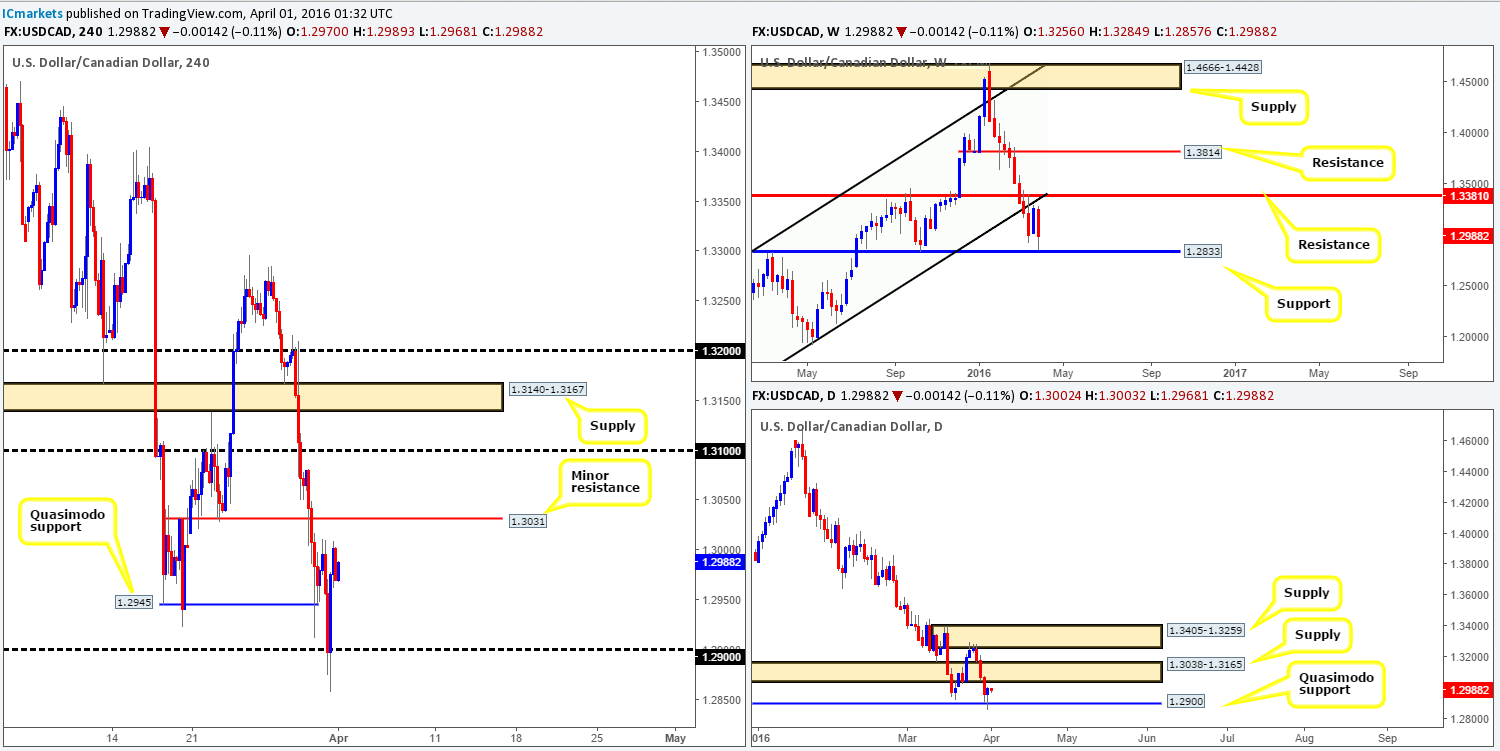
For those who read our previous report on the Loonie (see link below) you may recall us speaking about our lack of faith in the H4 Quasimodo support line at 1.2945 since it did not fuse with any higher-timeframe support. We went on to say that the 1.2900 handle below looks to be the more appealing area to buy from due to it also being a daily Quasimodo support. As can be seen from the chart, our analysis played out beautifully! We hope some of our readers took advantage of the bounce seen from the 1.2900 region.
Going into today’s sessions, nevertheless, things look a little trickier! Weekly activity came within 25 pips or so of connecting with a major support at 1.2833, whilst a bullish buying tail was printed on the daily chart from the daily Quasimodo support. This, at first glance, looks to be a sound base in which to hunt for longs. Be that as it may, we unfortunately see near-term H4 (minor) resistance looming overhead at 1.3031, which hovers just below daily supply at 1.3038-1.3165. Therefore, entering long at current prices would not likely be the best path to take!
In view of the above points, and the fact that the U.S. employment report takes the spotlight later on, we have humbly decided to step aside on this pair and reassess post NFP.
Levels to watch/live orders:
- Buys: Flat (Stop loss: N/A).
- Sells: Flat (Stop loss: N/A).
USD/CHF:
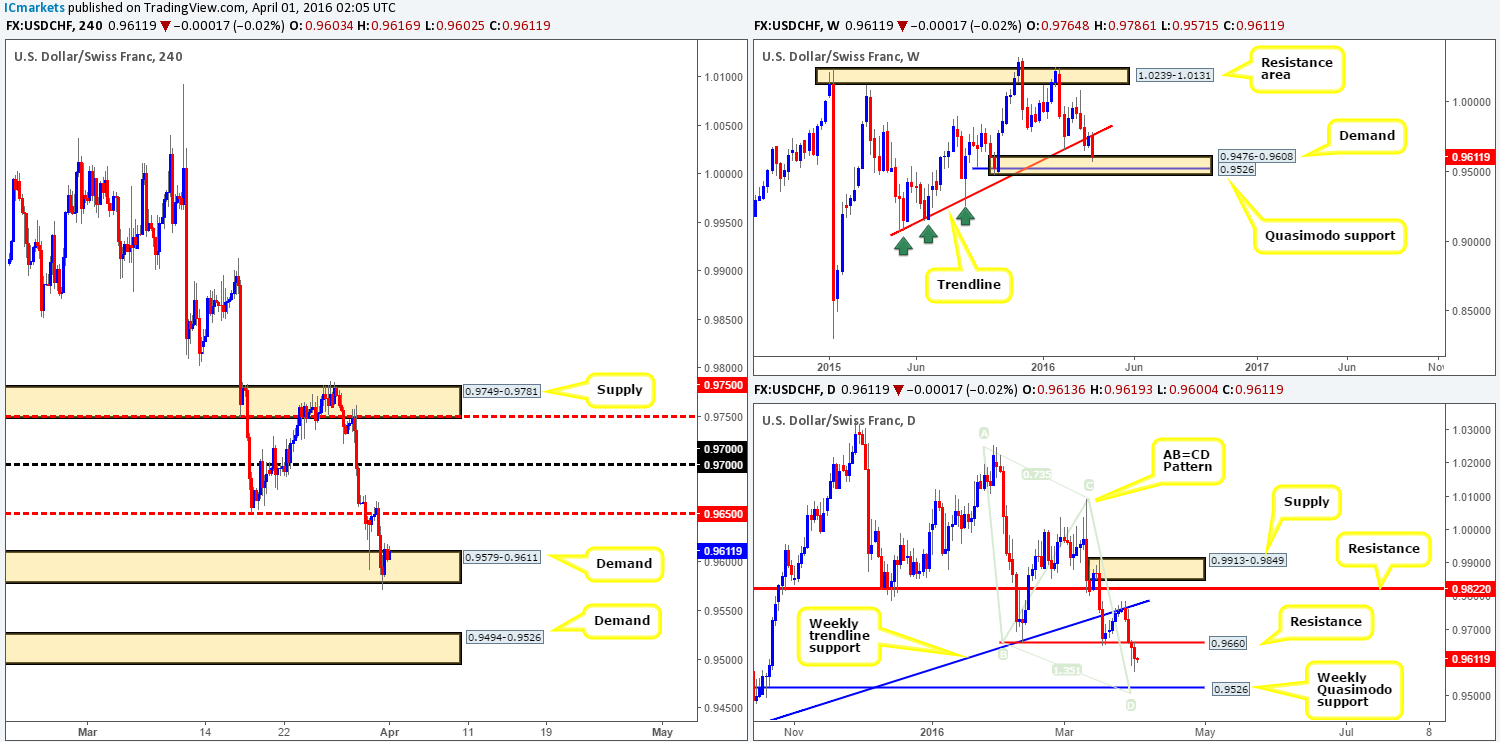
Using a top-down approach this morning, weekly trading recently came into contact with the top-side of demand penciled in at 0.9476-0.9608. As of yet, there’s been very little interest shown here from the buy-side of this market. Scrolling a page lower to the daily chart, we can see that yesterday’s daily candle retested the underside of resistance at 0.9660 and closed lower. Through the simple lens of a technical trader, room is being seen here for the Swissy to drive lower to the weekly Quasimodo support barrier at 0.9526. Not only does this weekly Quasimodo sit nicely within the extremes of the above said weekly demand, it also converges with the completion point of an AB=CD pattern at 0.9506. Turning our attention to the H4 chart, demand at 0.9579-0.9611 was slightly breached going into U.S. trading yesterday, which followed with a rebound to highs of 0.9620.
Given the situation on the higher-timeframe picture (see above) at the moment, and with stops likely taken from the current H4 demand, we feel price is headed south to plug into H4 demand coming in at 0.9494-0.9526. Seeing as how this area of demand ties in nicely with both the aforementioned weekly Quasimodo support and daily AB=CD completion point, this is certainly a high-probability turning point to keep an eyeball on today for longs. Usually, with confluence like this, our team would consider placing a pending buy order in the market. However, with the hard-hitting NFP report due to be released later on, we’d only enter long from here alongside lower timeframe buying confirmation (for confirmation techniques, see the very top of this report).
Levels to watch/live orders:
- Buys: 0.9494-0.9526 [Tentative – confirmation required] (Stop loss: dependent on where one confirms this area).
- Sells: Flat (Stop loss: N/A).
DOW 30:
Starting at the top this morning weekly supply at 17752-17552, despite suffering a break, continues to hold firm for the time being. It would be absolutely wonderful from a bearish standpoint to see the DOW close the week back below trendline resistance extended from the high 18365, as this would confirm bearish intent going into next week for us.
In previous reports, we’ve been discussing the possibility of entering short via a lower timeframe setup at the H4 resistance area drawn from 17811-17736, since it sits at the extremes of the above said weekly supply! Unfortunately, we have not been able to pin down anything attractive enough to short, and it looks like we may have run out of time as price is now within shouting distance of the H4 broken Quasimodo support line at 17644.
There is very little that jumps out to us this morning with ‘trade me’ written on it, mainly due to the fact that structure on the H4 is rather tight with not much room for price to breathe. This, coupled with the NFP report likely to cause some havoc later on, opting to stand on the sidelines today is the route we’ve chosen to take.

Levels to watch/live orders:
- Buys: Flat (Stop loss: N/A).
- Sells: Flat (Stop loss: N/A).
XAU/USD: (Gold)
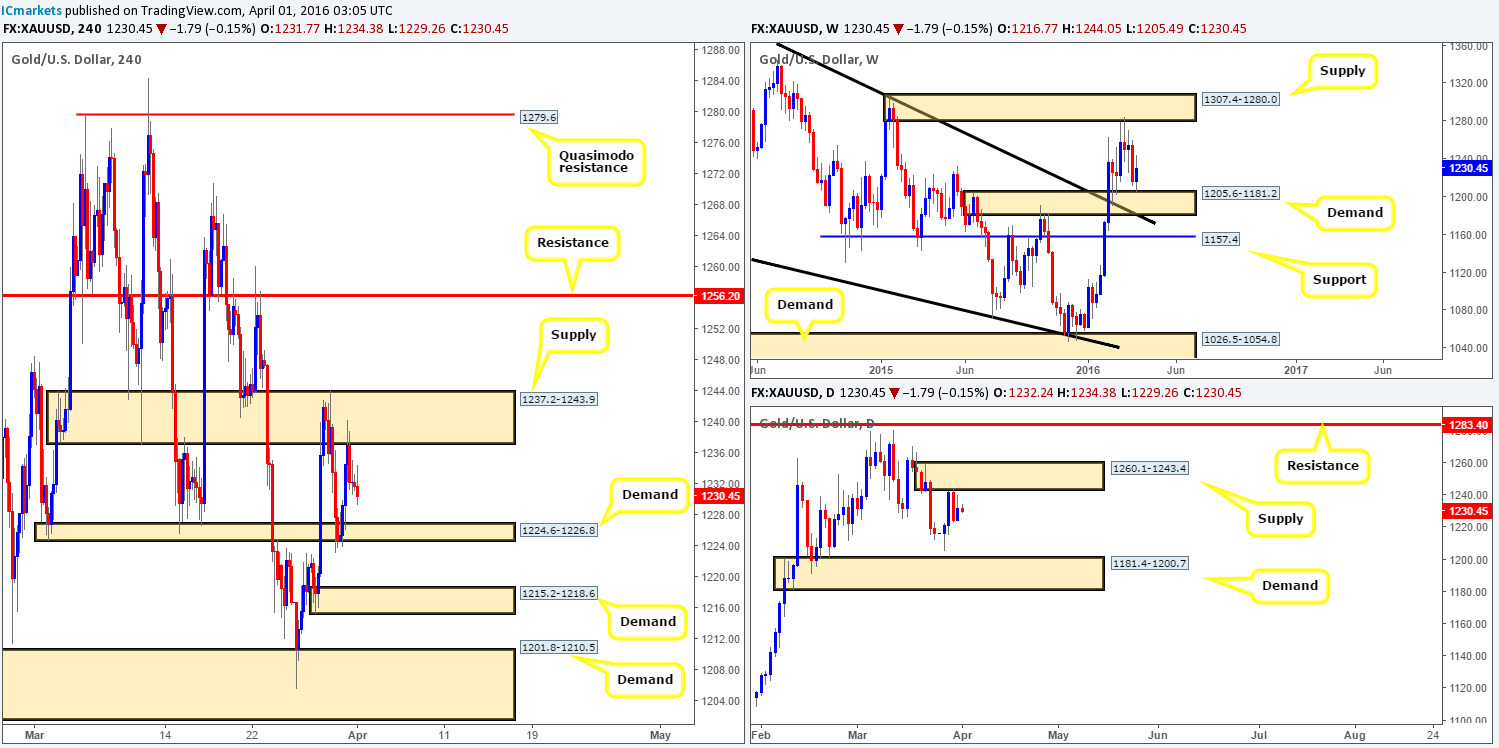
It was an early start for the yellow metal yesterday as a heavy round of bids flooded the market, bringing prices up to H4 supply at 1237.2-1243.9 by London lunchtime. It was only once the U.S. session opened its doors did we see Gold rebound from here to lows of 1223.8.
At this point, price is considered trading mid-range between the aforementioned H4 supply and H4 demand coming in at 1224.6-1226.8, and we feel it’s unlikely to see a break beyond these barriers ahead of the U.S. employment report today. In light of this, here is what we’re planning to watch during and post NFP:
Sells:
- H4 resistance at 1256.2. The reason we’ve chosen this line for shorts is simply because it’s positioned nicely within daily supply at 1260.1-1243.4.
Buys:
- Although we like the overall form of the H4 demand at 1215.2-1218.6, the larger zone directly below at 1201.8-1210.5 is far more attractive for longs in our opinion, due to it sitting within weekly demand at 1205.6-1181.2, and just above daily demand at 1181.4-1200.7.
Although, we’re watching these areas during the heavy-hitting NFP, we will not trade during the release itself. We usually give the market 5-10 minutes to let the dust settle before assessing what’s what.
Levels to watch/live orders:
- Buys: 1201.8-1210.5 [Tentative – confirmation required] (Stop loss: dependent on where one confirms this area).
- Sells: 1256.2 [Tentative – confirmation required] (Stop loss: dependent on where one confirms this level).