
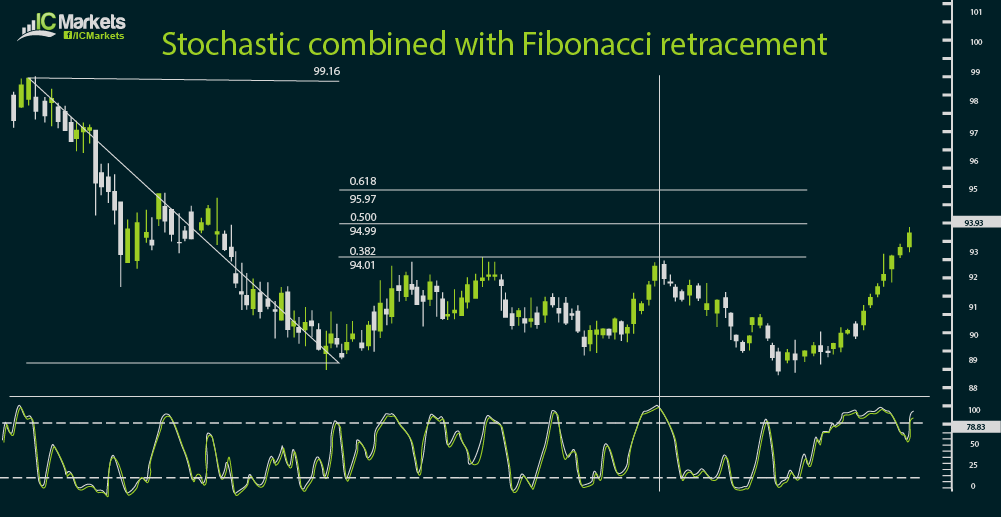
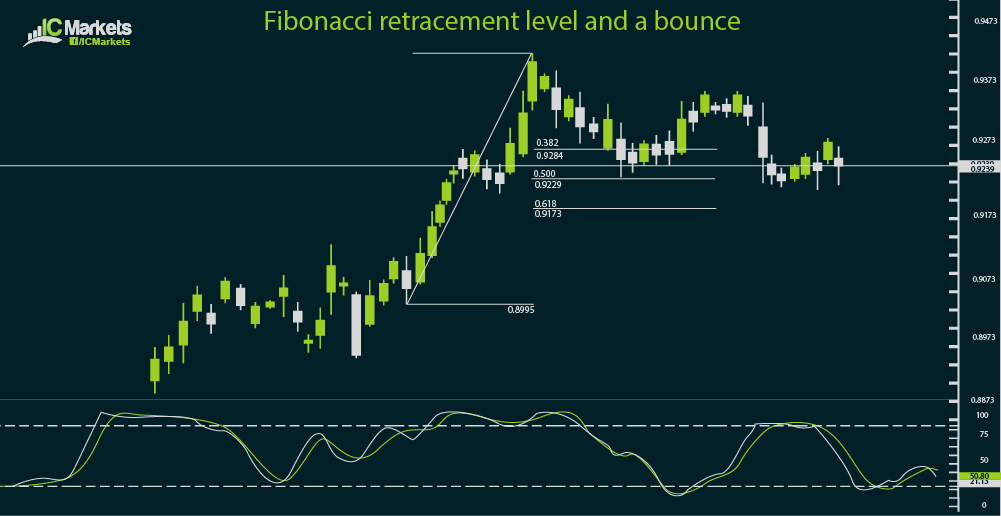
The use of Fibonacci retracement and extension levels could also be combined with technical indicators. For instance, one can enter at market when stochastic has already made a turn from the overbought or oversold area and price is showing signs of bouncing off a Fibonacci level.
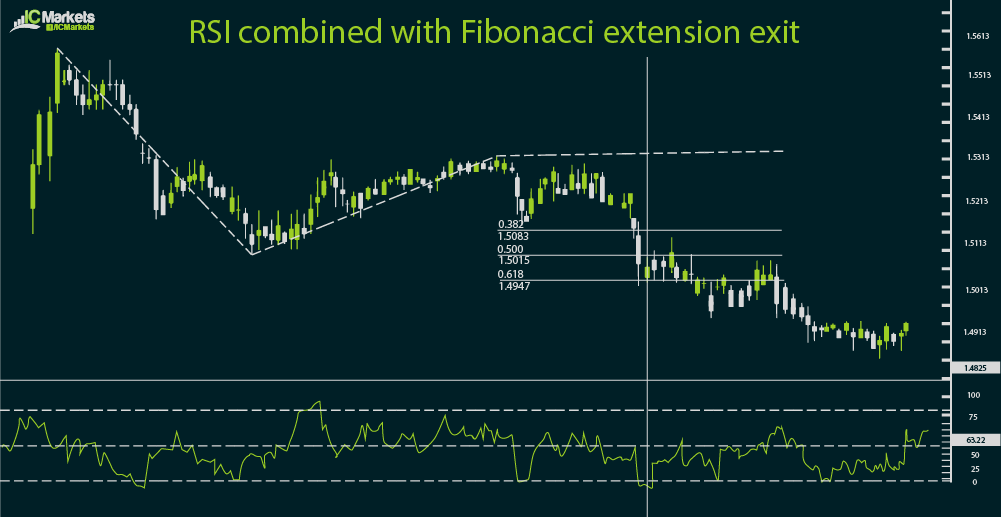
Similarly, one can decide to exit a trade at market when price is testing a Fibonacci extension level while RSI is moving out of the oversold or overbought area.
Another way to look for confirmation when using Fibonacci retracement and extension levels as entry and exit points would be to look at Japanese candlestick formations. As discussed in earlier sections, these tend to be reliable signals of a reversal in price action.
In particular, a doji forming right on a Fibonacci retracement level could be a sign that price is ready to turn. For additional confirmation, you can apply technical indicators such as stochastic or MACD to determine if it’s a good time to enter a trade or not.
Take note though that using too many technical indicators doesn’t necessarily improve their reliability. In fact, too much indicators might lead to an extremely cautious trading strategy that misses out on several valid trade signals.
Seasoned traders often say that the best trading systems are the simplest ones, and it can’t get any simpler than watching basic candlestick patterns. It can be difficult to memorize the formations, particularly the group candlestick patterns, and those might be rare to spot. At the end of the day though, this is said to be one of the most reliable ways of spotting a possible reversal or trend continuation.
A spinning top on a Fibonacci retracement level could also serve as a sign of a market turn. Evening or morning stars could be signals that the Fibonacci retracement or extension level could hold as an inflection point.
Generally speaking, these candlestick patterns combined with Fibonacci levels tend to work better on longer-term time frames. However, there’s no reason to not use these for scalping or shorter-term day trade setups. What’s important is that you have a strong grasp of how these inflection points are used and what the candlestick patterns mean.


