A note on lower timeframe confirming price action…
Waiting for lower timeframe confirmation is our main tool to confirm strength within higher timeframe zones, andhas really been the key to our trading success. It takes a little time to understand the subtle nuances, however, as each trade is never the same, but once you master the rhythm so to speak, you will be saved from countless unnecessary losing trades. The following is a list of what we look for:
- A break/retest of supply or demand dependent on which way you’re trading.
- A trendline break/retest.
- Buying/selling tails – essentially we look for a cluster of very obvious spikes off of lower timeframe support and resistance levels within the higher timeframe zone.
- Candlestick patterns. We tend to only stick with pin bars and engulfing bars as these have proven to be the most effective.
EUR/USD:
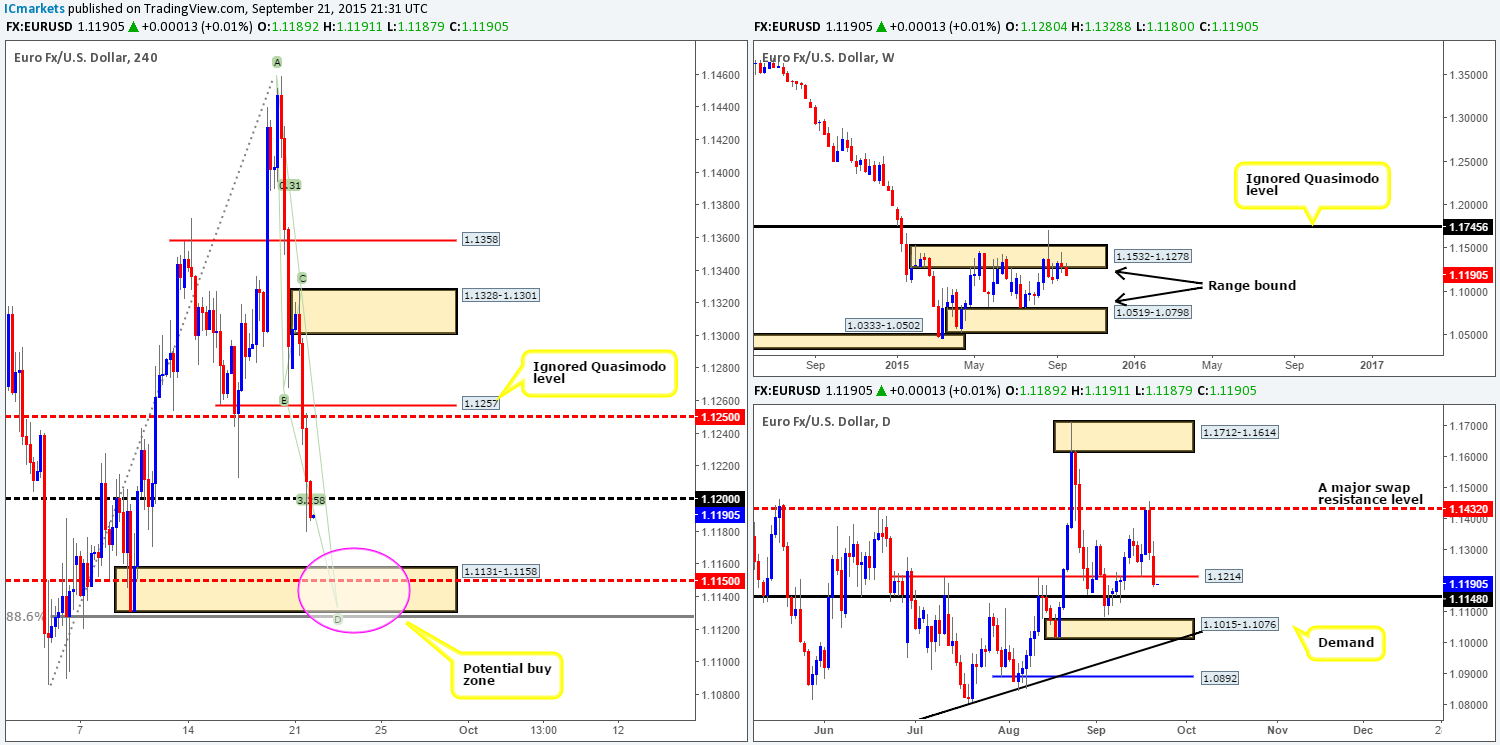
Despite the brief surge of (short-covering) buying seen at the beginning of yesterday’s open (1.1280), the EUR heavily sold off for the remainder of the day. Consequent to this, the Quasimodo support at 1.1257, as well as the psychological support 1.1200 was wiped out.
Should 1.1200 hold as resistance going into the more liquid sessions today, we believe the EUR is once again going to head south, potentially connecting up with demand at 1.1131-1.1158.
Supporting a decline from this number, we can see weekly action still loitering within supply at 1.1532-1.1278, and the daily chart showing price has recently closed below a swap support barrier at 1.1214. However, we would only short from 1.1200 should we manage to spot a lower timeframe setup that allowed a small stop, since there’s only forty or so pips on the table down to the aforementioned demand.
In the event the above plays out and price drives lower, we would also be interested in buying (with confirmation) from this demand for the following reasons:
- Supported by a daily swap (support) level at 1.1148.
- Mid-level support seen just within the demand at 1.1150.
- AB=CD bullish pattern which completes at 1.1133.
- Deep 88.6% Fibonacci support just below the zone at 1.1127 (watch for a fakeout here).
The only downside to this trade is that there’s little converging weekly support. In fact, by entering long from the above said 4hr demand zone, one would potentially be going up against weekly flow. That being said though, due to the amount of confluence seen, we’re confident a bounce north at the very least will take place from here.
Levels to watch/live orders:
- Buys:1.1131-1.1158 [Tentative – confirmation required] (Stop loss: dependent on where one confirms this area).
- Sells:1.1200 [Tentative- confirmation required] (Stop loss: dependent on where one confirms this level).
GBP/USD:
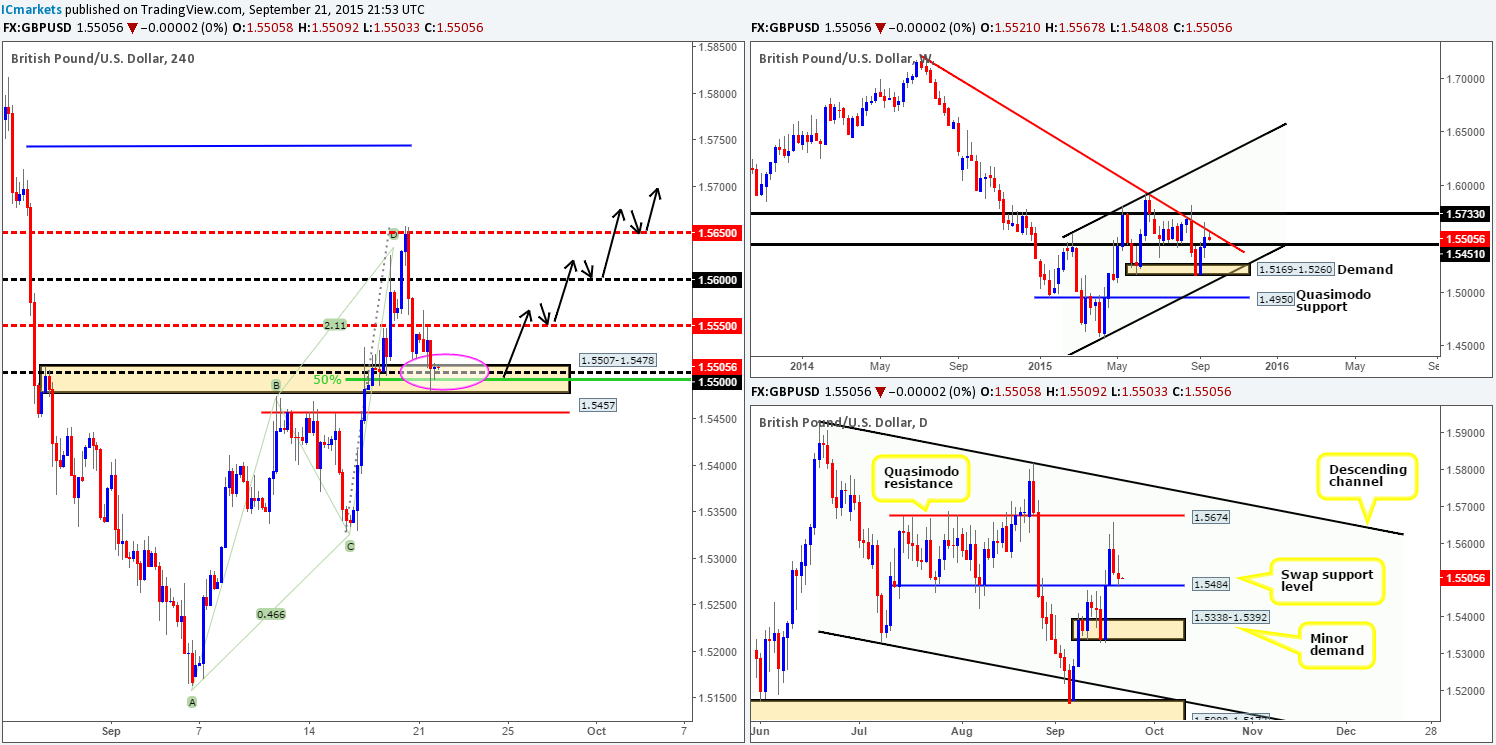
Yesterday’s open 1.5521 saw Cable immediately begin to rally. This, as you can see, eventually forced price to test offers at a mid-level hurdle drawn from 1.5550 going into London trade. From here, offers successfully pushed this market deep into a swap demand area coming in at 1.5507-1.5478 going into the close 1.5505.
For those who read our analysis on a regular basis, you may recall us mentioning http://www.icmarkets.com/blog/monday-21st-september-weekly-technical-outlook-and-review-japanese-bank-holiday-today/ to keep an eye on the aforementioned swap demand area for confirmed buying opportunities yesterday. As we can see, price is holding firm here, and, in our opinion, will likely continue to do so as long as bids remain strong around both the daily swap (support) level at 1.5484 and the weekly swap (support) level 1.5451.
As of yet though, our team has been unable to pin-point a lower timeframe entry long here. With that in mind, today’s objective is relatively simple: continue watching how price responds to this area. Should we manage to spot a lower timeframe entry, partial profits would immediately be taken at 1.5550, and from thereon we’d look to trail price behind lower timeframe supports in the event the market continued to push north. Opportunities to pyramid long position may be seen during the week should price break above and retest the following numbers: 1.5500/1.5600/1.5650 (black arrows).
Levels to watch/ live orders:
- Buys: 1.5507-1.5478 [Tentative – confirmation required] (Stop loss: 1.5469).
- Sells: Flat (Stop loss: N/A).
AUD/USD:
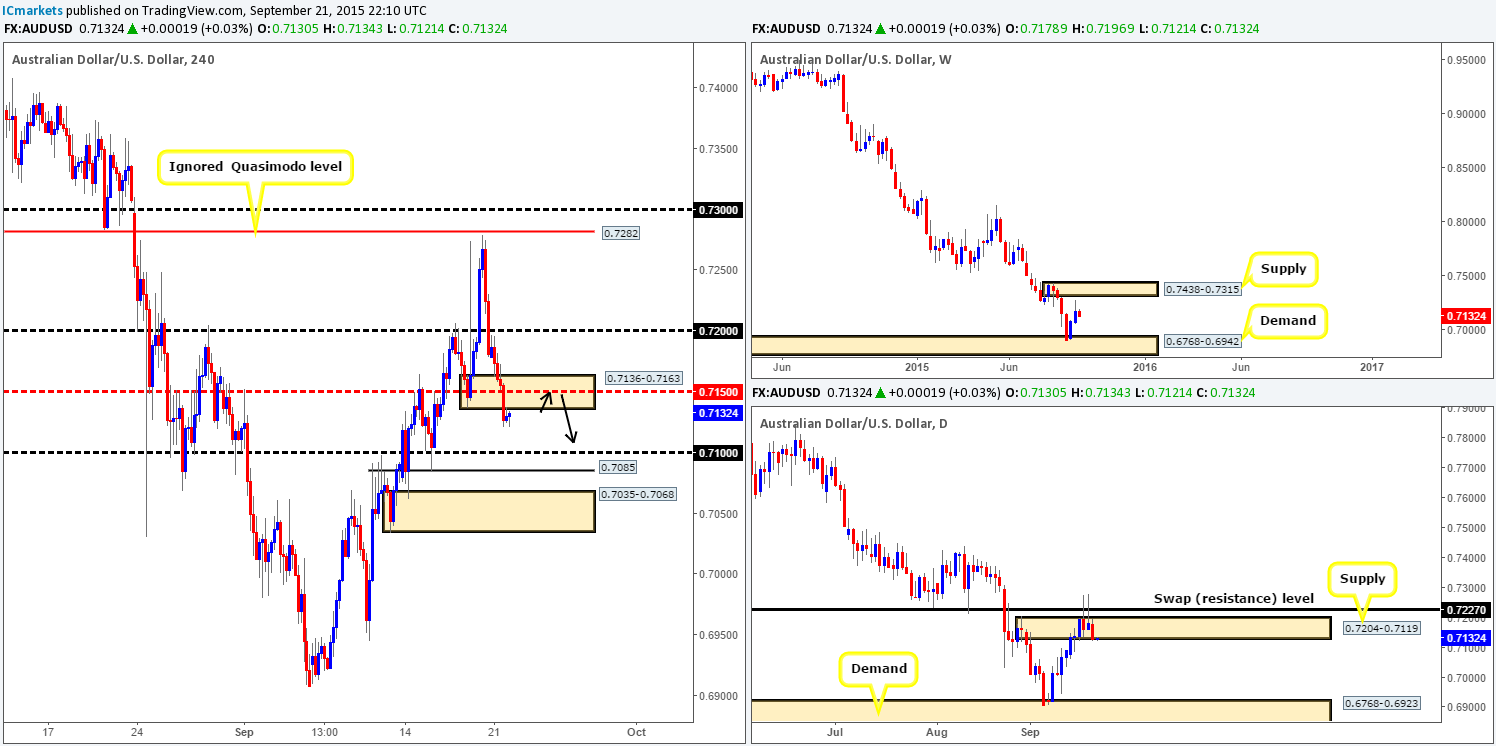
On the whole, the AUD/USD pair sold off during yesterday’s trade. The only noticeable buying pressure was seen at the open 0.7178 which managed to only reach highs of 0.7196.
Cast your minds back to yesterday’s report: http://www.icmarkets.com/blog/monday-21st-september-weekly-technical-outlook-and-review-japanese-bank-holiday-today/ where we stated that we had little interest in buying from demand at 0.7136-0.7163. Instead, we were looking for a deep push into this zone and a break below/retest of the mid-level hurdle seen within it at 0.7150. Well, as you can see, we’ve had the push down, but as of yet, no retest of 0.7150.
In the event that price does rally today to connect with unfilled offers sitting around the 0.7150 mark before hitting 0.7100, we’d be very interested in shorting (with confirmation) from this figure. The reason comes from not only seeing moderate selling interestfrom just below weekly supply at 0.7438-0.7315, but also back-to-back selling wicks on the daily scale, that, on two occasions, stabbed through two significant resistances (0.7204-0.7119/0.7227). Should the above play out, we’ll be eyeing 0.7100 as our immediate take-profit area, followed closely by 0.7085 and demand at 0.7035-0.7068.
Levels to watch/ live orders:
- Buys: Flat (Stop loss: N/A).
- Sells: 0.7150 [Tentative – confirmation required] (Stop loss: dependent on where one confirms this level).
USD/JPY:
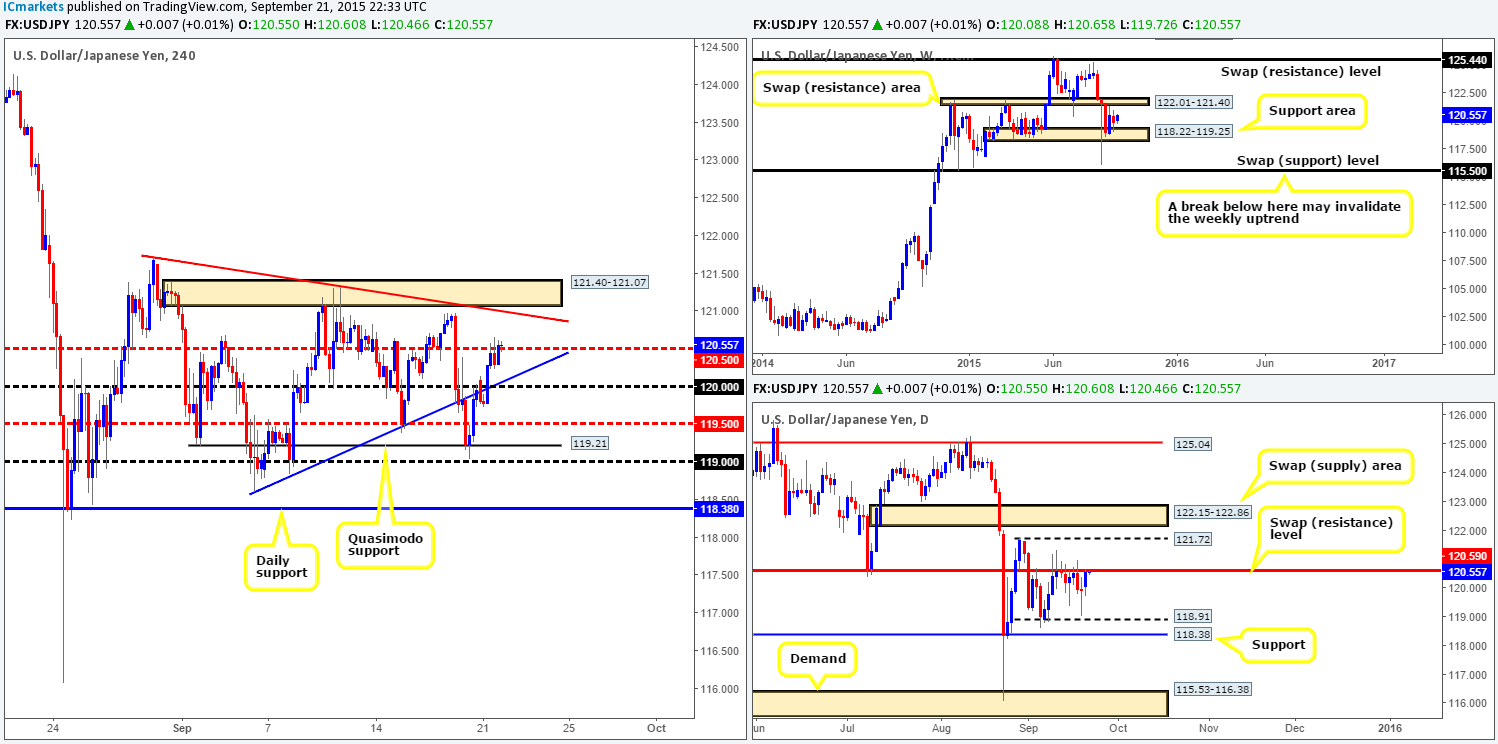
The USD/JPY pair saw a conservative stream of offers come into the market at the open 120.08 yesterday, pulling price down to lows of 119.72 on the day. From here, however, price turned bullish going into European trade. Psychological resistance 120.00 was taken out and the mid-level number 120.50 was brought into the action.
Only recently, as you can see, price slightly closed above this mid-level barrier, indicating that this market may head higher towards either the down trendline (121.72) or the 4hr supply base just above it at 121.40-121.07.
Time to begin buying, maybe? Not so fast cowboy! Granted, weekly action shows little near-term resistance on the horizon. However, scaling down to the daily timeframe, we can see price is currently flirting with a daily swap (resistance) level coming in at 120.59.
Therefore, we’re left with two choices. Should price retest 120.50 as support and show some form of lower timeframe buying confirmation, we could enter long targeting the 121.00 mark. Conversely, we could just ignore this signal, and wait for a more conducive area to trade from which is clear of higher timeframe obstacles.
We have chosen the latter, as trading when unsure is as good as giving money over to the market in our opinion.
Levels to watch/ live orders:
- Buys:Flat (Stop loss: N/A).
- Sells:Flat (Stop loss: N/A).
USD/CAD:
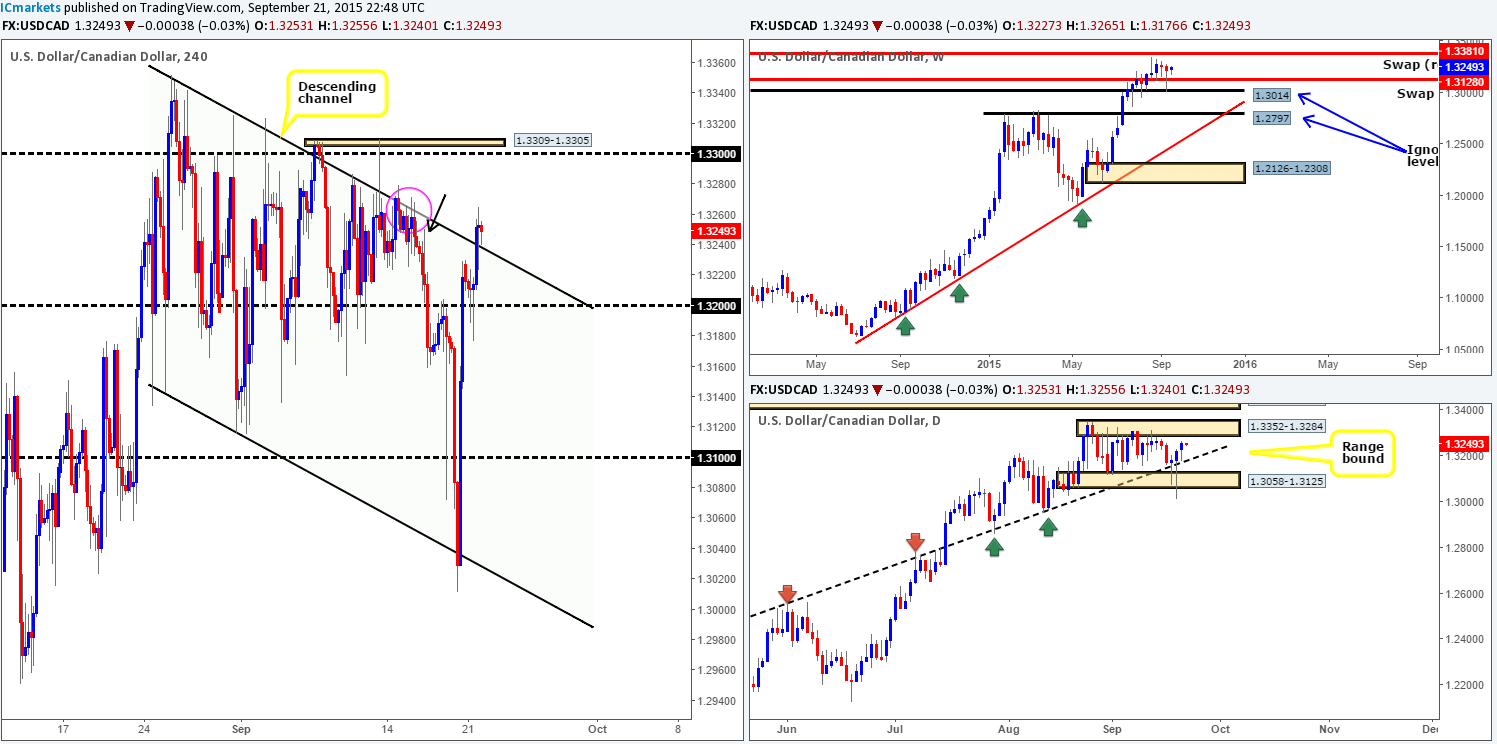
For those who read our previous report on the USD/CAD: http://www.icmarkets.com/blog/monday-21st-september-weekly-technical-outlook-and-review-japanese-bank-holiday-today/, you may recall us mentioning to watch the psychological support 1.3200 for potential buys yesterday. As can be seen from the chart, the open 1.3227 saw a steady ripple of offers come into the market, which consequently retested 1.3200 as support. Unfortunately, we were unable to find suitable lower timeframe price action to enter long from here, well done to any of our readers that did!
Following price retesting 1.3200, we also noted to watch for a break above and retest of the upper channel resistance (1.3352), which appears to be taking place as we write. As of yet, we have not been able to pin-point a lower timeframe entry long from here, but we’re confident that should we see a bullish signal, this market will rally up to around the 1.3300 number. The reason for why is we believe that the majority of offers have already likely been consumed at the 4hr supply marked with a pink circle at 1.3271-1.3249 by the wick noted with a black arrow (16/09/2015) at 1.3250.
In addition to the above, there is room for this market to appreciate on both the weekly and daily timeframes. The next upside target on the daily chart comes in around supply 1.3352-1.3284, while on the weekly we have 1.3381 – a swap resistance level.
Levels to watch/ live orders:
- Buys:Watch for any lower timeframe confirmed entries off the back of the 4hr upper channel resistance taken from the high 1.3352 (confirmation required).
- Sells: Flat (Stop loss: N/A).
USD/CHF:
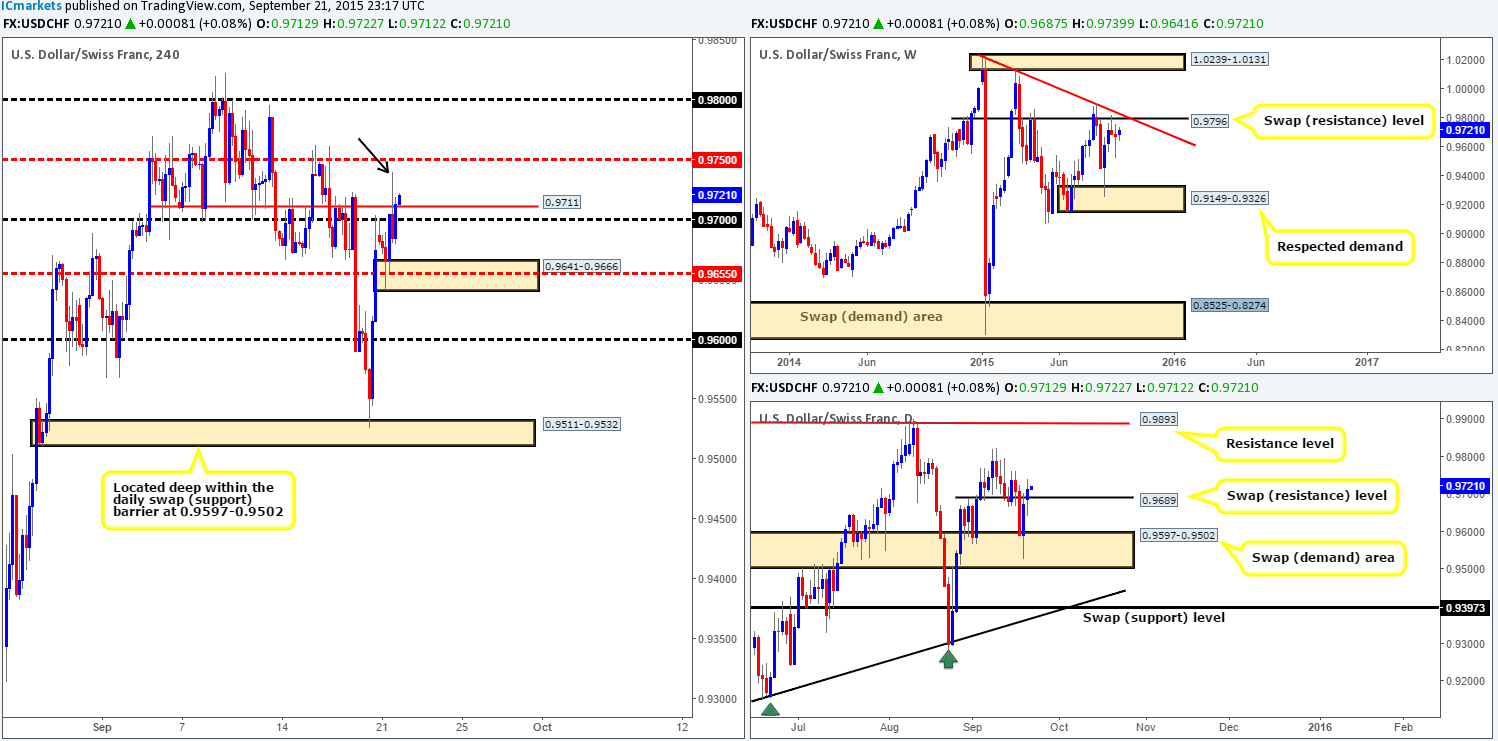
Yesterday’s open 0.9687 saw price attack offers around the psychological resistance 0.9700, resulting in this market dropping lower to test bids sitting at the mid-level hurdle 0.9655. As is evident from the chart, the 0.9655 region held firm which pressured the USD/CHF back up to 0.9700. After a slight bounce lower here, offers were removed from this area and price closed above not only this number but also aswap (resistance) level at 0.9711 as well.
Above 0.9711, there appears to be little active supply left within this market until we reach 0.9750. We say this simply because of that large and rather obvious supply consumption wick seen marked with a black arrow at 0.9739. If 0.9750 is taken out, however, there is, as far as we can see, space to continue rallying up to the 0.9800 figure since there’s also little supply to the left seen between these two levels.
Furthermore, supporting an advance, we can see that daily action recently closed above a swap resistance level at 0.9689, which should now act as support. What is more, there is little resistance seen on the weekly timeframe until price hits 0.9796 – a swap resistance barrier.
Given the points above, our team has decided to focus their efforts on looking for confirmed longs into this market today off the back of 0.9711/0.9700. Should we succeed in finding a lower timeframe entry long from here, we’ll closely watch how price responds to 0.9750. Ultimately though, we’re looking for this number to break so we can continue holding our position up to the 0.9800 number, which closely converges with the aforementioned weekly swap (resistance) level.
Levels to watch/ live orders:
- Buys:0.9711 [Tentative – confirmation required] (Stop loss: dependent on where one confirms this level).
- Sells: Flat (Stop loss: N/A).
DOW 30:
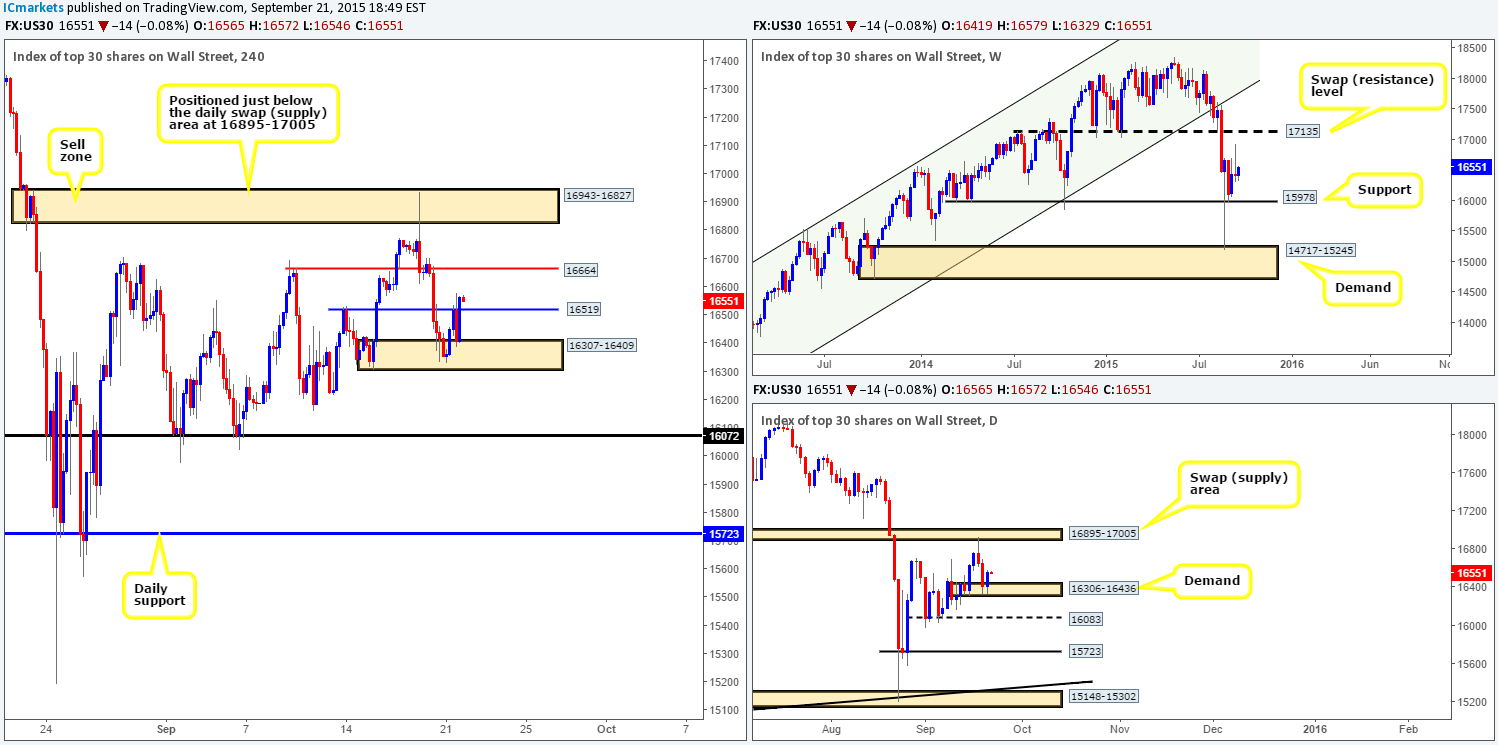
Immediately following the open 16419, the DOW index continued to sell-off into demand at 16307-16409. At this point, we really thought this barrier was going to break. However, as you can see, it didn’t. Bids held this market here beautifully, pushing price up to a 4hr swap resistance level at 16519 which saw a slight response but did eventually give way.
Considering that daily action shows price reacted from demand at 16306-16436 and also shows room to continue appreciating further up to daily swap supply at16306-16436, further buying is possible today up to at least 16664.That being the case, as long as price retests 16519 as support, we’ll then begin looking for intraday (confirmed) buys up to 16664.
Now, this may not make sense from a higher timeframe perspective, but assuming that price reaches 16664 today, we’ll close out any longs we have and look to sell (with confirmation). The reason being is this area iscompletely fresh and has ‘rebound’ written all over it! Nevertheless, considering this would be somewhat against the flow of daily buyers, we’d exit our short at the first sign of buying pressure and move our stop to breakeven.
It will be interesting to see how today plays out.
Levels to watch/ live orders:
- Buys: 16519 [Tentative – confirmation required] (Stop loss: dependent on where one confirms this level).
- Sells:16664 [Tentative – confirmation required] (Stop loss: dependent on where one confirms this level).
XAU/USD: (Gold)
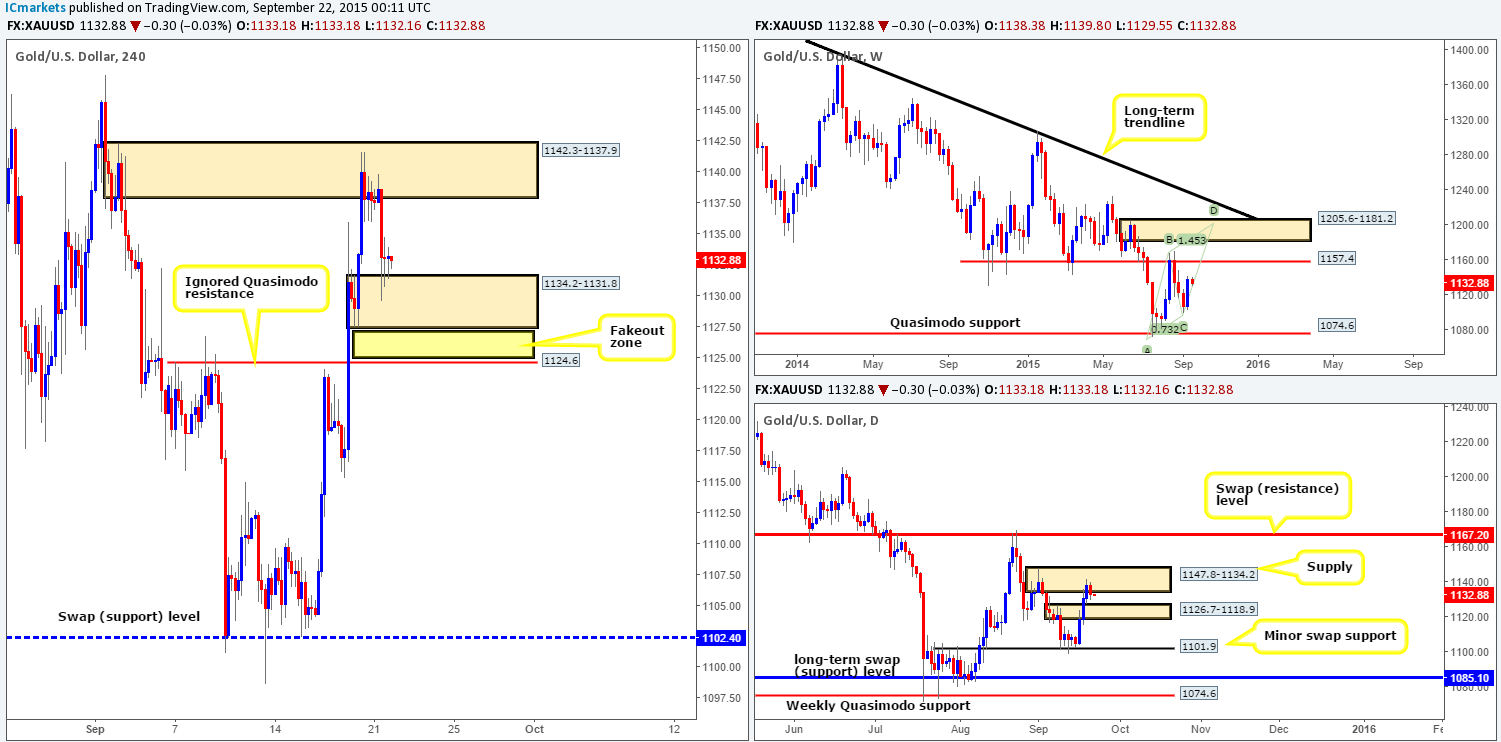
For those who read our previous report on Gold: http://www.icmarkets.com/blog/monday-21st-september-weekly-technical-outlook-and-review-japanese-bank-holiday-today/, you may recall us mentioning to watch for potential (confirmed) sells at supply drawn from 1142.3-1137.9. Following the open 1138.3, there was some hesitation seen within this zone, but as you can see, price eventually did decline lower consequently crossing paths with demand at 1134.2-1131.8. Unfortunately, we were not around when price fell so we missed this move altogether. Well done to any of our readers who managed to lock in some green pips from this drop in value.
Seeing as price has done exactly as we expected, much of today’s outlook will be similar to yesterday’s report. We stated that should price hit the aforementioned demand that we would not be interested in looking to buy from here, and this still holds. Instead, we’re looking to enter long at 1124.6 – an ignored Quasimodo level positioned just below this demand. Why this level, and not the demand? Well, for starters, this demand area has ‘fakeout’ written all over it. It may look fresh, but this may be to tempt traders to buy here, and place their stops where? You guessed it! Right below the zone – a perfect pool of liquidity to buy into, hence the fakeout zone. In addition to this, if you scan across to the daily timeframe, you will notice that this ignored Quasimodo level sits nicely within the recently broken supply at 1126.7-1118.9, and the fresh 4hr demand does not! Which area would you rather buy at???
Even though we’re confident a bounce will be seen from 1124.6 should price reach this number today, we still insist on waiting for lower timeframe price action here. The reason for why is to simply avoid any fakeouts that may be seen around this level. There’s nothing worse than getting stopped out to-the-pip and then price rallying to your target!
Levels to watch/ live orders:
- Buys: 1124.6 [Tentative – confirmation required] (Stop loss: dependent on where one confirms this level).
- Sells: Flat (Stop loss:N/A).