
A note on lower timeframe confirming price action…
Waiting for lower timeframe confirmation is our main tool to confirm strength within higher timeframe zones, andhas really been the key to our trading success. It takes a little time to understand the subtle nuances, however, as each trade is never the same, but once you master the rhythm so to speak, you will be saved from countless unnecessary losing trades. The following is a list of what we look for:
- A break/retest of supply or demand dependent on which way you’re trading.
- A trendline break/retest.
- Buying/selling tails – essentially we look for a cluster of very obvious spikes within the higher timeframe zone.
- Candlestick patterns. We tend to only stick with pin bars and engulfing bars as these have proven to be the most effective.
EUR/USD:
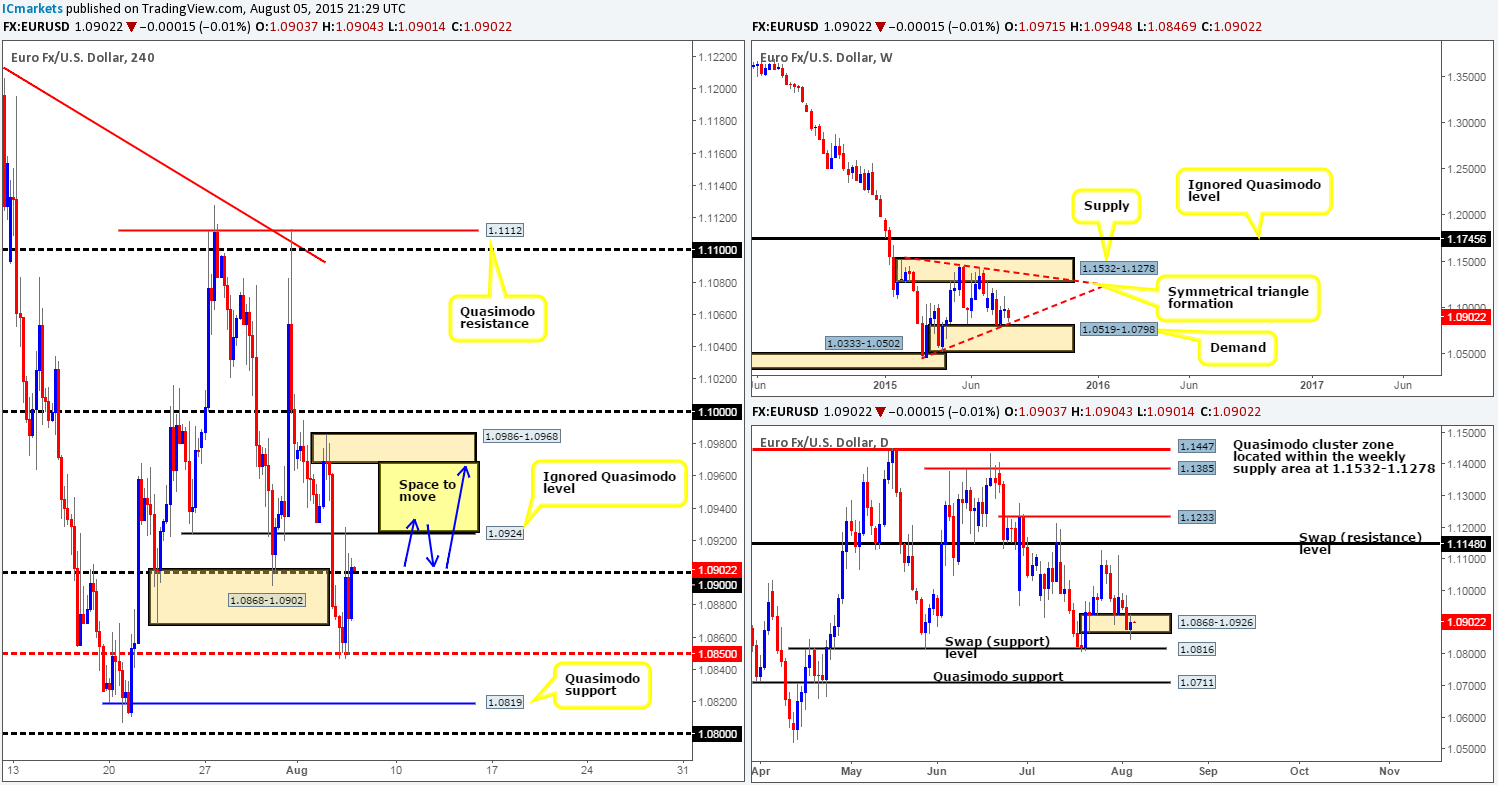
During the course of yesterday’s sessions, we saw the Euro punch through bids sitting within 4hr demand at 1.0868-1.0902 and find support at the mid-level hurdle 1.0850. Following a few hesitant stabs at this number, strong bids came into the market from here mid-way through London, consequently hitting and extending past 1.0900 into a 4hr ignored Quasimodo level coming in at 1.0924.
Given the above, the bigger picture shows price faked below a minor daily demand area seen at 1.0868-1.0926, and came very close to crossing swords with the weekly ascending trendline extended from the low 1.0461. With this in mind, our attention will be mostly driven towards longs today.
In the event that price can close above both 1.0900 and 1.0924 (effectively removing any willing offers from these zones), we may look to buy on any respectable retracement seen back towards 1.0900 (lower timeframe confirmation required). Should this trade opportunity come to fruition, we’d likely look to target the 4hr supply area at 1.0986-1.0968(as per the blue arrows) first and foremost, since there is clear space seen in between here for prices to rally.
Levels to watch/live orders:
- Buys: Watch for 1.0900/1.0924 to be consumed and then look to enter on any retracement seen back towards 1.0900.
- Sells: Flat (Stop loss: N/A).
GBP/USD:
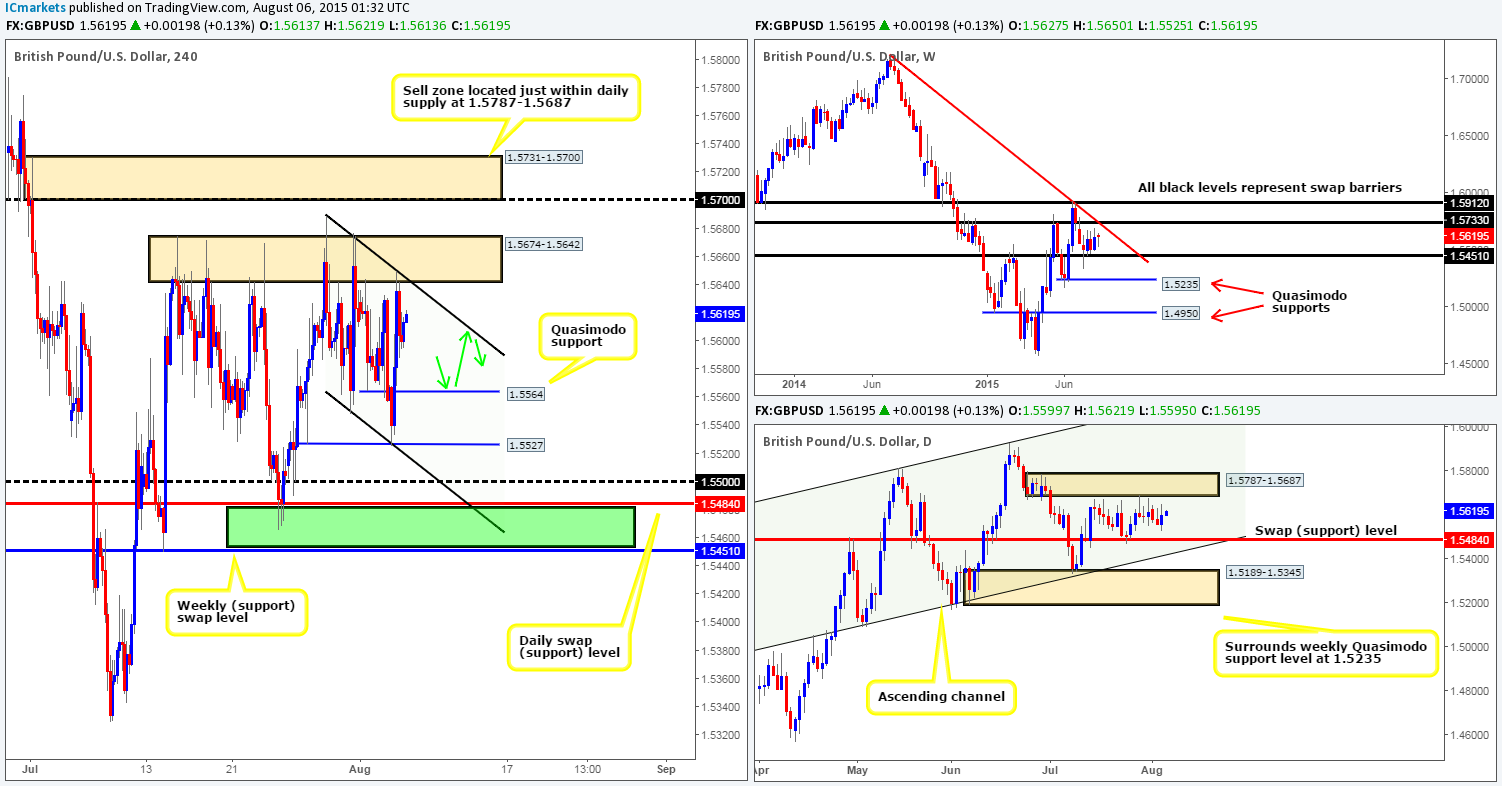
Recent action on the GBP shows price is currently trading within the confines of a very neatly defined bull flag taken from the high 1.5688 and low 1.5548. Trading within the limits of this flag is certainly a viable trade in our book. Nonetheless, there is a 4hr Quasimodo support level that jumped out to us and slapped us in the face this morning at 1.5564, which could cause a ripple within the flag (intraday buying opportunity here as long as lower timeframes confirm this level) as per the green arrows.
With that said, seeing as how it is quite a big news day for Pound Sterling today, one could see higher timeframe action come into play here, which has been relatively dormant over the past few weeks. Dependent on the numbers drawn from news of course, Cable could push lower to connect with the daily swap (support)/weekly swap (support) area at 1.5484/1.5451 (green area). This could be, if lower timeframe price action is agreeable, a very nice base in which to look for longs from. Conversely, price may drive north and connect with the 4hr supply area above at 1.5731-1.5700, which ties in nicely with daily supply at 1.5787-1.5687 – a zone we certainly have on our watchlist for potential shorts today.
Levels to watch/ live orders:
- Buys: 1.5564 [Tentative – confirmation required] (Stop loss: Dependent on where one confirms this level) 1.5484/1.5451 [Tentative – confirmation required] (Stop loss: 1.5444).
- Sells: 1.5731-1.5700 [Tentative – confirmation required] (Stop loss: 1.5735).
AUD/USD:
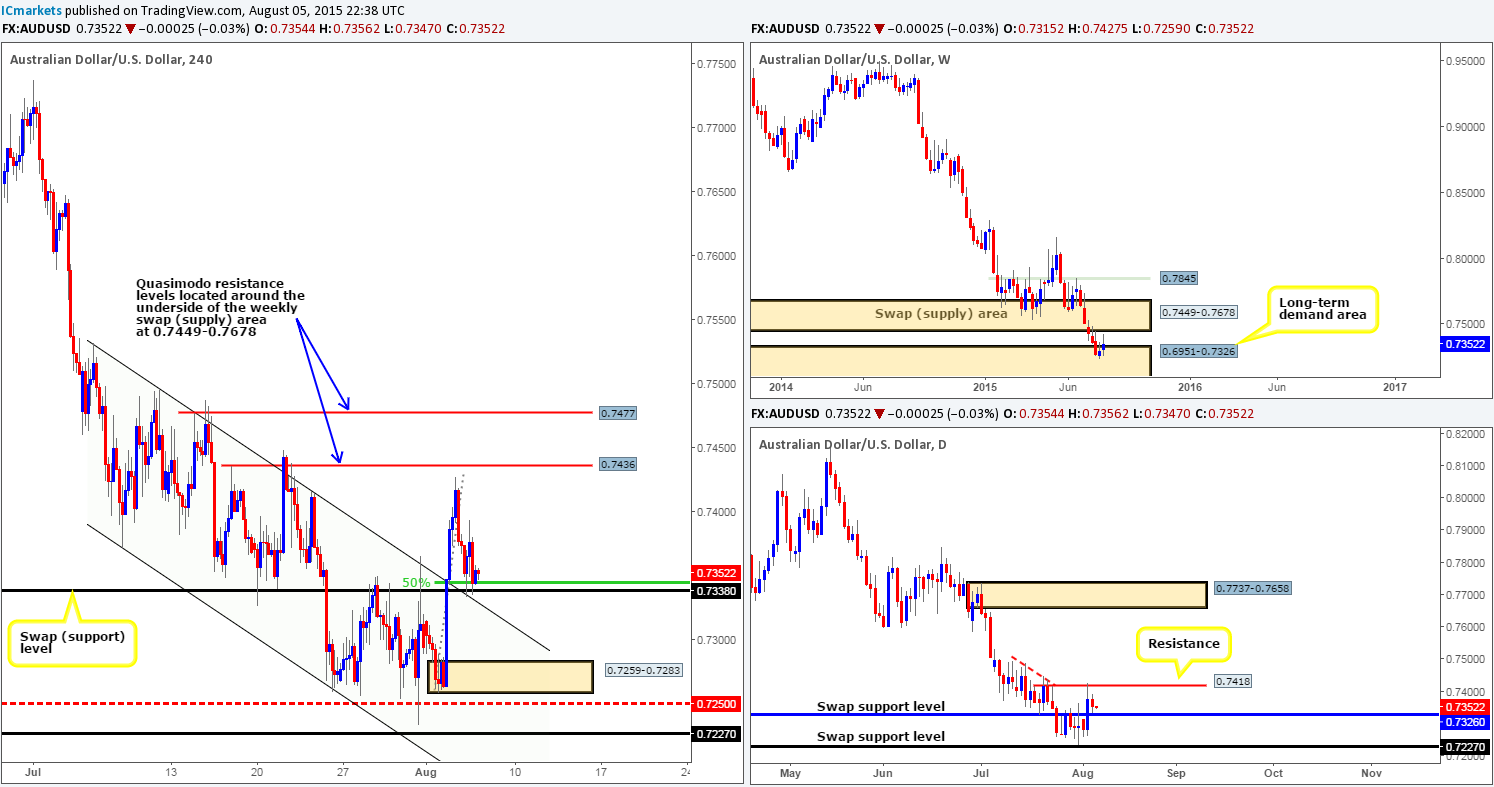
Since the AUD/USD fell from 0.7427, price has drawn support from a nice little pocket of confluence consisting of the following structures:
- 4hr swap (support) at 0.7338.
- 50.0% Fibonacci support at 0.7345.
- The upper limit of the 4hr descending channel taken from the high 0.7531 which is now acting support.
The question is though; would we consider this enough to buy into this market? We would, but only for a small intraday bounce up to around the 4hr Quasimodo resistance level at 0.7436, as we can see we have the backing of a daily swap (support) level at 0.7326. The reason for why we would only look to buy short term from here comes from the following:
- Clear downside risk to this pair due to price being entrenched in a humongous weekly downtrend.
- Price trading below resistance on the weekly timeframe in the form of a swap (supply) area at 0.7449-0.7678.
- Minor daily timeframe resistance seen at 0.7418.
In the event that the current 4hr swap (support) level at 0.7338 gives way today, however, this could suggest further downside towards 4hr demand coming in at 0.7259-0.7283, which, in itself, could be a tradable shorting opportunity should we get a confirmed retest following the break lower.
Levels to watch/ live orders:
- Buys: 0.7338 [Tentative – confirmation required] (Stop loss: Dependent on where one confirms this level).
- Sells: Watch for 0.7338 to be consumed and then look to enter on a confirmed retest seen from this number.
USD/JPY:
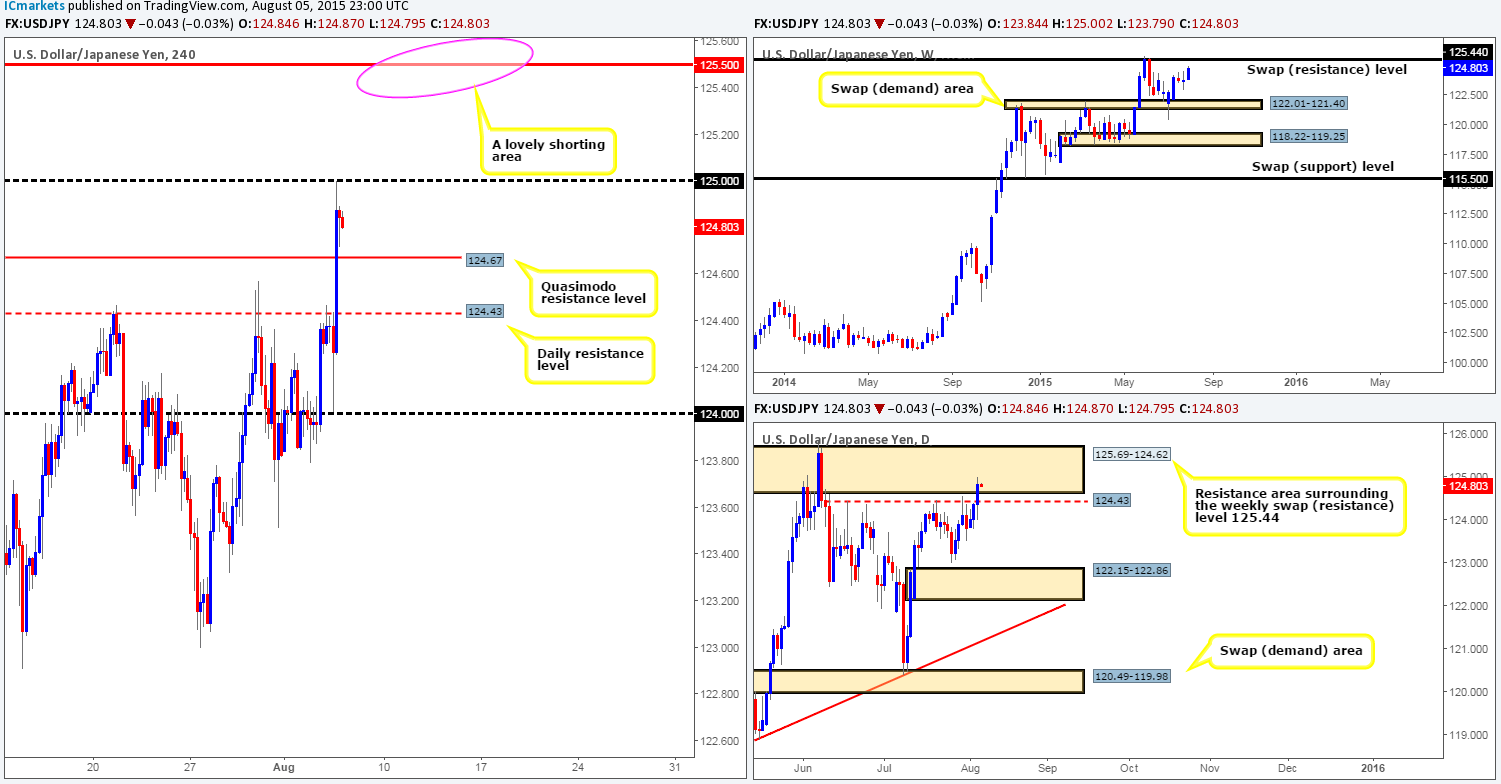
After price shook hands with the 124.00 handle yesterday, a strong wave of bids came into this market. The daily resistance level at 124.43 and the 4hr Quasimodo resistance barrier at 124.67 were completely obliterated during this onslaught. It was only once price connected with the 125.00 handle did we see things begin to stabilize.
Considering that price is now trading within a daily resistance area seen at 125.69-124.62, shorts may be an option today. However, let’s not forget that there is room currently being seen for a further push north on the weekly timeframe up to a weekly swap (resistance) level at 125.44, which is located deep within the above said daily resistance area. As such, one has two options here today, well three, if you include entering long which may not be the best path to take considering the market’s current location.
- The first option would be to take a short entry at current price with your stop above the aforementioned daily resistance area. This is a huge stop and not really something we’re interested in taking part in.
- The second involves waiting to see if price does indeed rally higher to connect with the weekly swap (resistance) level at 125.44 (let’s say 125.50 to round it off), where at which point, one could look to take a short position here with a small stop at extreme higher timeframe resistance. One can only imagine the risk/reward on this trade should it come to fruition.
It is, of course, totally trader dependent whether one believes lower timeframe confirmation is needed at the above shorting levels. We believe it is worthwhile waiting for confirmation here to avoid any fakeouts that may happen, as you’ll be kicking yourself if price dropped 200 pips and left you behind after being stopped out on a small breakout spike north.
Levels to watch/ live orders:
- Buys: Flat (Stop loss: N/A).
- Sells: 125.50 [Tentative – confirmation required] (Stop loss: dependent on where one confirms this level).
USD/CAD:
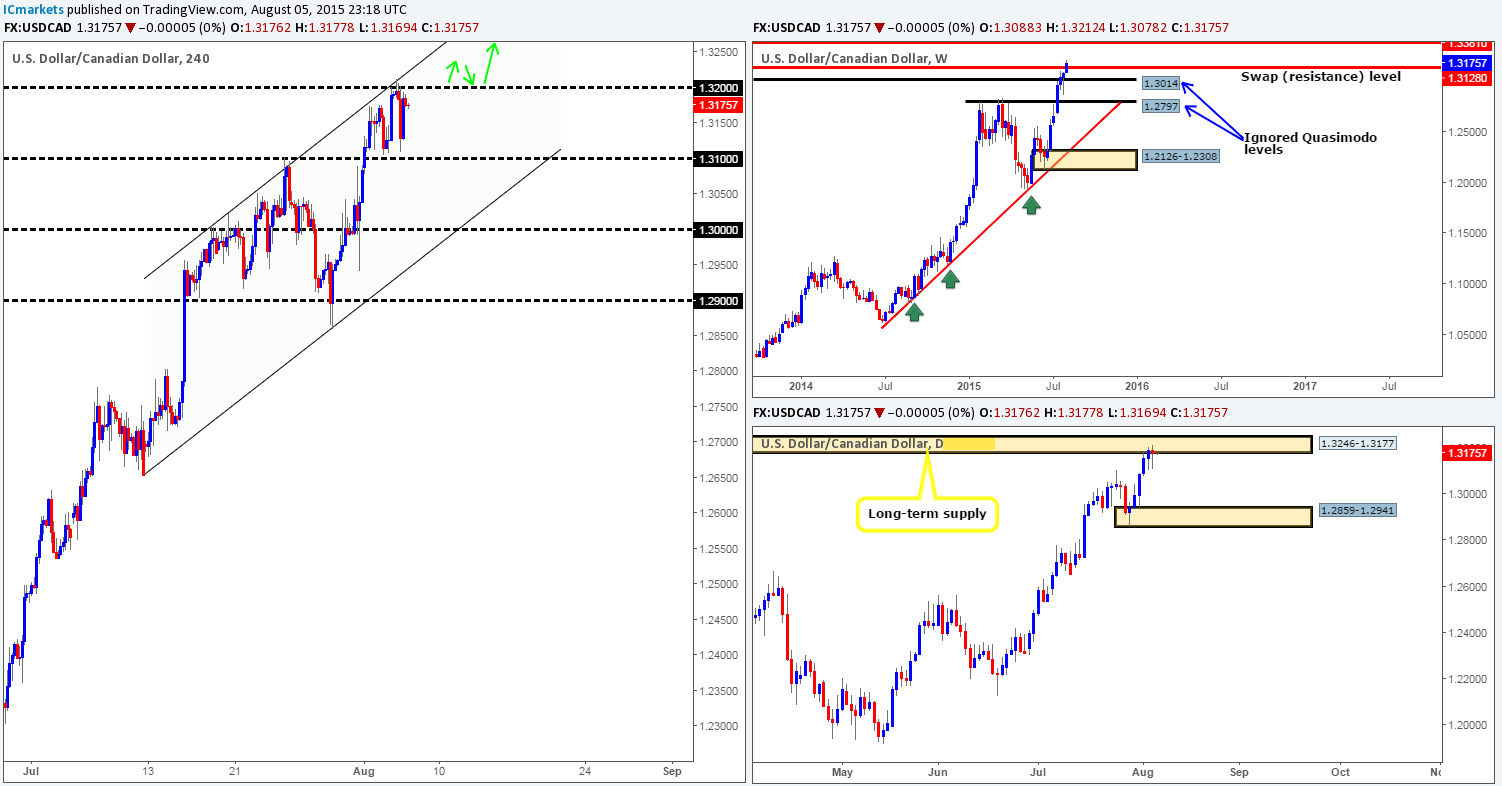
For those who read our previous report on this pair, you may recall us mentioning to keep an eye on 1.3200 for possible intraday shorts yesterday. As you can see, price did indeed sell-off from here. Unfortunately though, we could not find any lower timeframe confirmation to take advantage of this move – well done to anyone who did!
Now, considering that price is still trading above a major a weekly swap (resistance) level at 1.3128, and the fact that price is showing very little bearish intention around daily supply at 1.3246-1.3177 right now, our team would not be confident in looking to short this pair at 1.3200 again. In consequence, what we’re looking for today is a close above and retest of 1.3200. This would not only provide a potential buying opportunity into this market, but would also confirm bullish strength above the aforementioned weekly (swap) resistance level and also echo further weakness within the current daily supply zone.
Levels to watch/ live orders:
- Buys:Watch for 1.3200 to be consumed and then look to enter on a confirmed retest seen from this number.
- Sells: Flat(Stop loss: N/A).
USD/CHF:
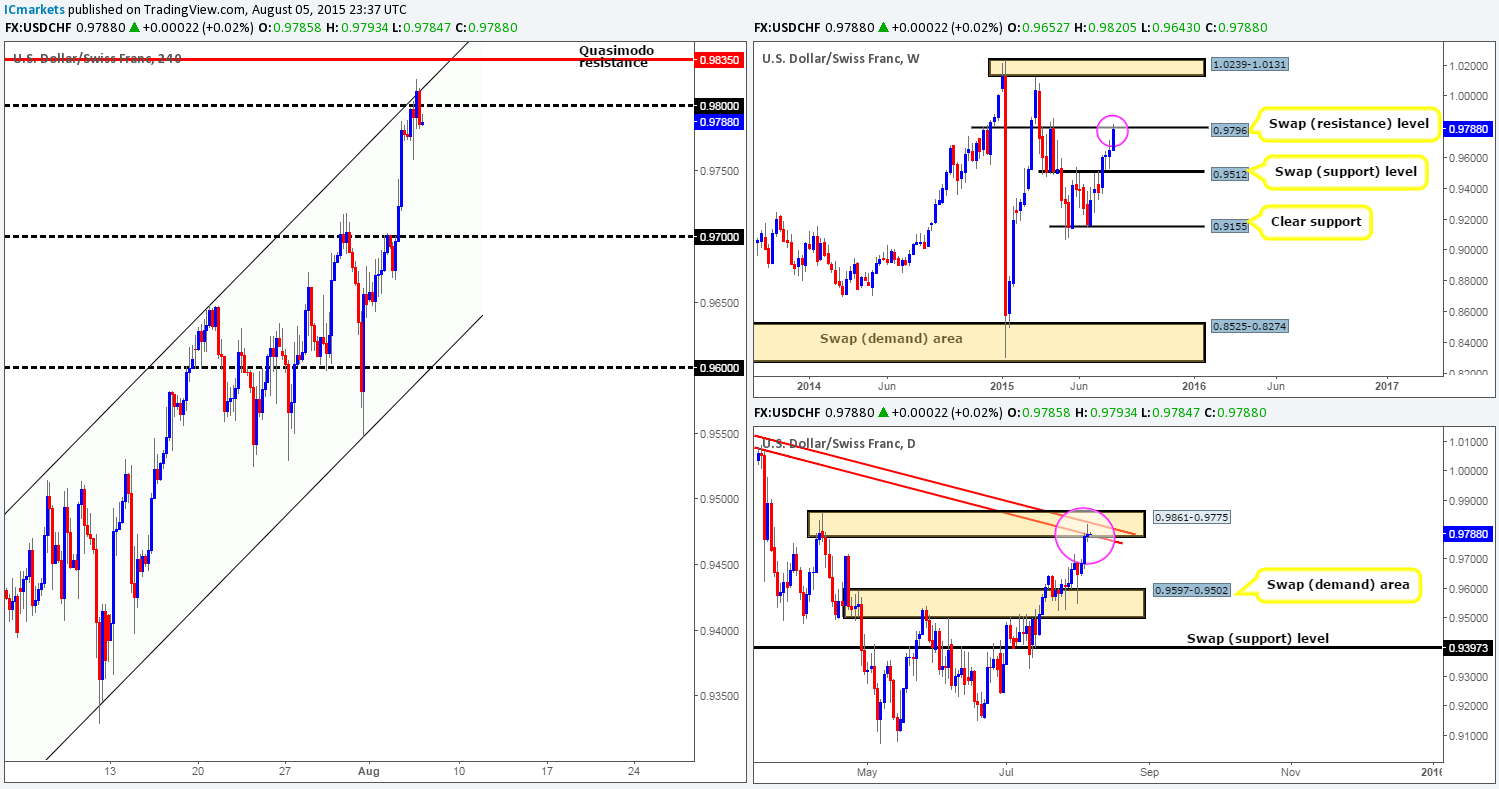
There really is only one word we have for the USD/CHF pair this morning, and that is, ‘overbought’. Check out how price is nibbling at the underside of both a weekly swap (resistance) level at 0.9796, and also a daily supply area at 0.9861-0.9775, which, as you can see, also boasts trendline confluence extended from the high 1.0239. It does not end there! 4hr timeframe action also shows price clinging to the upper limits of a 4hr ascending channel taken from the low 0.9155 and high 0.9414. All of this coupled with round-number resistance from 0.9800 may send this market lower today.
In spite of the above, however, we are not going to be looking to short just now as we have our beady little eye on the 4hr Quasimodo resistance level sitting just above current price at 0.9835. The reason for why we’re not looking to short at this time simply comes from there still being room for this market to appreciate further within the aforementioned daily supply zone. Therefore, if price does manage to touch gloves with 0.9835 today, we’d confidently enter short at market with our stop above the daily supply area at 0.9865 – a small stop loss really, when you consider the location of price on the higher timeframe picture.
Levels to watch/ live orders:
- Buys: Flat (Stop loss: N/A).
- Sells: 0.9835 (Stop loss: 0.9865).
DOW 30:
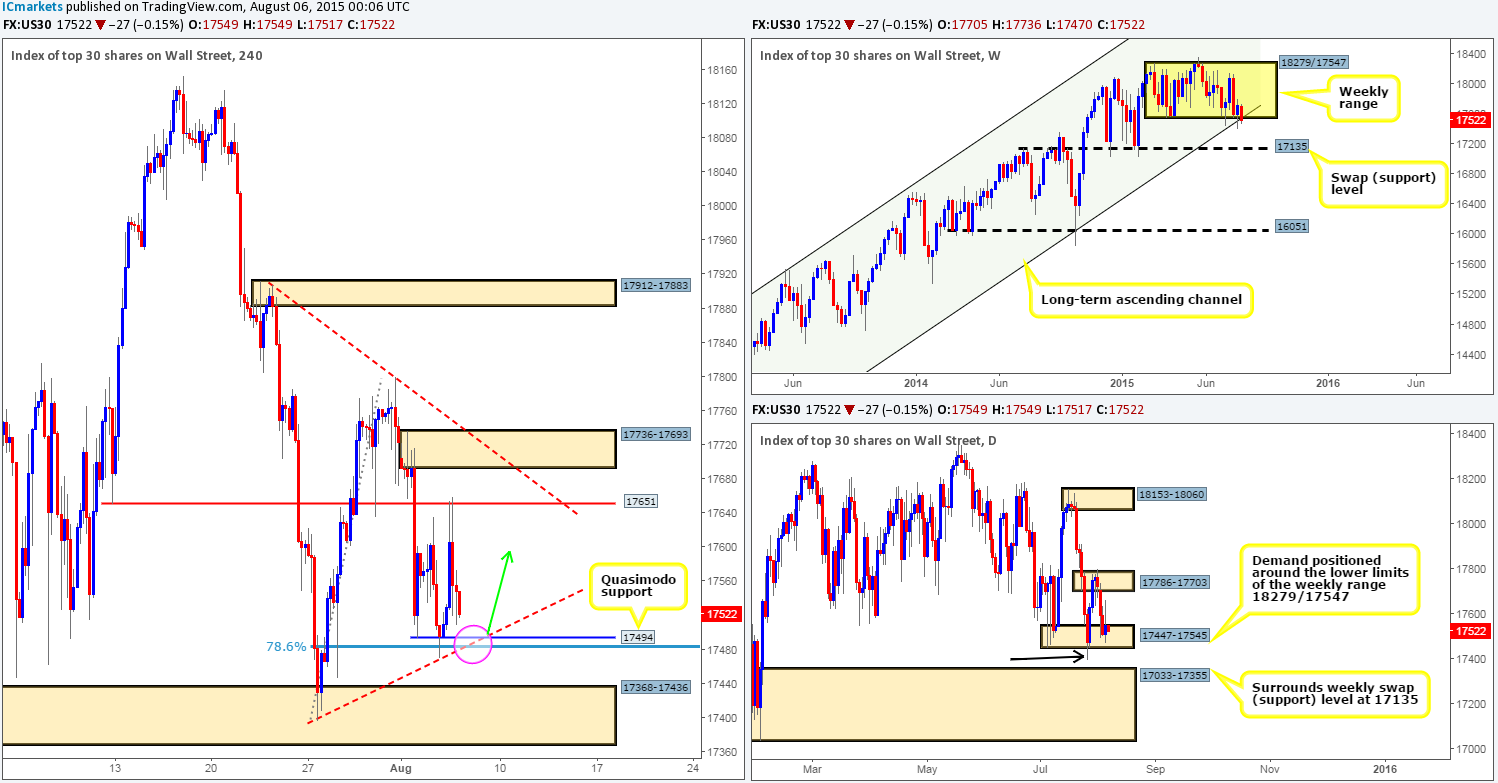
Going into the early hours of yesterday’s sessions, we can see that price aggressively rallied north, taking out Tuesday’s high 17635 and connecting with a 4hr swap (resistance) level coming in at 17651. 17651 was clearly of interest to traders during the London/U.S overlapping session as prices sold off from here, taking back most the day’s profits with it!
Consequent to the recent movements in price, there is a beautiful trade setup forming as we speak. Check out the 4hr Quasimodo support level coming in at 17494, which boasts not only 4hr trendline convergence from the low 17396, but also a deep Fibonacci support ratio of 78.6% at 17484. This tight range of numbers will likely see price bounce back up to the 17651 region.
Nevertheless, the higher timeframes are telling a completely different story. Weekly price action shows that the weekly range floor at 17547 appears to really be struggling at the moment. In the event that this weakness persists, we could see prices drop down to connect with a weekly swap (support) level at 17135. With regards to the daily timeframe, price is currently trading within daily demand at 17447-17545 – great for buys, huh? Not necessarily. Check out the tail marked with a black arrow at 17396, this move likely took out a huge amount of bids sitting at this area, thus weakening this barrier and potentially clearing the path south down towards daily demand at 17033-17355 (surrounds the aforementioned weekly swap [support] level).
Given that the higher timeframes are indicating further selling is possible, one would need to be very careful buying from the aforementioned 4hr Quasimodo support level today. We are still interested in trading this level, nonetheless, but ONLY if we see attractive lower timeframe buying confirmation to support a long from this barrier.
Levels to watch/ live orders:
- Buys: 17494 [Tentative – confirmation required] (Stop loss: Dependent on where one confirms this level).
- Sells:Flat (Stop loss: N/A).
XAU/USD: (Gold)
Consequent to yesterday’s lackluster performance, much of the following analysis will remain similar to the previous…
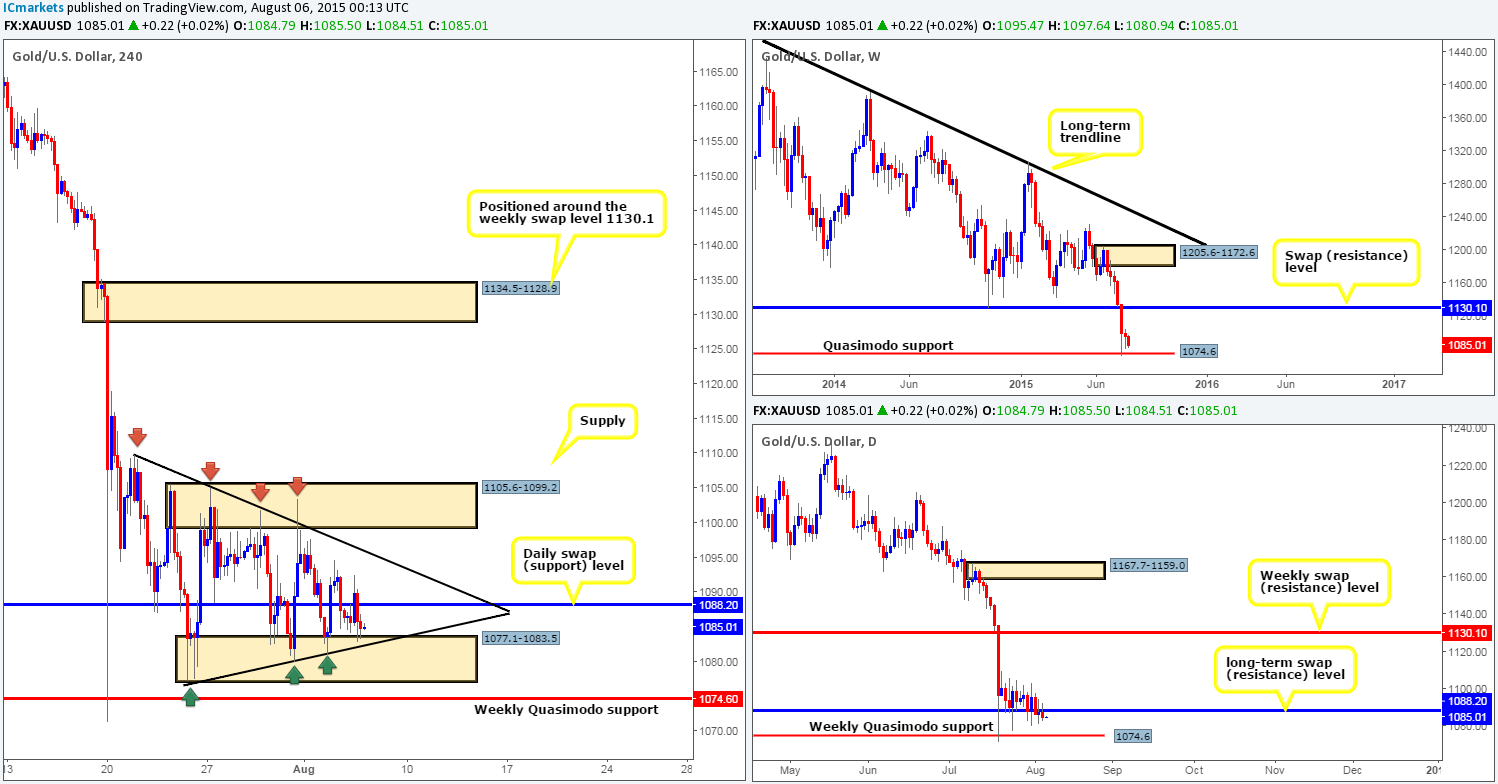
This morning’s analysis of this market will kick-off with a look at the weekly chart, which, as you can see, shows that price remains hovering above the weekly Quasimodo support level at 1074.6 with very little buying interest being seen at the moment. Meanwhile on the daily timeframe, price is seen trading just below a long-term swap (resistance) level at 1088.2, which, if holds, may encourage more sellers to join in and push prices back down to the aforementioned weekly Quasimodo support level.
Slipping down to the 4hr timeframe, it is clear that price is still compressing within a 4hr symmetrical triangle (high: 1109.8 low:1071.2), that boasts extra support from 4hr demand at 1077.1-1083.5 and 4hr supply at 1105.6-1099.2.
Given that the higher timeframe picture is not showing much in the way of direction at present (see above in bold), we are going to once again keep our objective simple today and only look to trade small intraday bounces off of the limits of the aforementioned 4hr symmetrical triangle that has held so well over the past two weeks. Fakeouts above/below these two colliding barriers are likely. Therefore, lower timeframe confirming price action will be needed before we’d consider entering into a position.
Levels to watch/ live orders:
- Buys: Watch for buying opportunities at the ascending trendline taken from the low 1071.2 (confirmation required).
- Sells: Watch for selling opportunities at the descending trendline taken from the high 1109.8 (confirmation required).


