.A note on lower timeframe confirming price action…
Waiting for lower timeframe confirmation is our main tool to confirm strength within higher timeframe zones, and has really been the key to our trading success. It takes a little time to understand the subtle nuances, however, as each trade is never the same, but once you master the rhythm so to speak, you will be saved from countless unnecessary losing trades. The following is a list of what we look for:
- A break/retest of supply or demand dependent on which way you’re trading.
- A trendline break/retest.
- Buying/selling tails/wicks – essentially we look for a cluster of very obvious spikes off of lower timeframe support and resistance levels within the higher timeframe zone.
- Candlestick patterns. We tend to only stick with pin bars and engulfing bars as these have proven to be the most effective.
We search for lower timeframe confirmation between the M15 the H1 timeframes, since most of our higher-timeframe areas begin with the H4. Stops are usually placed 5-10 pips beyond confirming structures.
EUR/USD:
Weekly gain/loss: + 53 pips
Weekly closing price: 1.1135
Weekly opening price: 1.1124
Weekly view: From the weekly timeframe, we can see that price is now effectively trading mid-range between a long-term weekly resistance area coming in at 1.1533-1.1278, and a long-term weekly support line seen at 1.0796. Both areas have stood the test of time, and as such either one could play a significant role in where this market moves this week.
Daily view: Following a relatively healthy bounce from the daily Gartley reversal zone (1.0910/1.0994) last week, the single currency took out daily supply at 1.1057-1.1108 (now acting demand) on Wednesday, and has been hovering above this area since. The next upside target from here falls in at 1.1203 – a daily resistance line coupled with a H4 38.2% Fib resistance at 1.1178.
H4 view: A quick recap of Friday’s sessions on the H4 chart shows price bounced nicely from the 1.11 handle going into London trade. This, as you can see, forced candle action to touch base with the H4 resistance zone at 1.1170-1.1150 (H4 mid-way resistance at 1.1150/H4 resistance at 1.1162/ H4 50.0% Fib resistance at 1.1170), which is where we saw the market pullback as US trading got under way.
With only a ten-pip change seen at this morning’s open, where do we see this market moving today/this week?
- Weekly candles can move either way.
- Daily action on the other hand shows that price will probably rally to touch gloves with daily resistance at 1.1203.
- From the H4 chart, the structure below appears cramped so we are going to try and steer away from shorts this week if we can. To the upside, we see space beyond H4 resistance at 1.1233 up to H4 supply at 1.1303-1.1287, and also above this zone up towards the H4 Quasimodo resistance at 1.1410 (green circles).
Our suggestions: From where we’re standing, there is no immediate trading opportunity seen on this pair. We will, nevertheless, be keeping a close eye on the H4 resistance line at 1.1233 since a break above this level is a cue to begin hunting for longs, as is a break above the H4 supply at 1.1303-1.1287.
To enter above either of these barriers, our team would need to see price retest the broken lines as support, followed by a lower timeframe buy signal. This could be in the form of a break of supply followed by a subsequent retest, a trendline break/retest or simply a collection of well-defined buying tails around the higher timeframe level.
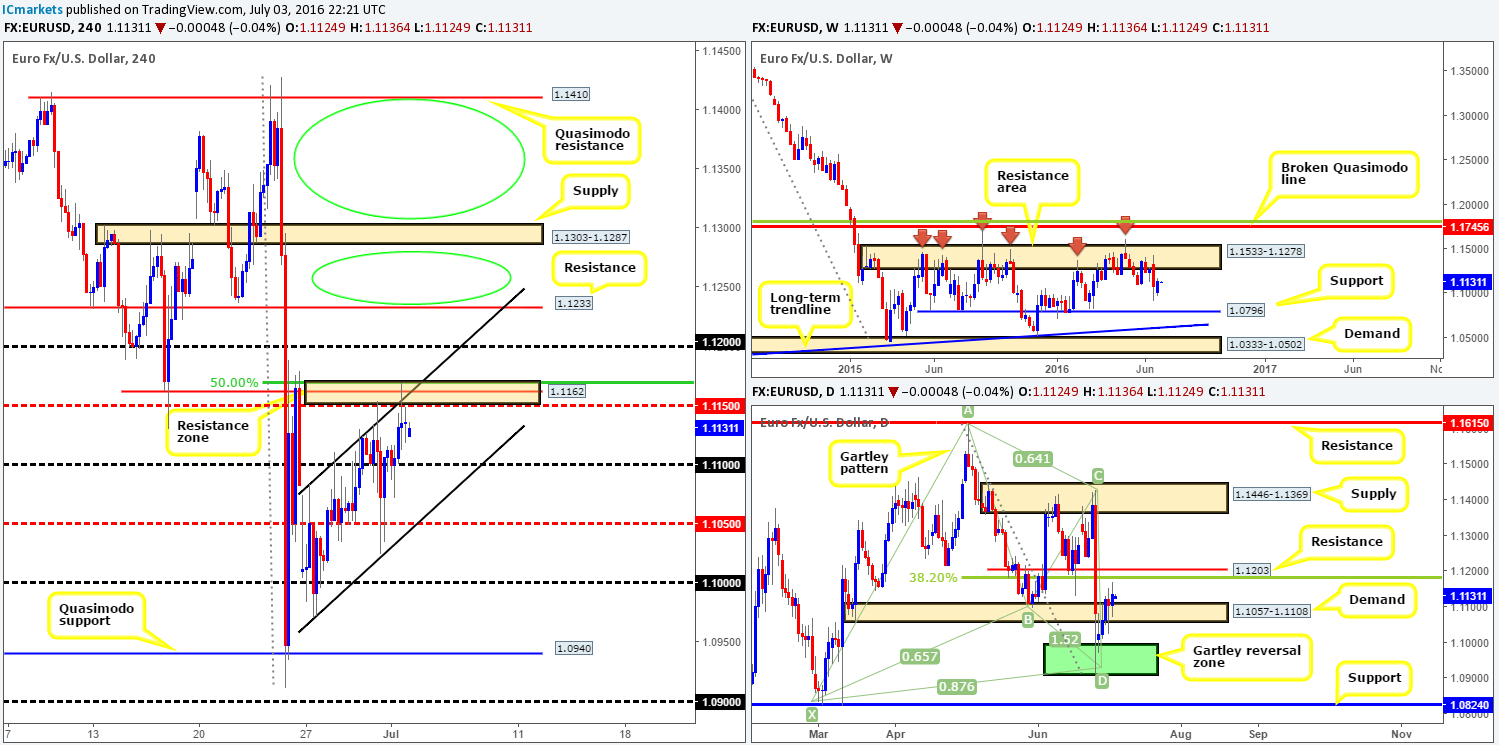
Levels to watch/live orders:
- Buys: Watch for price to consume H4 resistance at 1.1233 and look to trade any retest seen thereafter (lower timeframe confirmation required). Watch for price to consume H4 supply at 1.1303-1.1287 and look to trade any retest seen thereafter (lower timeframe confirmation required).
- Sells: Flat (Stop loss: N/A).
GBP/USD:
Weekly gain/loss: – 414 pips
Weekly closing price: 1.3245
Weekly opening price: 1.3241
Weekly view: Pound sterling suffered further losses for a second straight week, shredding more than 400 pips! As can be seen from the weekly chart, price retested the underside of the weekly resistance area at 1.3501-1.3804 and closed heavily into a weekly AB=CD completion point at 1.3353 (taken from the high 1.7191).
Daily view: The story on the daily chart shows that price remains supportive around referendum lows (1.3226). Overhead, we see daily resistance registered at 1.3617, which is lodged within the aforementioned weekly resistance area. Apart from these two lines, there is little else that stands out to us at this time.
H4 view: From this viewpoint, cable spent last week forming a consolidation between 1.3484/1.3200, and has, as you can see, remained within this range going into this morning’s open. Fundamentally, this pair may still be heading lower as political uncertainty in the UK remains high.
Technically, however, there is, according to our analysis above, support seen in this market so one could look for long off of the current H4 range lows this week. In ranging environments such as this, price has a tendency to be erratic around range extremes, so waiting for lower timeframe confirmation to avoid being whipsawed out of a position is something we’d highly recommend. In regard to targets, we’d ultimately be looking at the upper edge of this H4 range: 1.3484.
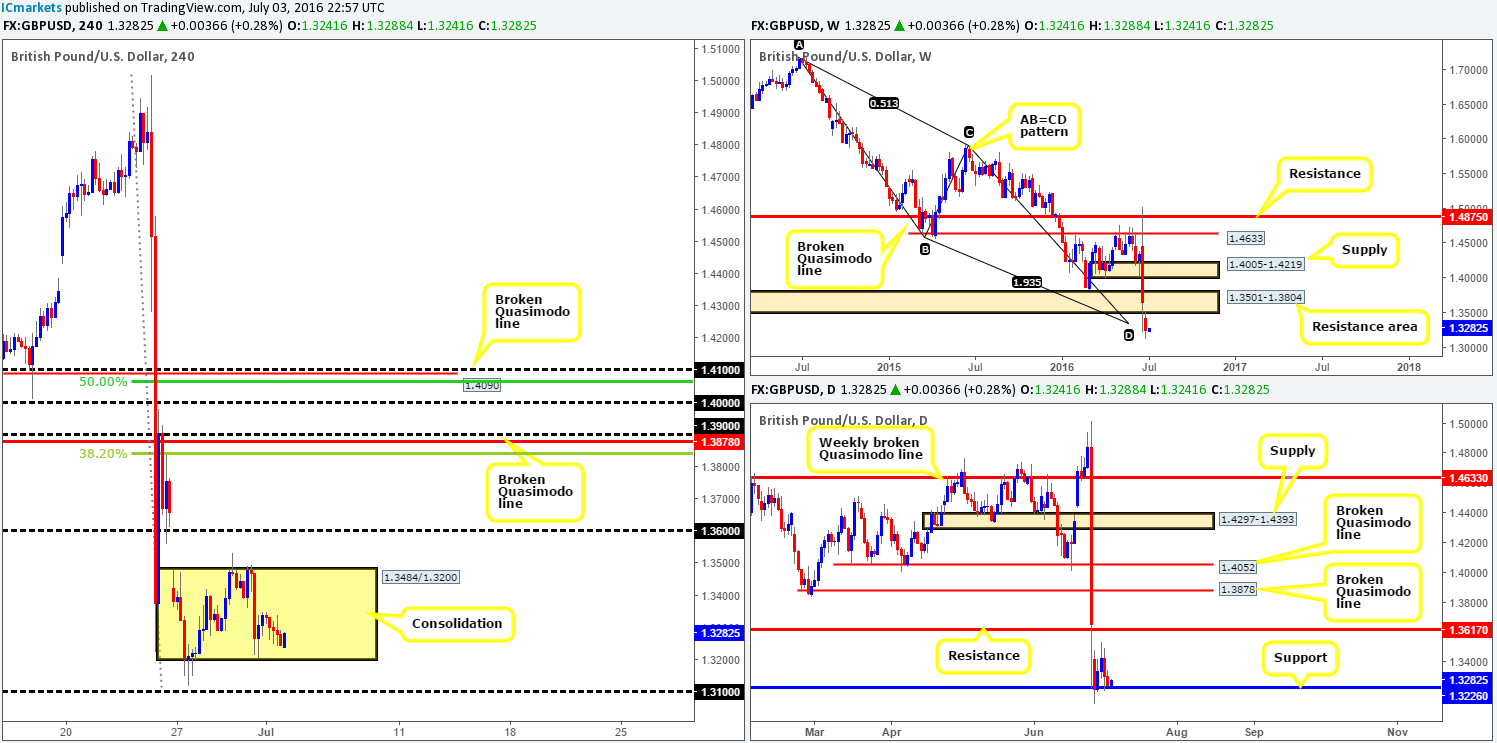
Levels to watch/live orders:
- Buys: 1.3200 region [Tentative – confirmation required] (Stop loss: dependent on where one confirms this area).
- Sells: Flat (Stop loss: N/A).
AUD/USD:
Weekly gain/loss: +27 pips
Weekly closing price: 0.7496
Weekly opening price: 0.7447
Weekly view: The previous week’s action saw buyers defend weekly demand at 0.7438-0.7315, and push to highs of 0.7502. In the event that the bulls remain in the driving seat this week, there’s little weekly resistance to stop price from reaching 0.7604 – a well-established weekly resistance level.
Daily view: Despite the weekly chart showing strength, down here on the daily chart the commodity currency is currently flirting with a daily supply base seen at 0.7517-0.7451. As far as we can see, this barrier is all that’s standing in the way of a move up to the aforementioned weekly resistance line coming in at 0.7604.
H4 view: A brief look at recent dealings on the H4 chart reveals that the H4 mid-way resistance 0.7450 was taken out in the early hours of Friday morning, allowing price to connect with H4 supply at 0.7514-0.7486 by the week’s close.
Going into a new week, the Aussie opened under pressure, gapping around fifty pips lower to the H4 mid-way support 0.7450. So far though the bulls have done a good job in defending this line and will likely continue to do so until the weekend gap has been filled.
With weekly action suggesting further buying may be seen this week, our team feels the current daily supply at 0.7517-0.7451 along with its partner H4 supply at 0.7514-0.7486 will eventually be consumed.
Our suggestions: If the above (in bold) does indeed come into view, buying this market up to the 0.76 handle is possible. For us to be given the green light to trade this move, nevertheless, a retest followed by a lower timeframe buy signal would need to be seen (check out the top of this report for a list of entry techniques that we use).
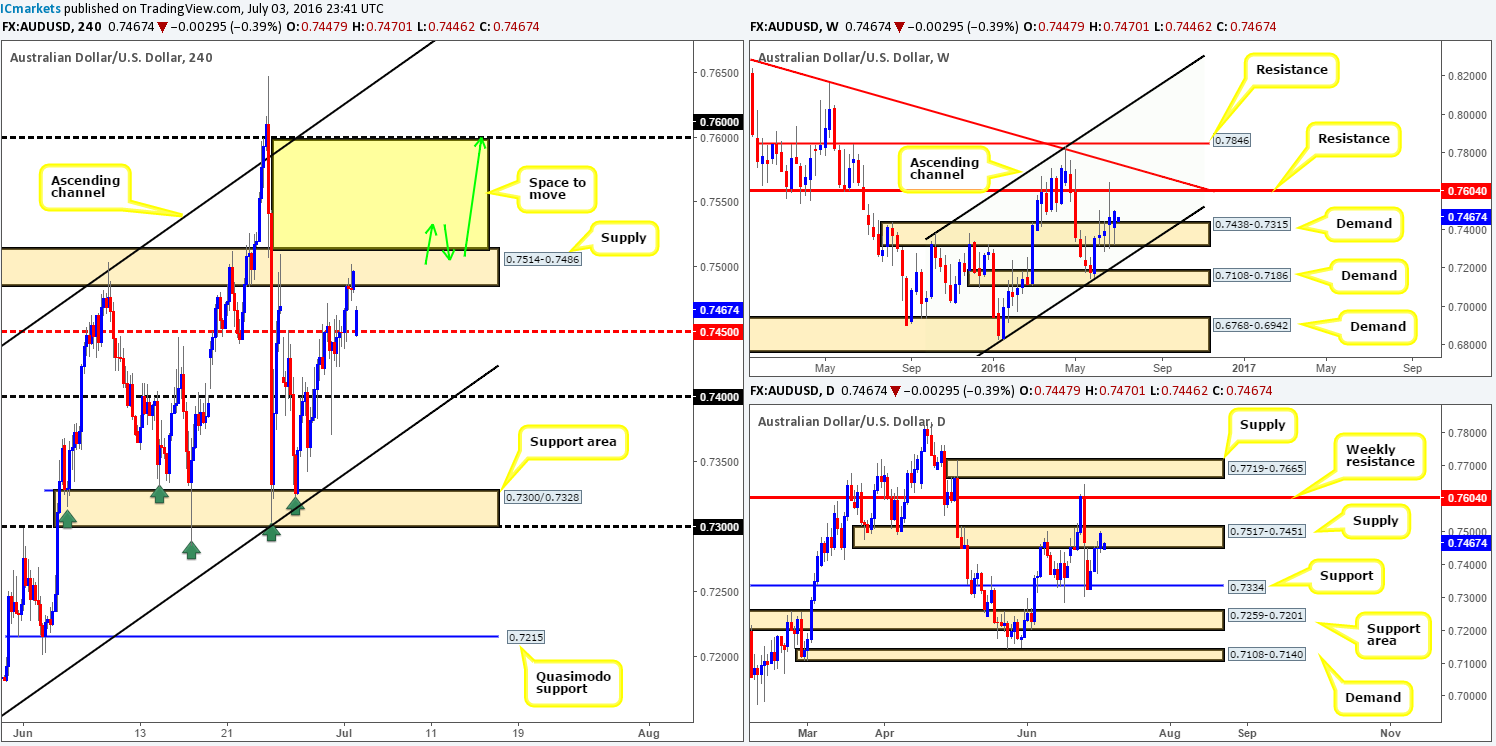
Levels to watch/live orders:
- Buys: Watch for price to consume H4 supply at 0.7514-0.7486 and look to trade any retest seen thereafter (lower timeframe confirmation required).
- Sells: Flat (Stop loss: N/A).
USD/JPY:
Weekly gain/loss: + 27 pips
Weekly closing price: 102.46
Weekly opening price: 102.59
Weekly view: From the weekly chart, price is now seen capped between weekly support at 101.32 and weekly resistance at 103.22. A break above would place the weekly supply at 105.19-107.54 in the limelight, whilst a push below puts the weekly demand at 96.564-98.595 in the firing range.
Daily view: Moving down to the daily timeframe, Friday’s session came within inches of striking the daily supply base at 103.50-103.89, before trading lower. This move, as can be seen from the chart, erased both Wednesday and Thursday’s gains.
H4 view: For those who read Friday’s report (see link below) you may recall that our team planned to short the close of the H4 candle marked with a black arrow, since price was trading within a H4 sell zone comprised of the 103 handle and a small H4 resistance area at 103.50-103.60 (green box). We closed this position a few hours before the week’s close at 102.47 as we did not want to hold over the weekend.
Given the relatively stable open we see this morning, this pair remains loitering above H4 demand seen at 102.17-102.41. Buying from here, however, is a risky play in our book. Not only is there clear selling interest being seen on the daily chart right now, there is also the fact that the weekly picture is lodged between two neighboring lines.
Our suggestions: Instead of looking to buy from the current H4 demand/psychological boundary 102, watch for price to break through these barriers. This would likely open up the gates for price to tag in the weekly support at 101.32, followed closely by the 101 handle. To be on the safe side here guys, we would not recommend simply selling the breakout. Waiting for a retest of the broken areas, followed by a lower timeframe sell signal is by far the more conservative route to take in our opinion (for a list of lower timeframe entry techniques that we use, please see the top of this report). This setup may not be seen today as Mondays tend to be slow, so do keep an eye out for this during the week!
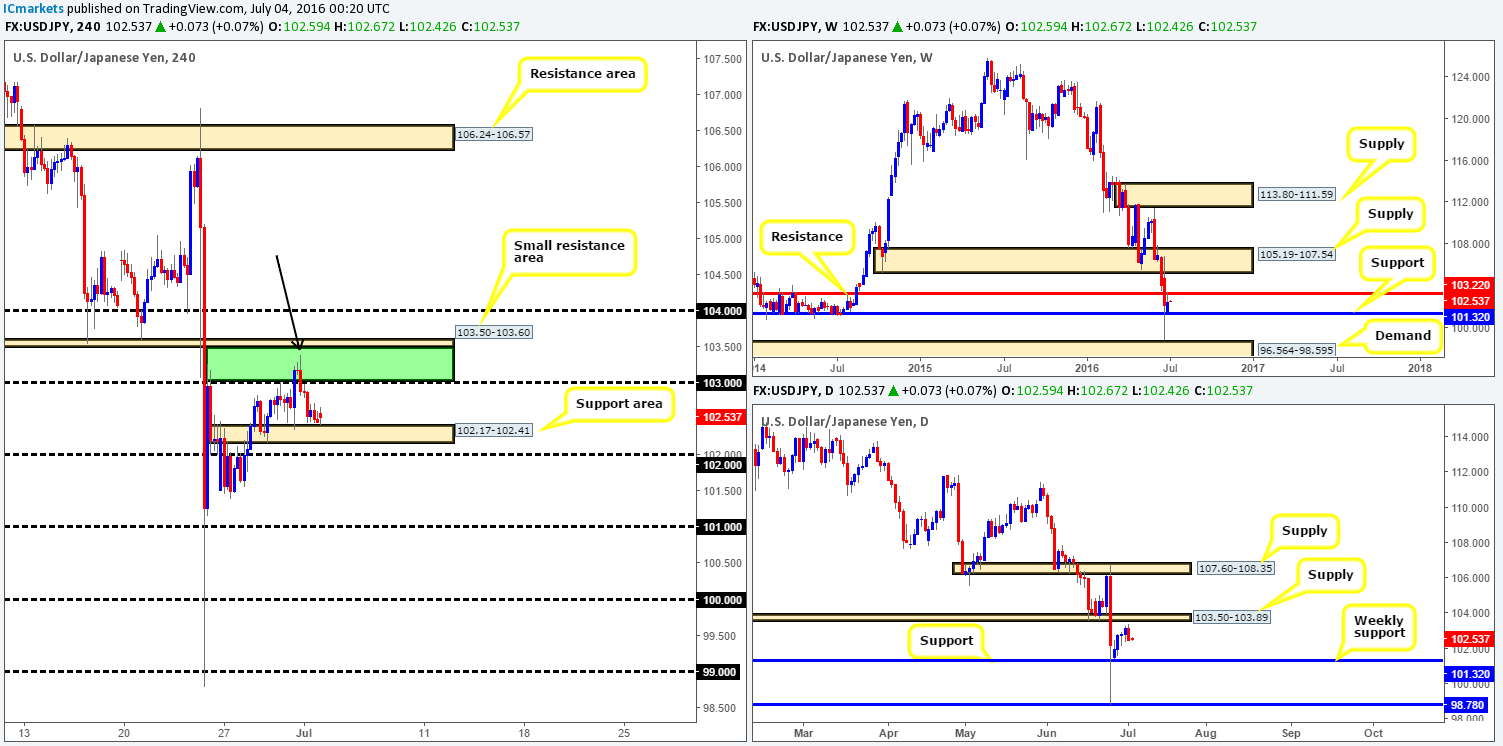
Levels to watch/live orders:
- Buys: Flat (Stop loss: N/A).
- Sells: Watch for price to consume H4 support area at 102.17-102.41/102 handle and look to trade any retest seen thereafter (lower timeframe confirmation required).
USD/CAD:
Weekly gain/loss: – 80 pips
Weekly closing price: 1.2907
Weekly opening price: 1.2914
Weekly view: Weekly supply at 1.3295-1.3017 played a relatively big role in last week’s trading. This supply, although only a relatively newly-formed area, has managed to cap upside in this market since the 16th May. Assuming that the bears remain in control, the next downside target can be seen at a weekly trendline support extended from the high 1.1278.
Daily view: Supporting further selling this week, daily support at 1.2970 was consumed on Wednesday, and subsequently retested as resistance on Thursday and Friday. Similar to the weekly chart, the next downside target from this angle can be seen at a daily trendline support taken from the low 1.2460.
H4 view: After a rather steep sell-off on Friday, H4 price closed and opened a few pips above the 1.29 handle. A few things to note here is that Friday’s action also whipsawed through 1.29 (red arrow), which likely removed a truckload of stops below this number and potentially cleared the path down to the H4 mid-way support 1.2850 (good history around this number). In addition to this, the green circle has been drawn on the chart to represent offers. In other words, this is a lot of wood to chop through if the buyers do intend on pushing higher.
Our suggestions: Selling this market will only be possible for us on a close below 1.29, which should come into view shortly going by what we’ve noted on the higher timeframes (see above). Should this come to fruition today, we’d also require price to retest 1.29 as resistance along with a lower timeframe sell signal to avoid being whipsawed. For those who agree with our approach, you may want to check out the top of this report for a list of the lower timeframe entry techniques that we use. In regards to targets, we’ll ultimately be looking to close 50% at the H4 mid-way support 1.2850, followed closely by the 1.28 handle. At this point price will be nearing the aforementioned daily trendline.
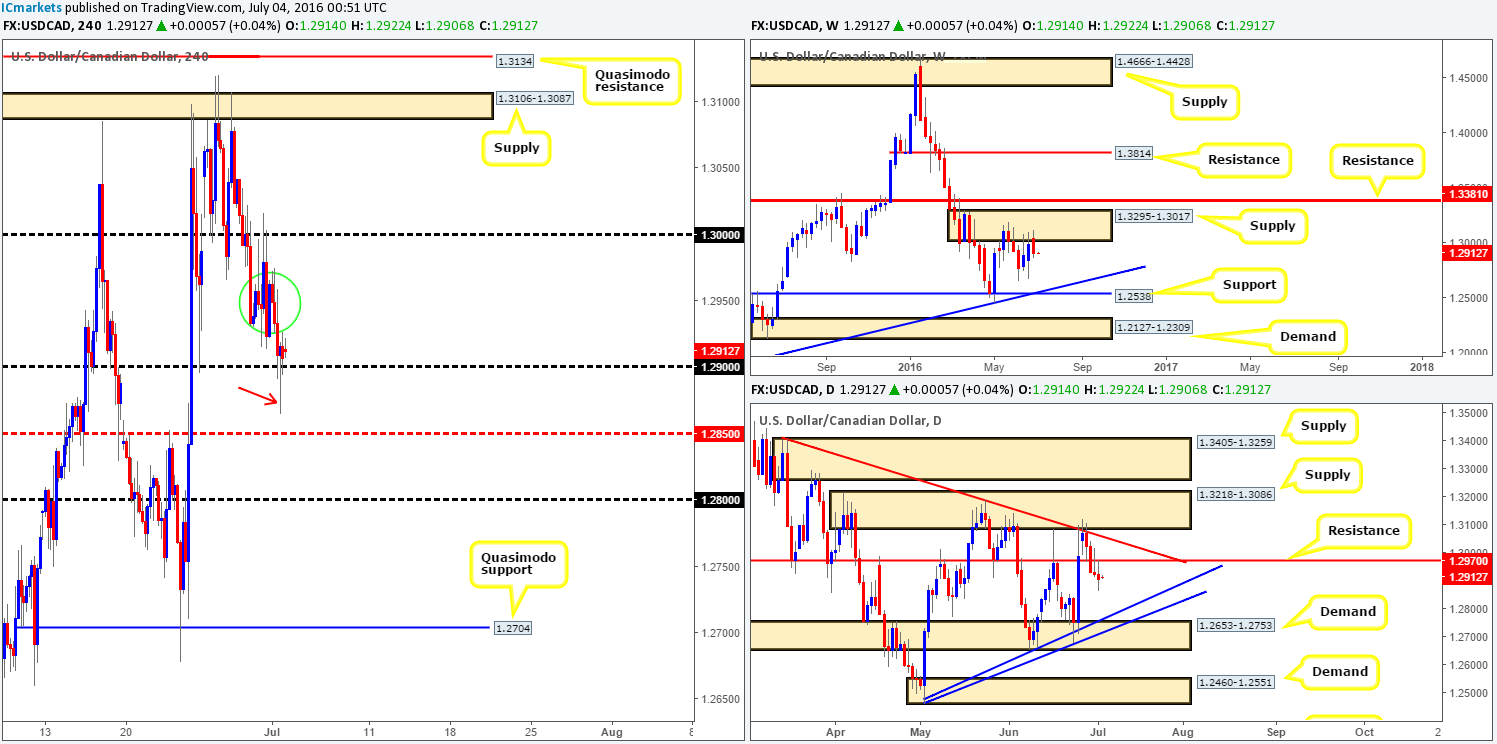
Levels to watch/live orders:
- Buys: Flat (Stop loss: N/A).
- Sells: Watch for price to consume the 1.29 handle and look to trade any retest seen thereafter (lower timeframe confirmation required).
USD/CHF:
Weekly gain/loss: + 21 pips
Weekly closing price: 0.9726
Weekly opening price: 0.9726
Weekly view: During the course of last week’s trading, a weekly selling wick formed amidst weekly supply drawn from 1.0092-0.9928 and weekly support seen at 0.9508 (coincides with a weekly trendline support taken from the low 0.8703). Both areas have proved reliable in the past so the two will firmly be on our radar this week.
Daily view: Although weekly action printed a nice-looking bearish selling wick last week, daily movement is currently hovering just ahead of a daily support base registered at 0.9663-0.9708. This zone has certainly stood the test of time, and history, in our opinion, has a good chance of repeating itself here.
H4 view: Seeing as how the H4 spent the majority of Friday’s sessions consolidating, and this morning’s open saw no change whatsoever, the spotlight is now focused on the green zone comprised of a H4 Fib support at 0.9679 and the 0.97 handle. Although this area is a relatively nice-looking swap zone in itself, the real plus here is the fact that it is bolstered by the aforementioned daily support area at 0.9663-0.9708.
Our suggestions: A buy trade from the green H4 buy zone mentioned above at 0.9679/0.9700 has a high probability of bouncing price today. We would, of course, prefer if it was supported by a weekly level as well as the current daily demand, but trading is rarely perfect! To stand-in for the lack of weekly support here, our team will wait for additional confirmation from the lower timeframes to form within the H4 buy zone (for lower timeframe buy entries, please see the top of this report). Concerning possible take-profit areas, our team has noted that the H4 resistance at 0.9758, followed by the underside of daily resistance area at 0.9819-0.9784 will be the initial targets.
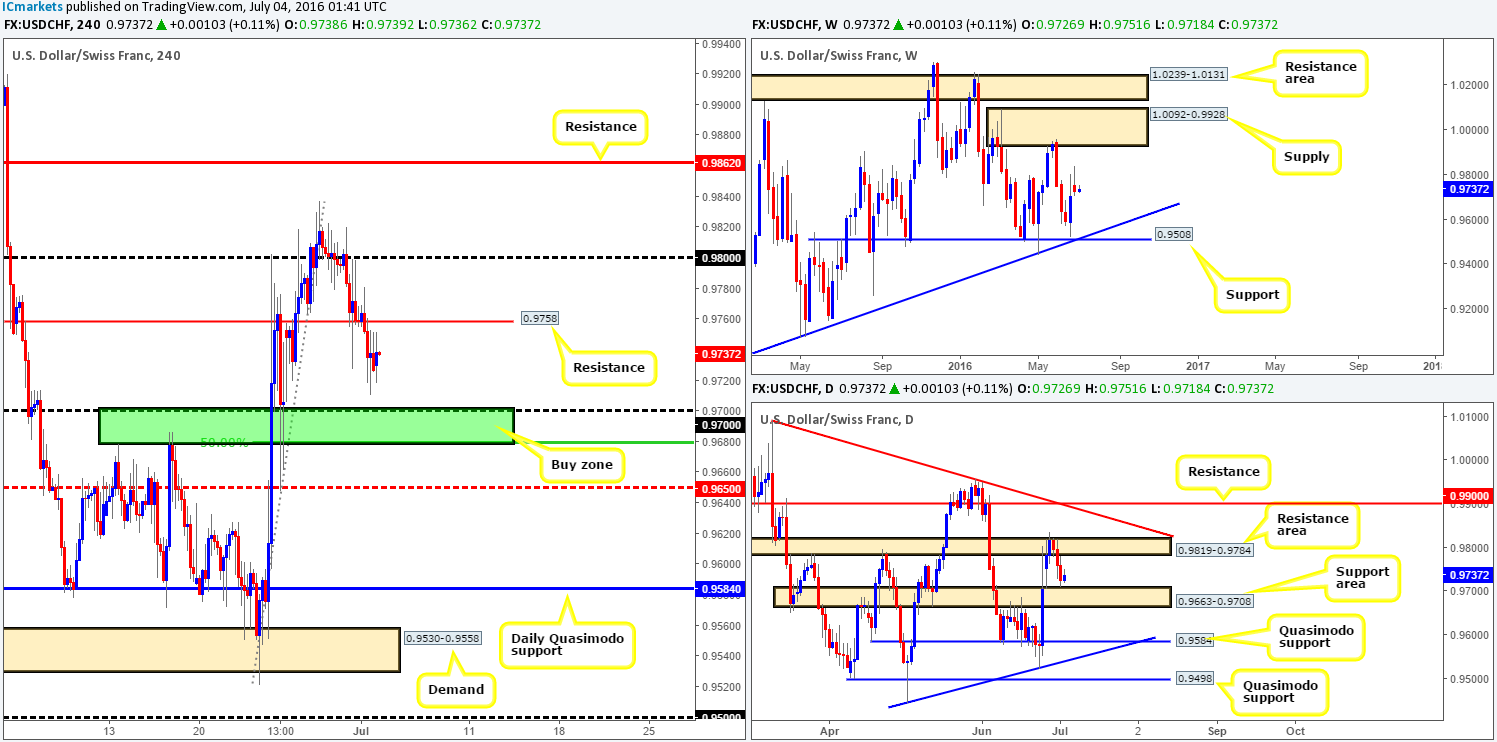
Levels to watch/live orders:
- Buys: 0.9679/0.9700 [Tentative – confirmation required] (Stop loss: dependent on where one confirms this area).
- Sells: Flat (Stop loss: N/A).
DOW 30:
Weekly gain/loss: + 633 points
Weekly closing price: 17966
Weekly opening price: 17963
Weekly view: The DOW posted an absolutely smashing week, gaining over 600 points into the week’s end and recovering almost 100% of Brexit losses! As we write, however, buyers and sellers are now battling for position ahead of a weekly resistance area coming in at 18365-18158. This zone has managed to cap upside since early March 2015, so the bulls will have their work cut out for them if they intend on pushing this unit higher this week!
Daily view: From this angle, bullish momentum could potentially ease off sooner than we think since there is a daily Quasimodo resistance level at 18018 seen within touching distance. This Quasimodo formation, as you can see, is supported by a daily resistance zone at 18186-18117 (glued to the underside of the aforementioned weekly resistance area).
H4 view: Analyzing Friday’s movement on the H4 shows that offers were removed from the H4 Quasimodo resistance line at 17946 going into the American session. This has not only now provided a base of support to this market, but it has also opened the window for price to climb up to the aforementioned daily Quasimodo level.
Our suggestions: In light of the above points, our team is seriously considering taking a short (at market) from the above said daily Quasimodo resistance line. To give the trade room to breathe, however, we would place stops above the daily resistance area at 18186-18117. Our first take-profit would, of course, be the H4 broken Quasimodo line at 17946, followed by H4 support at 17796. We have not ignored the small H4 demand at 17859-17902 marked by a black arrow; we just simply do not see this zone as significant since it broke very little structure to the left.
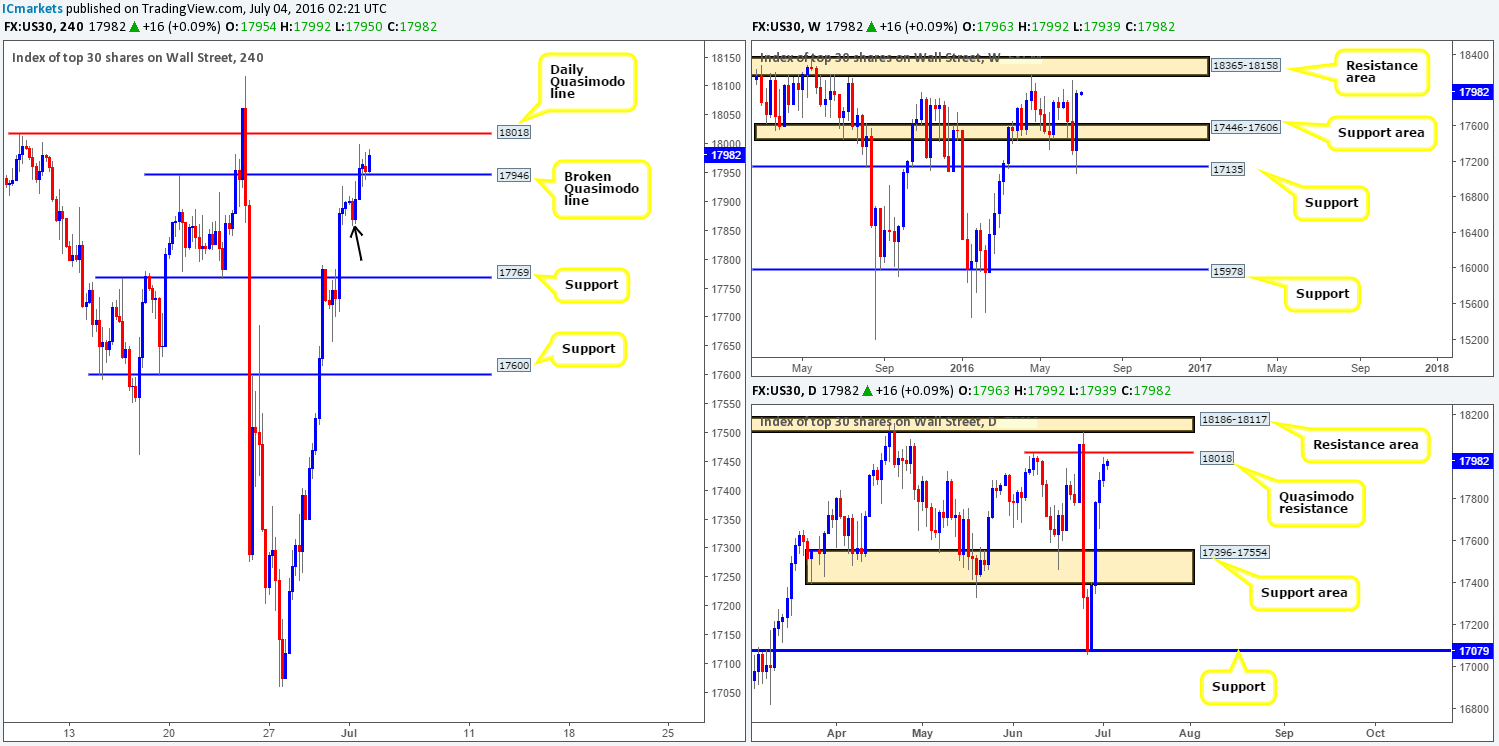
Levels to watch/live orders:
- Buys: Flat (Stop loss: N/A).
- Sells: 18018 [Dependent on the approach and time of day this line could be good for a market order] (Stop loss: 18208).
Gold:
Weekly gain/loss: + $26.6
Weekly closing price: 1340.9
Weekly opening price: 1340.9
Weekly view: Since the yellow metal struck the top-side of the weekly demand base at 1205.6-1181.2 five weeks ago, gold has been on fire! Two weeks back the weekly supply area at 1307.4-1280.0 was taken out (now acting demand), and the week just gone saw a weekly Quasimodo resistance line at 1331.0 also wiped out (now acting support). To our way of seeing things, this market seems all set to extend further up to the weekly Quasimodo resistance level coming in at 1361.7.
Daily view: As things stand on the daily chart, however, price is already crossing swords with a daily Quasimodo resistance hurdle given at 1354.6. This barrier held prices beautifully during the ‘Brexit’ rush for gold, and could very well do the same here!
H4 view: Following a rather heavy round of buying on Friday, which took out our stop order at 1341.1 (see link below for details), gold continues to be bid this morning consequently bringing price into the jaws of a H4 supply base at 1359.6-1354.4. In that this H4 supply area encapsulates the aforementioned daily Quasimodo resistance line, we feel this is a relatively stable platform in which to look for sell trades today. However, we must emphasize that, for us at least, lower timeframe confirmation will be required to trade this zone. Not only is there a good chance price could whipsaw above the current H4 supply to nearby H4 resistance at 1361.7, but let’s not forget that the weekly chart shows room for further buying.
Our suggestions: Watch for lower timeframe short entries around the current H4 supply zone (please see the top of this report for ideas on how to spot a lower timeframe entry), targeting H4 support penciled in at 1339.9, followed by the broken daily Quasimodo line at 1333.4.
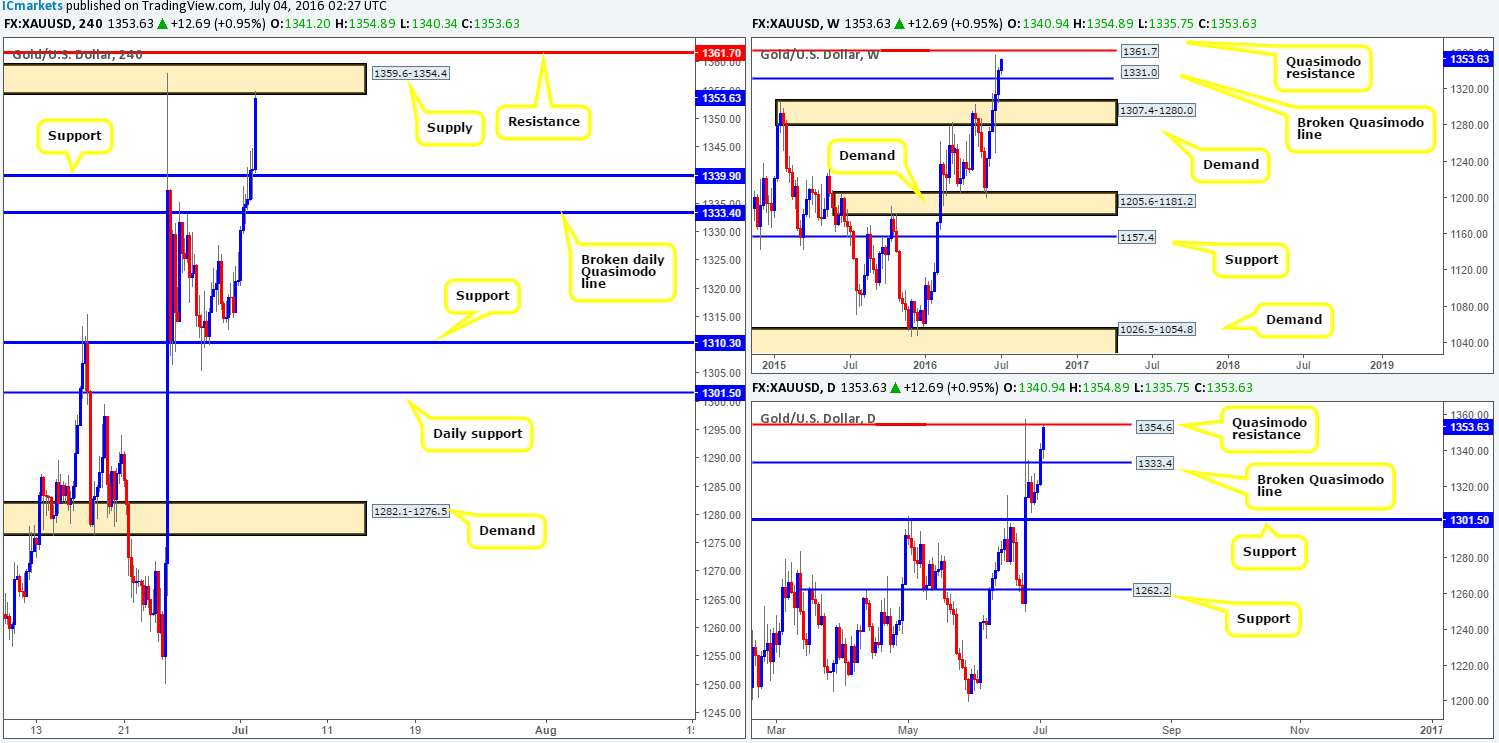
Levels to watch/live orders:
- Buys: Flat (Stop loss: N/A).
- Sells: 1359.6-1354.4 [Tentative – confirmation required] (Stop loss: dependent on where one confirms this area).