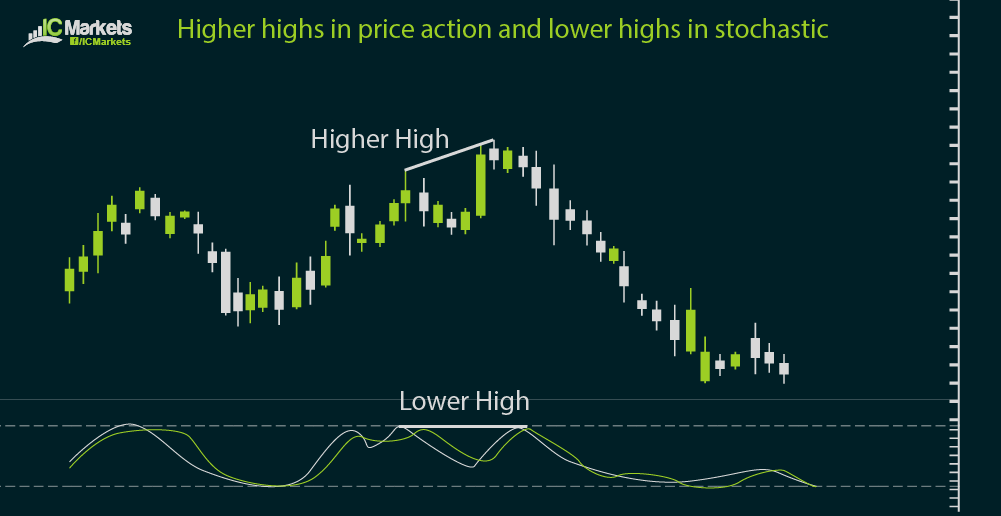
As you've learned in the previous sections, technical indicators and price action tend to move in tandem. For instance, when stochastic starts heading lower from the overbought zone, the corresponding currency pair usually sells off. On the other hand, stochastic climbing out of the oversold area indicates that the currency pair could rally. There are instances, however, when technical indicators and price action seem to be showing different results. Traders refer to these scenarios as divergences. Divergences take place when indicators make different highs or different lows. To be specific, higher highs in price and lower highs for the technical indicator constitute a trading divergence. So does lower highs in price and higher highs for the technical indicator. Meanwhile, lower lows in price and higher lows for the technical indicator or higher lows in price and lower lows in the indicator are also divergences.

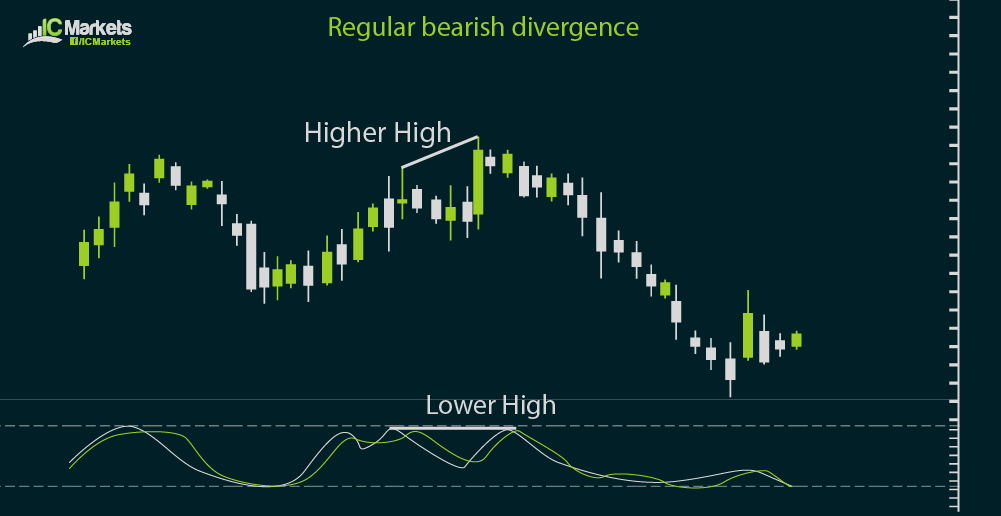
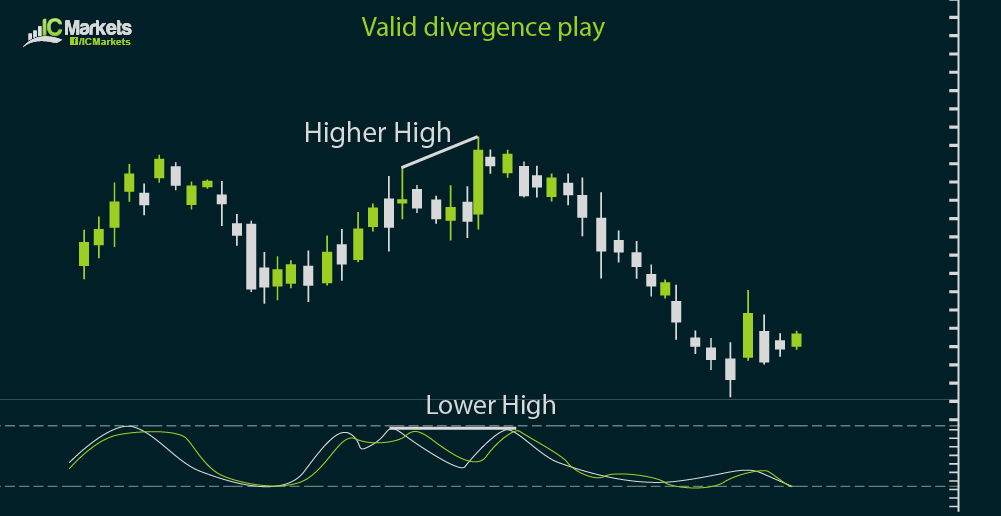
These may be a challenge to remember at first so it might be easier to group these trading divergences into two main categories: regular and hidden. A regular divergence suggests a reversal in price action. In an uptrend, price usually makes higher highs but once the technical indicator shows lower highs, it could mean that the trend is about to turn.
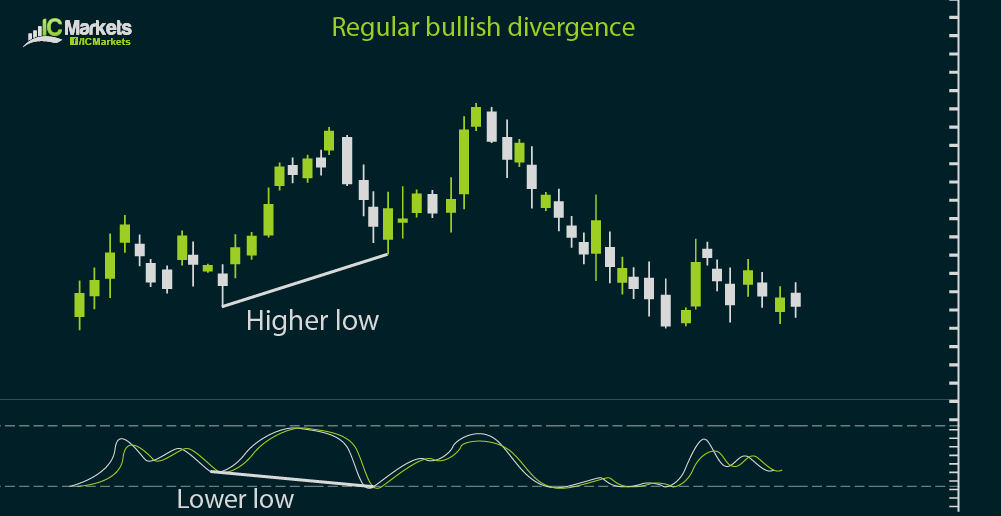
In a downtrend, price usually makes lower lows but once the technical indicator draws higher lows, it might be a sign that the trend is almost over.
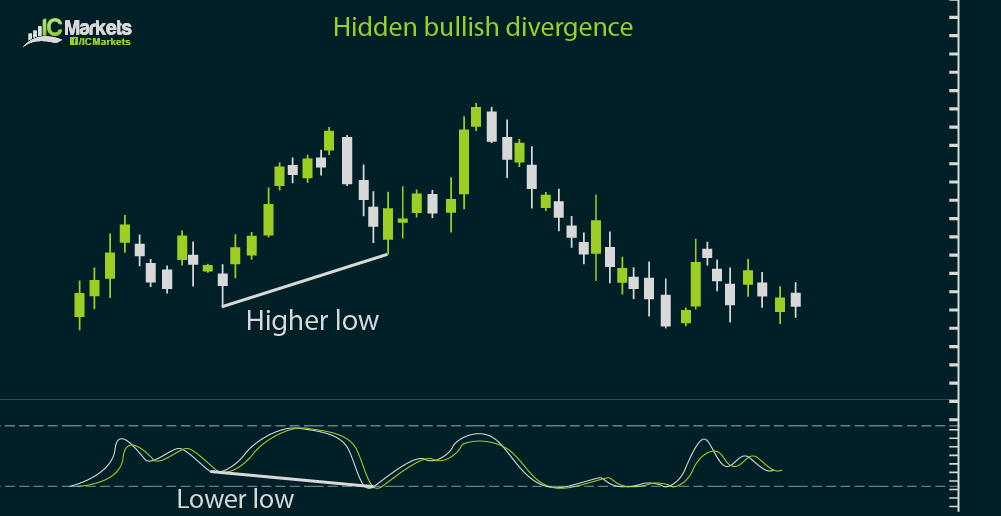
A hidden divergence indicates that the current trend is likely to resume. In an uptrend, price usually makes higher lows but when the technical indicator starts making lower lows in a pullback, it could be a sign that the correction is over and that the previous trend could resume
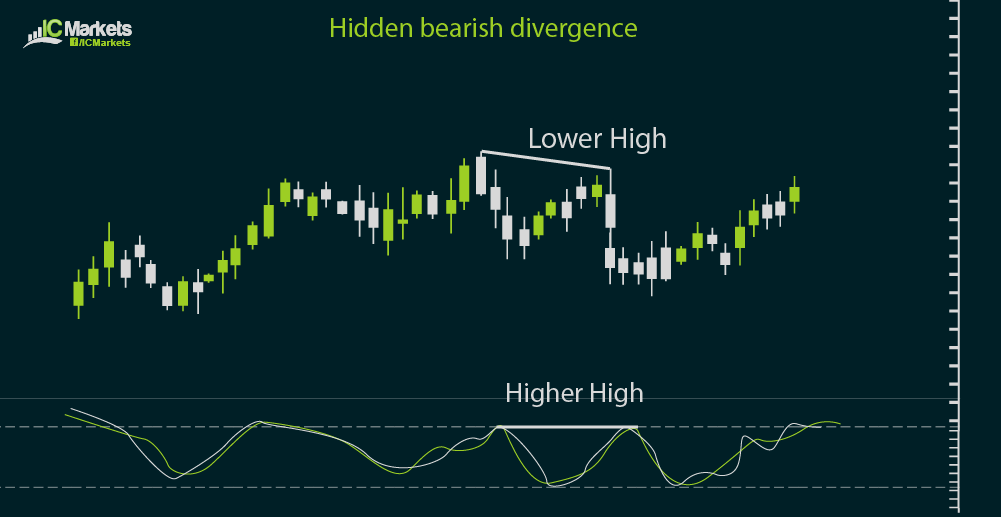
In a downtrend, price tends to make lower highs but once the technical indicator draws higher highs in a retracement, it could be a signal that the pullback is over and that the previous downtrend could carry on.
Divergences tend to work better in longer-term time frames than in shorter-term ones, as trends are more visible on those charts. Aside from that, there are also some requirements that must be fulfilled before trading a valid divergence. For one, successive highs and lows must be connected. You must also make sure that the highs or lows on the price are vertically aligned with the highs or lows in the technical indicator.
Of course there are some instances when divergence fails and you simply have to be prepared with a good risk management strategy in these cases. To lessen the odds of this happening to you though, you might want to consider a multiple time frame analysis, as discussed in the next section.


