A note on lower timeframe confirming price action…
Waiting for lower timeframe confirmation is our main tool to confirm strength within higher timeframe zones, and has really been the key to our trading success. It takes a little time to understand the subtle nuances, however, as each trade is never the same, but once you master the rhythm so to speak, you will be saved from countless unnecessary losing trades. The following is a list of what we look for:
- A break/retest of supply or demand dependent on which way you’re trading.
- A trendline break/retest.
- Buying/selling tails – essentially we look for a cluster of very obvious spikes off of lower timeframe support and resistance levels within the higher timeframe zone.
- Candlestick patterns. We tend to only stick with pin bars and engulfing bars as these have proven to be the most effective.
EUR/USD:
Trade update:
Entry: 1.06852 – Stop loss: Breakeven.
Take-profit areas: 50% locked in at 1.0700, 25% then taken off at 1.0773 and the final 25% was just recently closed at 1.0800.
Going into the early hours of yesterday’s sessions, the sell-side of this market drove prices back into the jaws of demand at 1.0664-1.0701. Following some hesitation (seen on the H1), the EUR corrected itself as we moved into the U.S. session. Price aggressively rallied higher, erasing earlier losses and hitting both psychological resistance 1.0800 and the broken Quasimodo line just above it at 1.0819.
Given the above information, where do we see this market heading today? Well, with weekly action showing bullish intent from the weekly range demand at 1.0519-1.0798, and daily movement now shaking hands with a broken Quasimodo level at 1.0818 (also sits just below a swap supply zone at 1.0846-1.0903), it is certainly not an easy market to trade today.
Selling from the current H4 broken Quasimodo line is not really something we’d label high probability right now. Reason being is the sellers have to contend with both psychological support 1.0800 and the swap support level at 1.0769! The best, and in our opinion, only logical place left to short on this pair is seen above at supply drawn from 1.0897-1.0880, which is located deep within the above said daily swap (supply) zone.
Although price is currently trading at a clear demand on the weekly timeframe (see above), there are no, at least as far as we see, logical areas to enter long from that offer enough risk/reward today. Each potential buy zone is clouded by near-term resistance – best to stay on the side lines when this is seen!
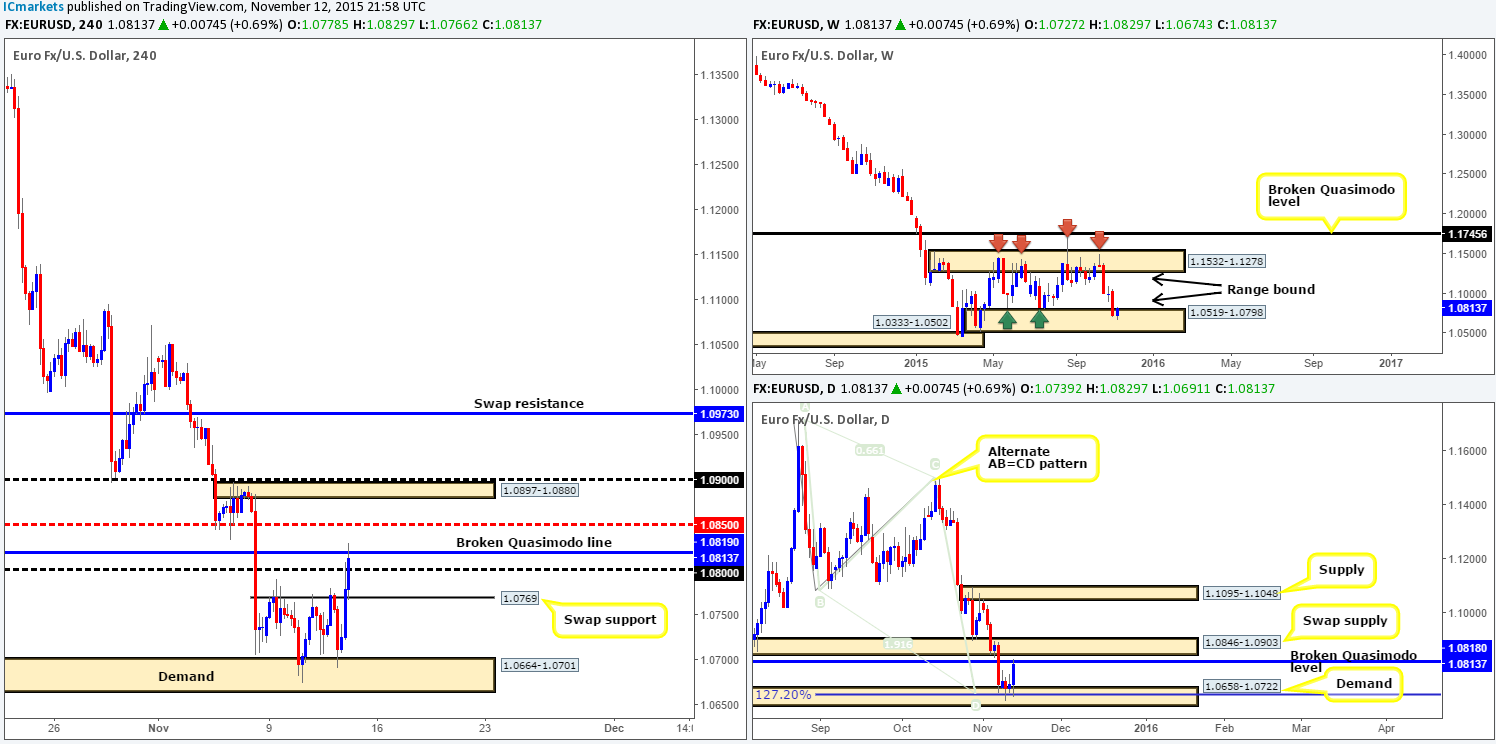
Levels to watch/live orders:
- Buys: Flat (Stop loss: N/A).
- Sells: 1.0897-1.0880 [Tentative – confirmation required] (Stop loss: dependent on where one confirms this area).
GBP/USD:
During the course of yesterday’s sessions, Cable, as reported it may do in our previous report (http://www.icmarkets.com/blog/thursday-12th-november-heavy-market-action-expected-today-as-both-draghi-and-yellen-take-center-stage/), rallied higher. However, price did fail to connect with the mid-level resistance 1.5250 before sellers stepped in and drove the unit to a session low of 1.5174. It was from this point – the U.S. open, we saw the buyers step in and erase earlier losses, reaching highs of 1.5241 on the day.
Given that this pair remains kissing the underside of the recently broken weekly channel support-turned resistance line (1.4564), and continues to hold within the jaws of a daily swap supply zone at 1.5199-1.5245, our outlook is still the same for now – bearish.
Similar to our previous analysis, we still have our eye on 1.5250 for possible (confirmed) shorts. The reason for why is that it sits just above the aforementioned daily swap (supply) zone, (which is ideal for a fakeout to collect stops), and is positioned very close to the weekly channel resistance (see above).
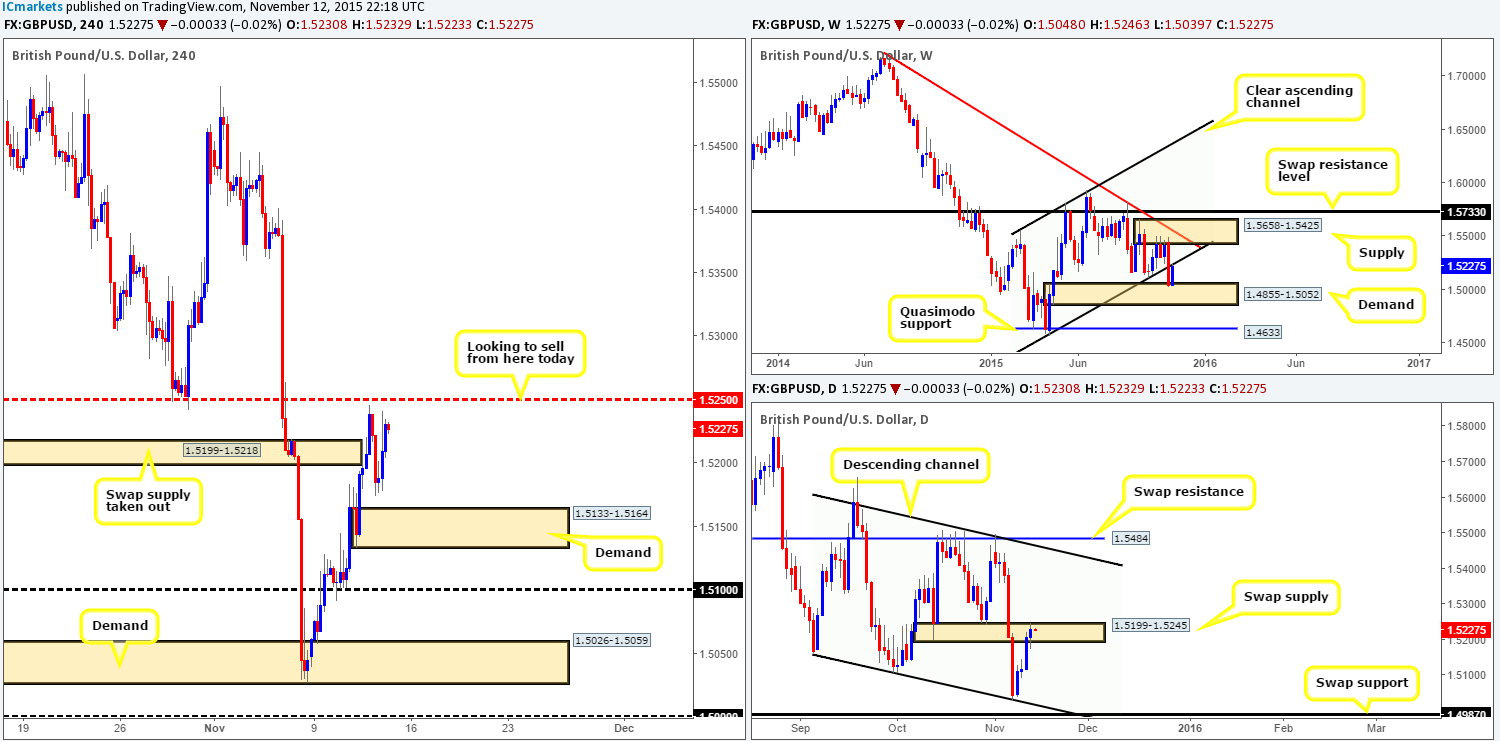
Levels to watch/ live orders:
- Buys: Flat (Stop loss: N/A).
- Sells: 1.5250 [Tentative – confirmation required] (Stop loss: dependent on where one confirms this level).
AUD/USD:
Boosted by a positive jobs report, the Aussie dollar aggressively rocketed higher early on during yesterday’s trade. Offers at psychological resistance 0.7100 were eaten up and the pair drove into supply at 0.7169-0.7143. For all that though, London action saw this market reverse, taking back around 50% of recent gains and retesting 0.7100 as support which held firm into the close 0.7125.
Considering that price is now lodged (mid-range) between 0.7100 and the aforementioned supply zone, where does our team stand in the bigger picture? Up on the weekly timeframe, action appears to be responding nicely to demand at 0.6935-0.7046, which, as you can see, shows room for further upside towards supply at 0.7438-0.7315. Down on the daily chart, however, we are seeing room for this market to advance further up to supply at 0.7224-0.7184.
Taking into account all of the above, we have the following noted…
- Given that price is trading from weekly demand and also shows room to appreciate on the daily, selling anywhere other than around psychological resistance 0.7200 (located around the above said daily supply) would be too risky for our liking.
- Should price re-visit the 0.7100 support today on the other hand, we may, dependent on how the lower timeframes react and of course the time of day, take a long from here in the hope that higher timeframe buying pressure will take out the current H4 supply and hit 0.7200.
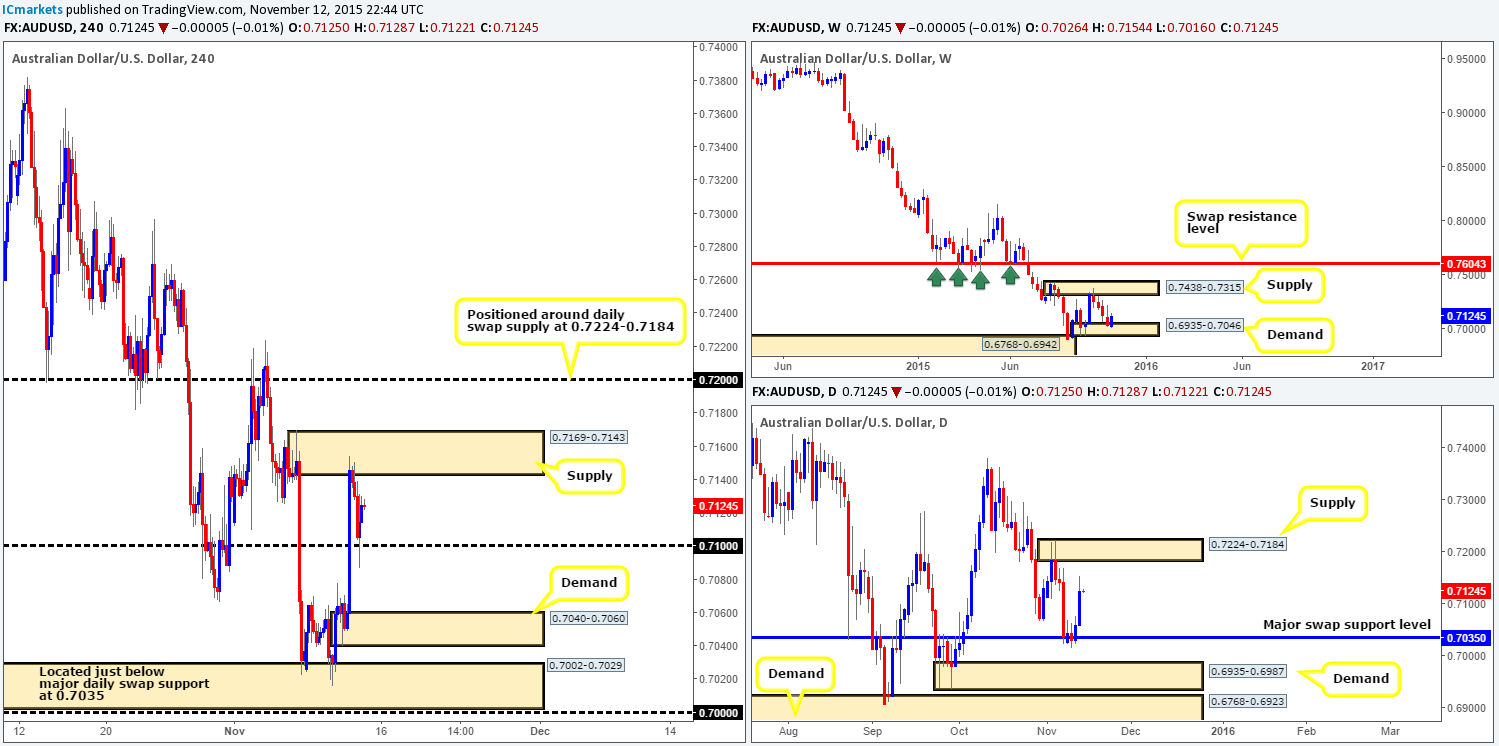
Levels to watch/ live orders:
- Buys: 0.7100 region [Tentative – confirmation required] (Stop loss: dependent on where one confirms this level).
- Sells: 0.7200 region [Tentative – confirmation required] (Stop loss: dependent on where one confirms this level).
USD/CAD:
Following yet another fakeout below the current H4 range 1.3244/1.3297 into swap demand at 1.3237-1.3213, an unrelenting squeeze north took place during the Asia and London sessions yesterday. This move, as you can see, forced price above the H4 consolidation high 1.3297 to a fresh top of 1.3341, just missing the daily Quasimodo resistance level at 1.3352 before collapsing back into the H4 range by the day’s end.
Given this recent movement, our team is now only interested in selling (with confirmation to avoid any fakeout that may take place) from the above said daily Quasimodo resistance level, due to it sitting neatly within a supply/ swap resistance area seen on the weekly timeframe at 1.3456-1.3277/1.3381. Furthermore, the H4 high 1.3341 printed yesterday is perfectly positioned below our daily level to be faked in order to accumulate liquidity (buy stops). Lots of traders look to fade prior highs and lows and place their stops very close, which is dangerous when a higher timeframe level lurks in the background!
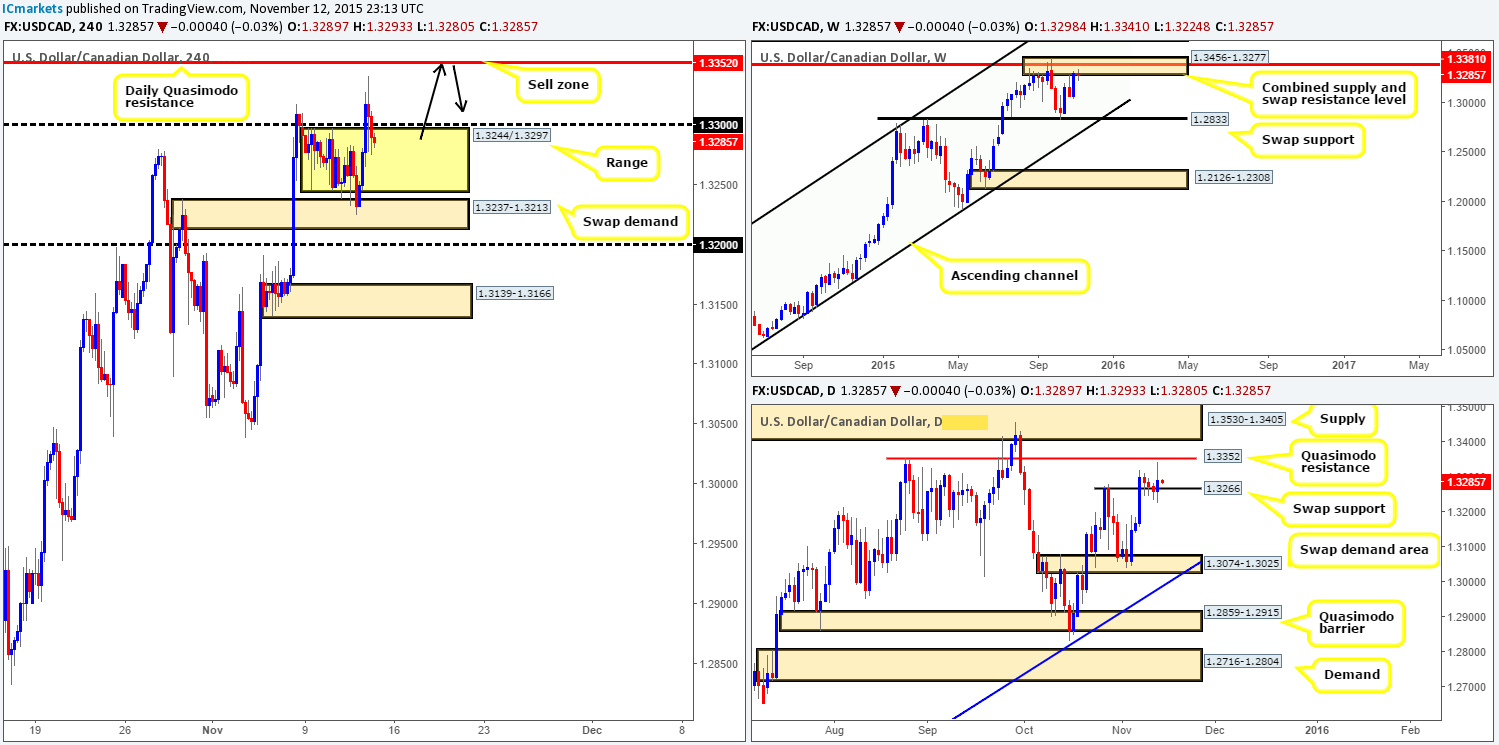
Levels to watch/ live orders:
- Buys: Flat (stop loss: N/A).
- Sells: 1.3352 [Tentative – confirmation required] (Stop loss: dependent on where one confirms this level).
USD/CHF:
What a beautiful site the H4 chart is! In our previous report (http://www.icmarkets.com/blog/thursday-12th-november-heavy-market-action-expected-today-as-both-draghi-and-yellen-take-center-stage/) we mentioned that a second retest of the H4 resistance barrier at 1.0083 would likely be good for another short trade. And as can be seen, price aggressively spiked up to this level following a rebound from the minor intraday support at 1.0028, and then proceeded to drive lower, momentarily surpassing parity and rebounding from lows of 0.9989. Unfortunately, we were not able to catch the sell trade from 1.0083 as price moved too fast! Well done to any of our readers who did manage it though!
Ok, so with the buyers and sellers now battling for position around the almighty 1.0000 number right now, what’s likely in store for this market today? Well, price is still seen trading from the lower limits of a stacked weekly supply formation coming in at 1.0126-1.0044 (upper zone is seen at 1.0239-1.0131), which merges so nicely with an AB=CD Harmonic pattern completing around 1.0046 region. In addition to this, daily action has responded nicely to the underside of supply drawn from 1.0126-1.0055 (ties in lovely with the weekly supply area mentioned above at 1.0126-1.0044), with room to continue trading lower until the swap support level seen at 0.9956. Therefore, due to this higher timeframe pressure, the most we see price bouncing to from 1.0000 today is 1.0028 – a minor swap resistance barrier.
In the event that our above analysis is correct, there is unfortunately not much space for a short below 1.0000, as there sits a strong-looking demand zone visible at 0.9944-0.9967 (surrounds the above said daily demand area at 0.9944-0.9967).
With the above taken into account, there is, as far as we see, not much in the way of a tradable setup on this pair today. As such, we’ll patiently wait for further developments on the side lines today.
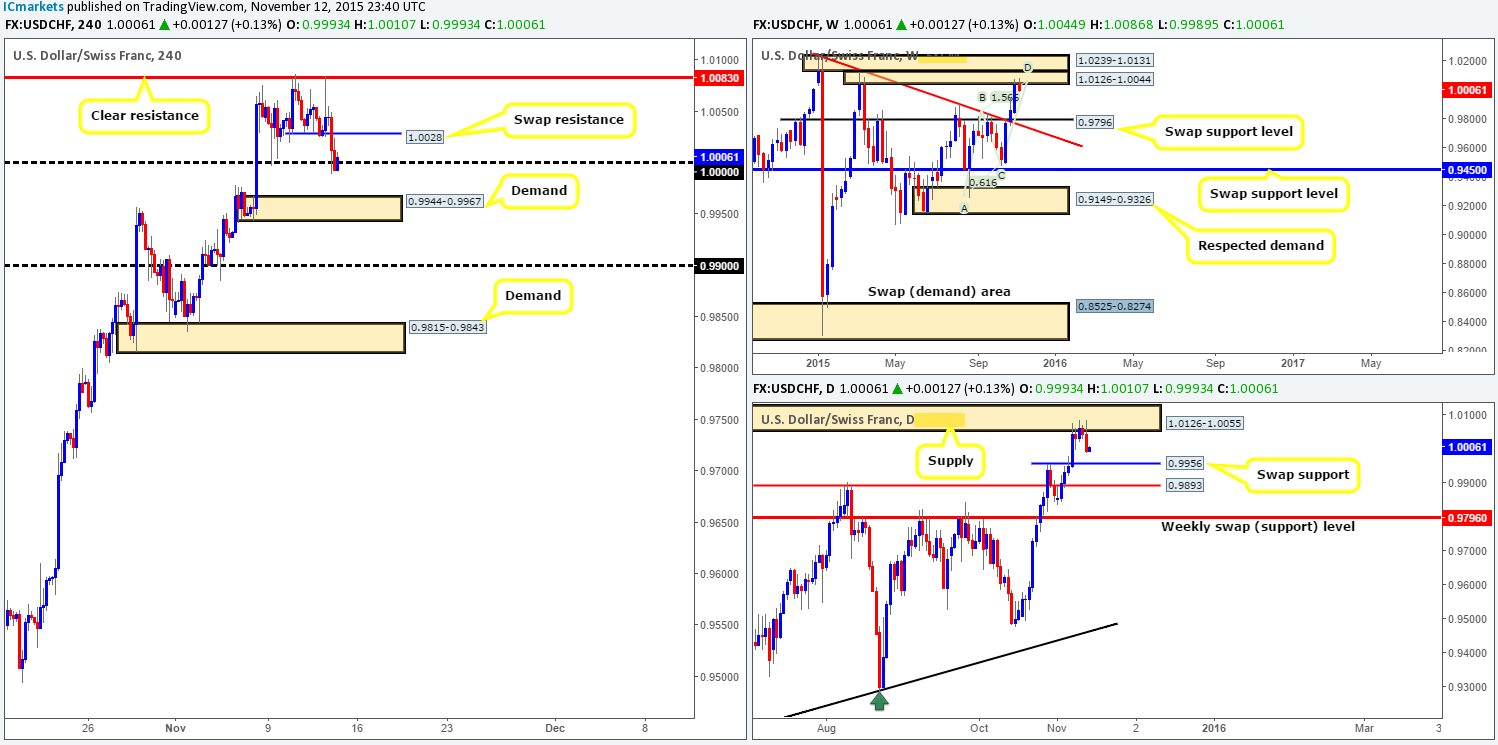
Levels to watch/ live orders:
- Buys: Flat (Stop loss: N/A).
- Sells: Flat (Stop loss: N/A).
DOW 30:
Following a small rebound north from just above the H4 support area yesterday at 17655-17686, prices tumbled going into London trade. The market ended the day down 320 points, taking out a major H4 swap demand (now supply) area at 17574-17520 in the process, and recorded lows of 17439.
This recent sell-off has not only changed the structure of the H4, but also that of the higher timeframes as well. Weekly action shows that price engulfed the swap demand area at 17800-17600, and is, at the time of writing, now likely free to continue lower to connect with 17135 – a swap support level. By the same token, we can see that the daily stacked demand (now supply) formation at 17541-17617/17609-17680 was wiped out, thus potentially opening up the path for a run down to demand coming in at 17133-17314.
Under the above circumstances, we would consider a short today if price successfully retested 17574-17520 (positioned within the lower limit of the above said daily stacked supply formation) as supply (blue arrows). Of course, this would depend on the time of day as we try not to leave positions open over the weekend. Conversely, should prices not reach this area today and continue to depreciate, we would then be looking to enter long (with confirmation) around the H4 swap demand zone (black arrows) seen at 17351-17278 (located within the aforementioned daily demand).
The reason confirmation is needed at the H4 swap demand is simply because , as we mentioned above, the weekly flow is pointing south for the time being, and could very easily smash through this zone altogether
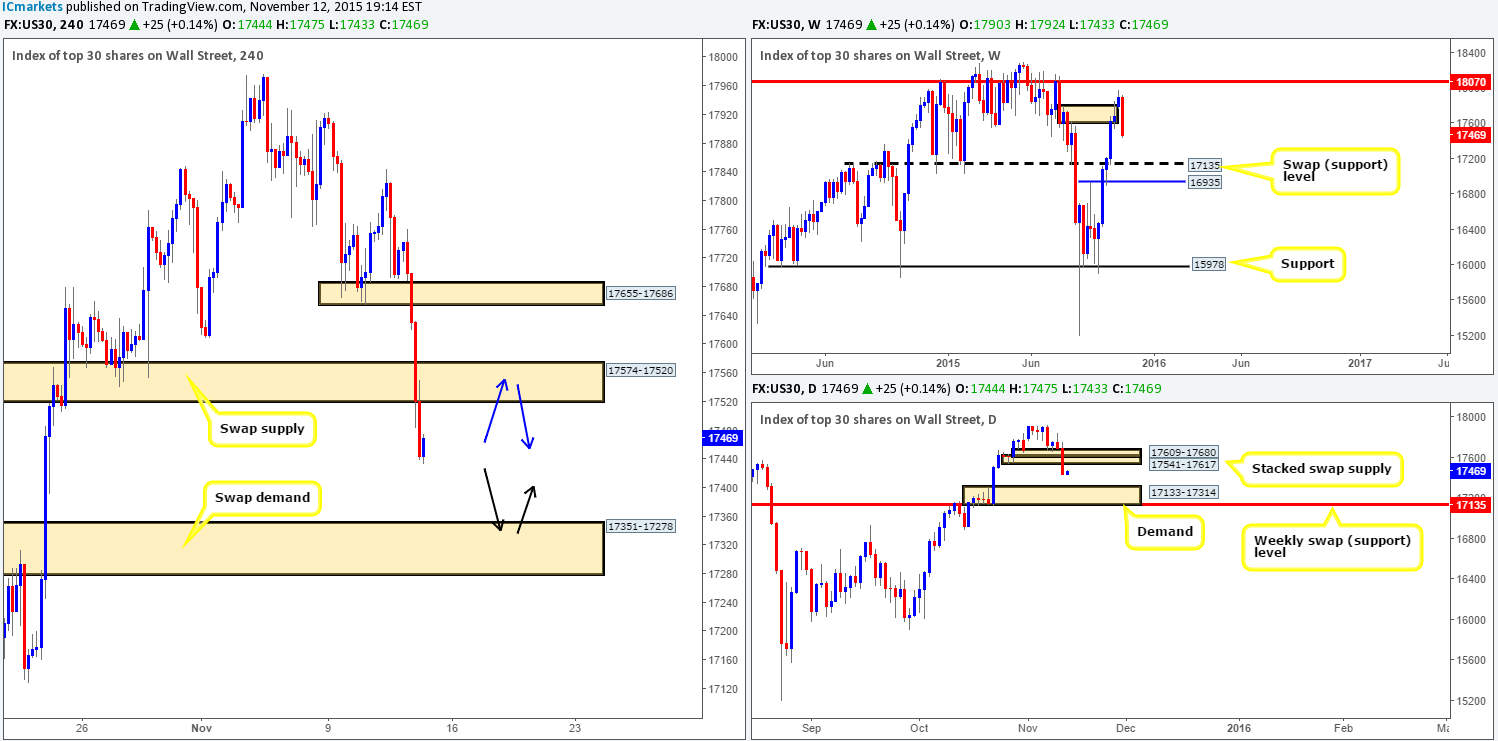
Levels to watch/ live orders:
- Buys: 17351-17278 [Tentative – confirmation required] (Stop loss: dependent on where one confirms this area).
- Sells: 17574-17520 (Stop loss: 17582).
XAU/USD: (Gold)
Kicking off this morning’s analysis with a look at the weekly timeframe shows that price has recently plugged into bids sitting at the weekly Quasimodo support level at 1074.6 for the second time in four months. Should the buyers continue to defend this level, we see very little stopping Gold advancing to connect with the underside of the swap supply zone at 1098.6-1121.7.
Turning our attention to the H4 timeframe, however, we can see that price violently stabbed below the support area drawn from 1079.9-1083.5 yesterday to connect with the above said weekly Quasimodo level. Now, along with the supportive pressure being seen from the weekly, H4 candle action is also looking very bullish right now. Here’s why…
Check out the wick marked with a black arrow at 1089.4, this likely consumed a ton of sellers prior to the drop lower, thus potentially clearing the path north for further buying. We do see supply above this wick marked with a blue arrow at 1093.4-1092.2 which could indeed be troublesome. However, once/if price reaches this high on the curve; we feel we are at least going to connect with Monday’s high at 1095.6. So, with this in mind, our objective is quite simple today. Attempt to find a lower timeframe confirmed long entry within the base of the recently pierced support area at 1079.9-1083.5.
Should the above come to fruition, and price manages to close above 1095.6 today, we would then be comfortable to leave our position open over the weekend as we feel Gold will then climb to at least the broken Quasimodo line at 1101.2.
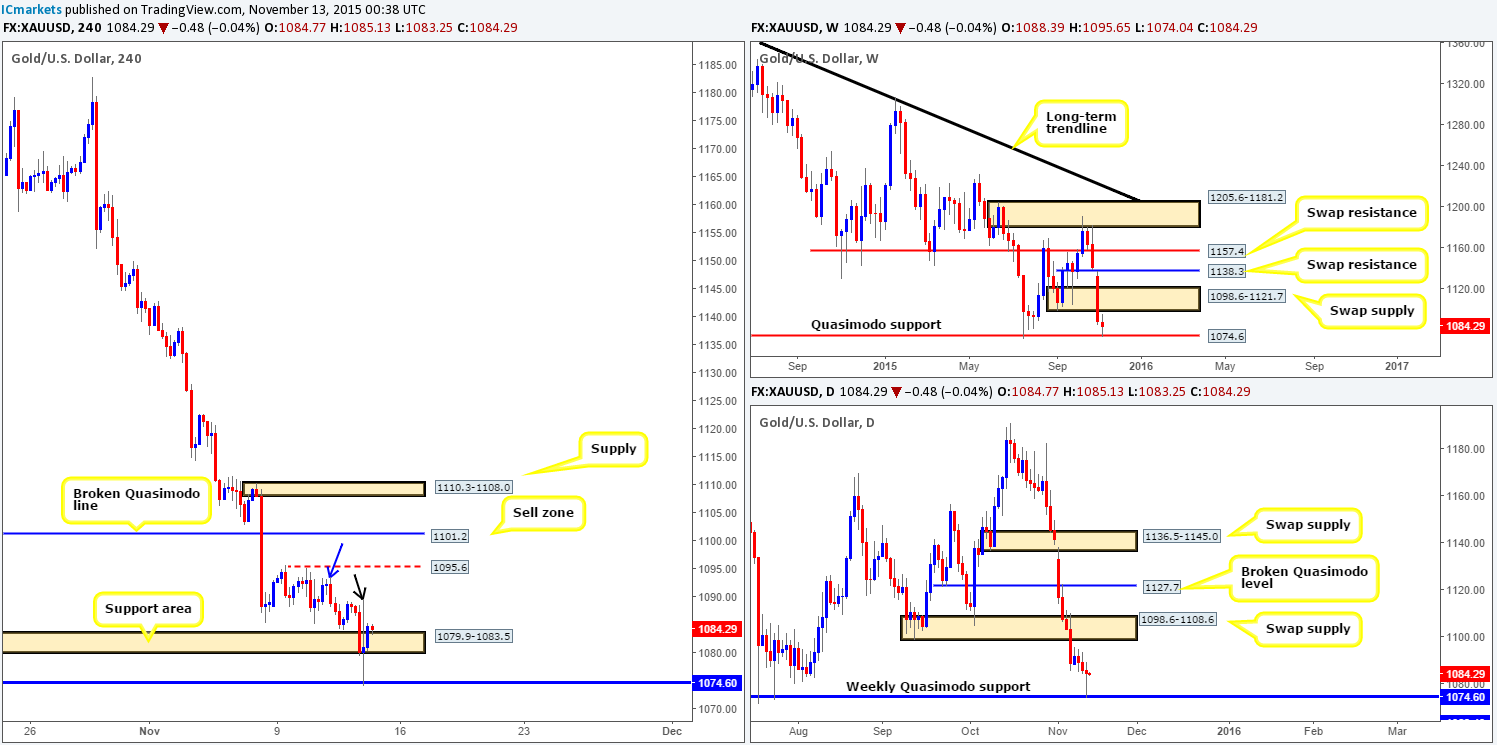
Levels to watch/live orders:
- Buys: 1079.9-1083.5 [Tentative – confirmation required] (Stop loss: dependent on where one confirms this area).
- Sells: Flat (Stop loss: N/A).