
A combination of repeating price patterns with Fibonacci analysis yields another branch of technical analysis known as Elliott Waves. This is named after its founder Ralph Nelson Elliott who analyzed 75 years’ worth of stock data before formulating and compiling his theories in a book entitled The Wave Principle. He discussed how price movements are not completely random and that markets traded in repeating cycles. He noted that the upward or downward swings in price action are a result of a collective market psychology, central to which are emotions of traders. In his book, he outlined ways in which traders can catch trends at ideal prices as he detailed methods of catching market corrections and continuations. One of the most basic wave patterns discussed in his book is the 5-3 pattern, wherein the first five waves are the impulse waves and the last three waves are corrective waves.
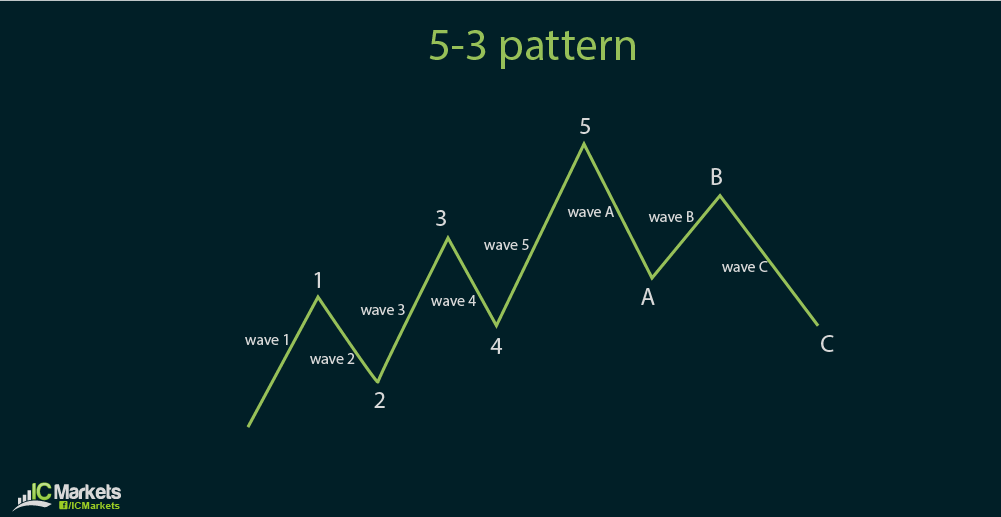
The first wave consists of the initial move upwards (or downwards in a downtrend) which is sparked by a sudden influx of buyers (or sellers), spurred to take long (or short) positions and causing the price to make a big rally (or selloff). The second wave occurs in the opposite direction of the first one as traders book profits off a key inflection point or start to believe that the asset or currency pair is already overvalued (or undervalued). This leads to a move lower (or higher) but not beyond the initial price before the first wave started. The third wave takes place when more buyers (or sellers) pay attention to the asset and see that it is moving in a strong trend. This pullback allows them to get in the trend at a relatively good price so they set their long (or short) orders and push the price up (or down). The fourth wave happens because traders once again think that the asset is becoming overvalued and that it may be time to book profits once again. The fifth and last wave occurs to extend the price rally to a point wherein it becomes extremely overvalued (or undervalued), before the trend starts to reverse. The first, third, or fifth impulse waves may have a chance of being extended, which means that they can be longer than the other two impulse waves. Again, this depends mostly on market psychology or sentiment. Apart from that, fundamental and technical factors may also combine for a stronger push in price action. What’s particularly interesting about Elliott Waves is that you can see these impulse and corrective waves occur in longer-term time frames and even as you zoom in to much shorter-term time frames, such as the 1-minute chart. Elliott has mentioned that there are roughly 21 wave patterns illustrating this phenomenon. These depend on the strength of the waves or the sharpness or shallowness of each pullback. These can be in the form of zig-zags, flat formations, or triangle patterns – all of which have the same general appearance as the 5-3 wave pattern. What’s important to note about these Elliott Waves are the three cardinal rules. First is that the third wave can never be the shortest impulse wave. Second is that the second wave can never go beyond the start of the first wave. Third is that the fourth wave can never cross into the same area as the first wave.


