


Discover the Latest Articles on our Blog
The modern guide to Trading
Discover the process and tools behind high-performing trading.
Don't Miss Out on the Latest Insights
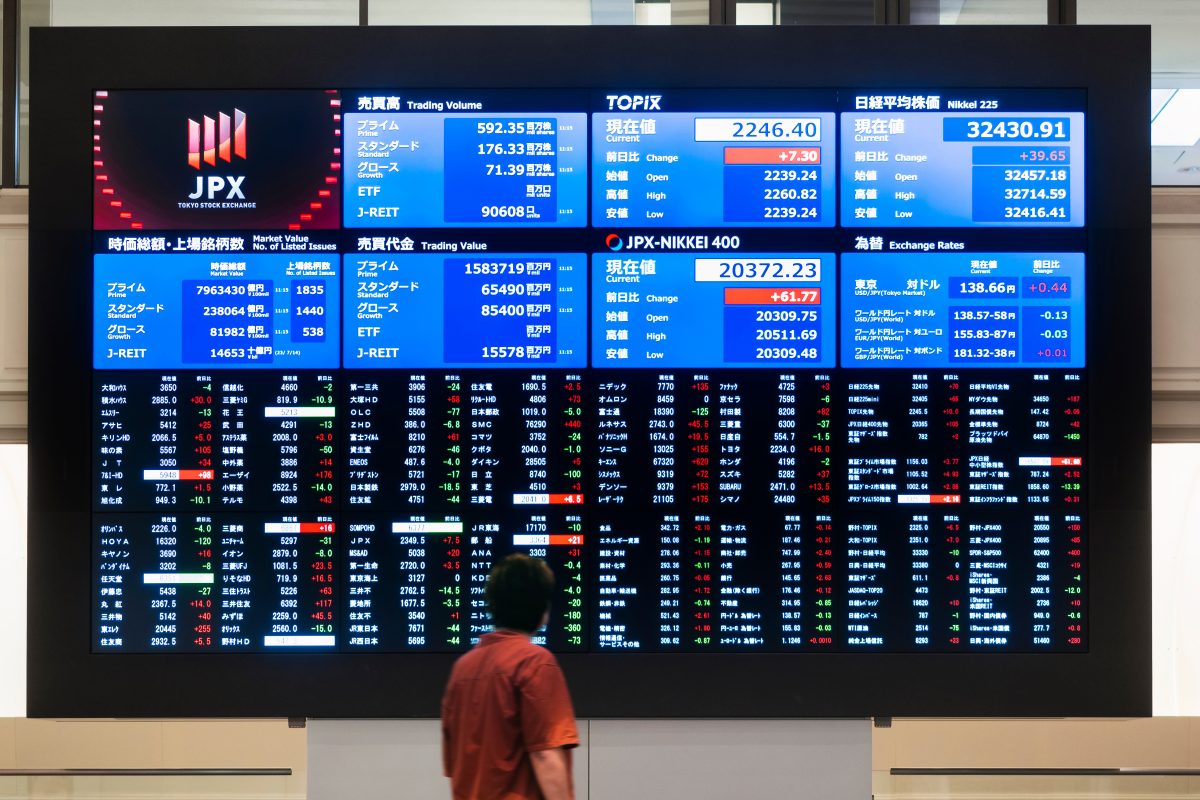
Friday 11th July 2025: Asian Markets Navigate Mixed Signals Amidst Tariff Concerns and Earnings Season
By IC Markets Global


Stay Informed: Forex Video Updates


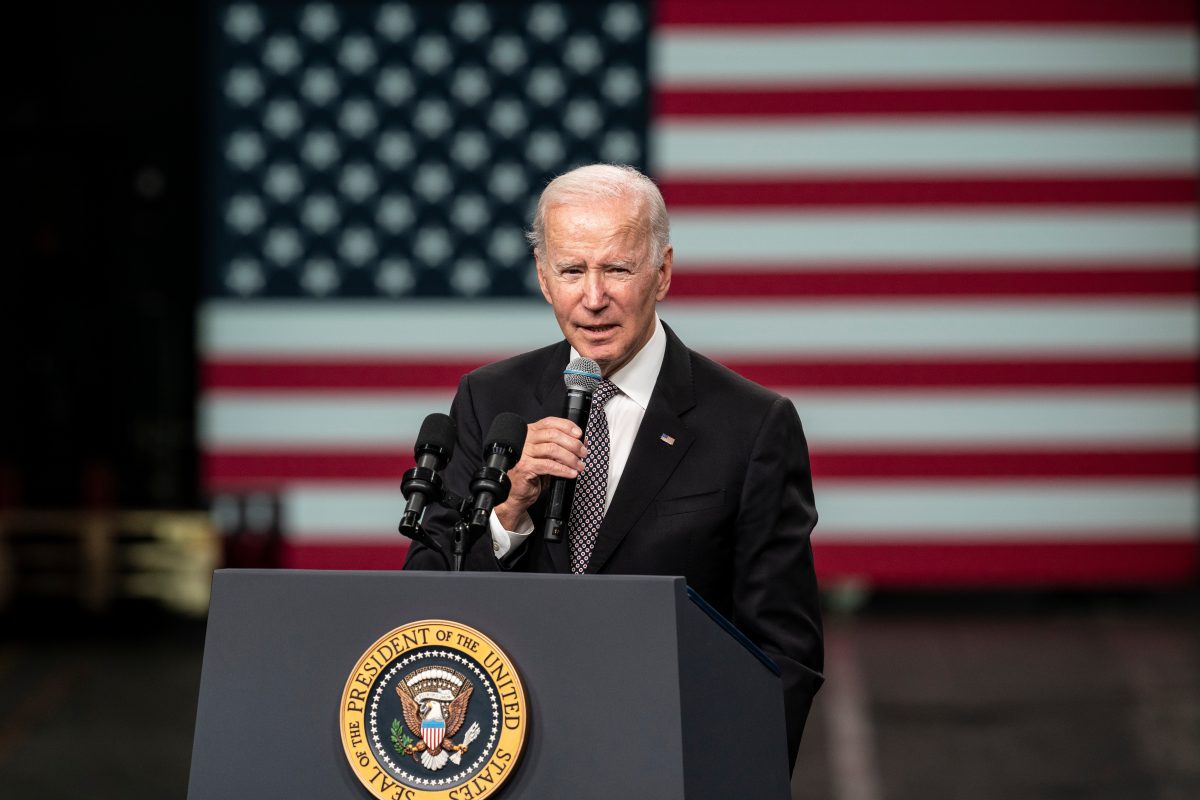
Trump Victory to Reverberate Around Markets
IC Markets Global Nov 2024
Biden’s Withdrawal: What It Means for the 2024 Election and Market Reactions
IC Markets Global Jul 2024
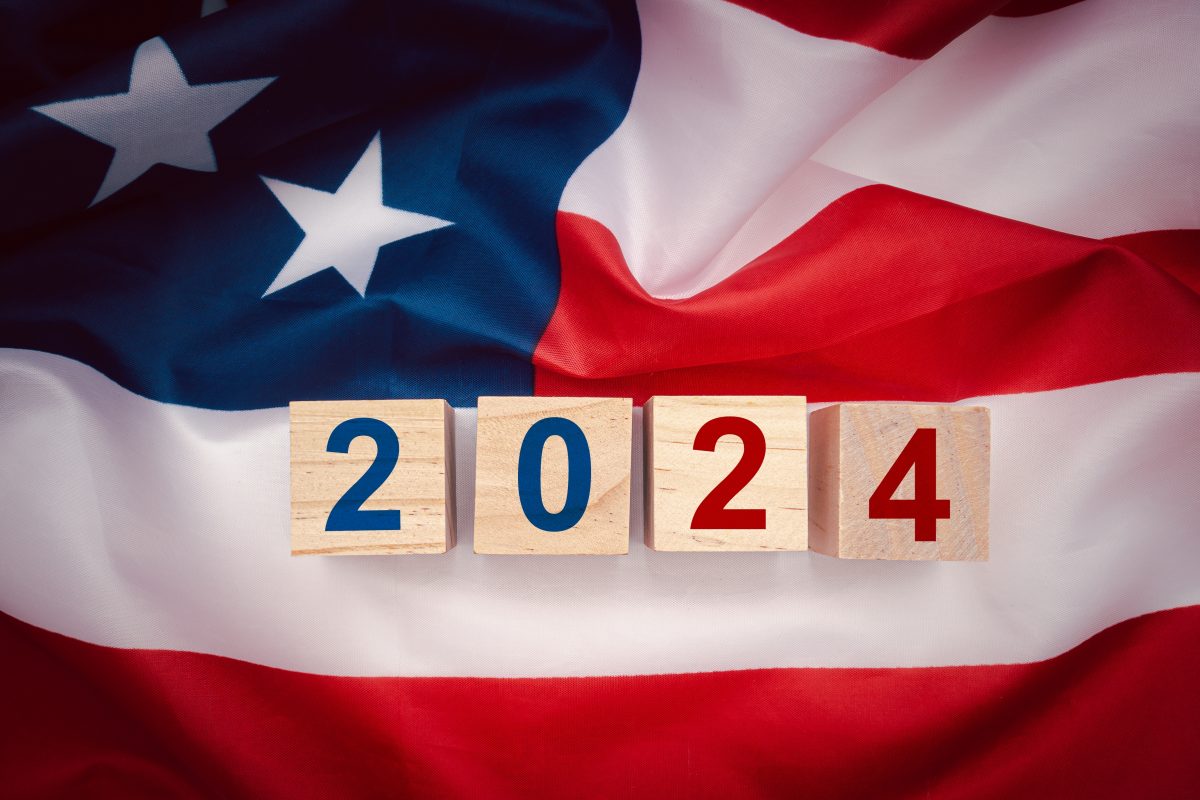
Could the Upcoming US Election Impact Your Portfolio?
IC Markets Global Jul 2024
Editor’s Pick
Most Read


Featured

IC Markets Global Announces the Launch of Season 5 of ICYT, Produced by Bloomberg Media Studios
By IC Markets Global


Listen to the Latest IC Your Trade 3 Podcast


Explore More
Friday 11th July 2025: Asian Markets Navigate Mixed Signals Amidst Tariff Concerns and Earnings Season
By IC Markets Global