A note on lower timeframe confirming price action…
Waiting for lower timeframe confirmation is our main tool to confirm strength within higher timeframe zones, and has really been the key to our trading success. It takes a little time to understand the subtle nuances, however, as each trade is never the same, but once you master the rhythm so to speak, you will be saved from countless unnecessary losing trades. The following is a list of what we look for:
- A break/retest of supply or demand dependent on which way you’re trading.
- A trendline break/retest.
- Buying/selling tails – essentially we look for a cluster of very obvious spikes off of lower timeframe support and resistance levels within the higher timeframe zone.
- Candlestick patterns. We tend to only stick with pin bars and engulfing bars as these have proven to be the most effective.
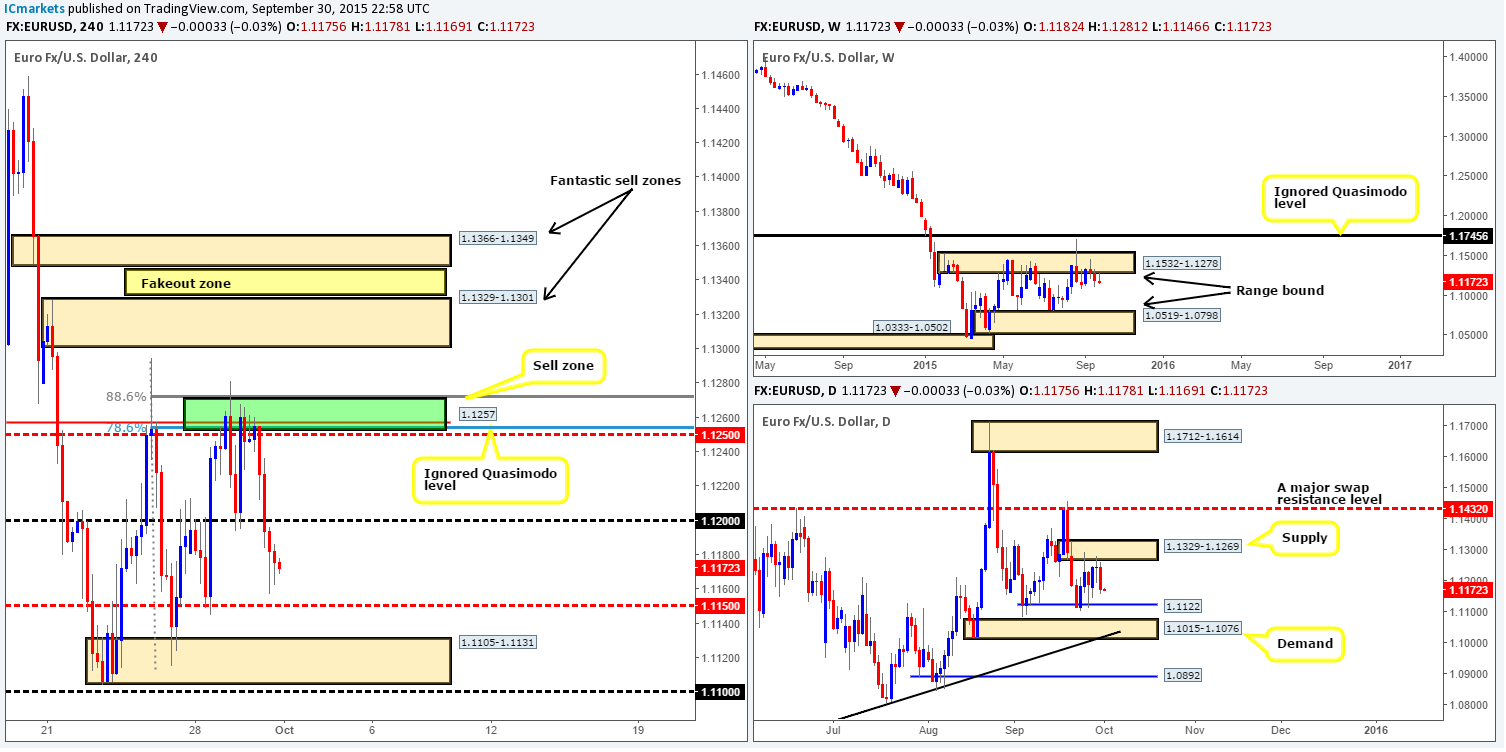
EUR/USD:
The value of the EUR weakened in aggressive fashion on Wednesday from our original sell zone 1.1250/1.1270. This, as you can see, forced price to punch through bids sitting at psychological support 1.1200 and reach lows of 1.1157 on the day.
Given that this pair is now effectively trading in no-mans-land between 1.1200/1.1150, what do we see in store for this market today? Well, looking across to the higher timeframe structures, we can see that price sold off beautifully from daily supply at 1.1329-1.1269 with room still seen to continue lower down to support at 1.1122. In addition to this, we mustn’t forget that weekly action remains loitering around the underside of weekly supply at 1.1532-1.1278.
Under the above circumstances, we believe this market may be heading lower today. 1.1150 is likely going to struggle to hold firm in our opinion, since there is an even more attractive area seen just below it at 1.1105-1.1131 (surrounds aforementioned daily support). With that being said, we may, dependent on how lower timeframe price action responds to this area of course, consider a long position here today.
Drawbacks to a trade from here are 1.1150, which at that point may repel the market as resistance. Secondly, there is a chance price will fake lower to psychological support 1.1100. And finally, let’s also remember that by entering long here, we are essentially buying into weekly supply (see above), so do trade cautiously!
Levels to watch/live orders:
- Buys: 1.1105-1.1131 [Tentative- confirmation required] (Stop loss: dependent on where one confirms this area).
- Sells: Flat (Stop loss: N/A).
GBP/USD:
For those who follow our analysis on a regular basis, you may recall us mentioning to watch the 4hr swap support at 1.5114 for a potential buy trade yesterday (http://www.icmarkets.com/blog/wednesday-30th-september-daily-technical-outlook-and-review/). As you can see, there has indeed been a reaction from this barrier. However, as of yet, we have not managed to pin-point a lower timeframe confirmed buy trade.
Given that the weekly timeframe now shows price kissing channel support (1.4564), and daily action is lurking deep within demand at 1.5088-1.5173, today’s objective is simple. Continue watching for lower timeframe buy confirmation around the 4hr level, 1.5114. Should we manage to spot an entry here today, 1.5147 would be our first port of call to take partial profits, followed by psychological resistance 1.5200. However, we do not plan on closing our full position here, since above this figure, there is very little active supply, at least as far as we see, until the mid-level number 1.5250. It will be interesting to see how this plays out!
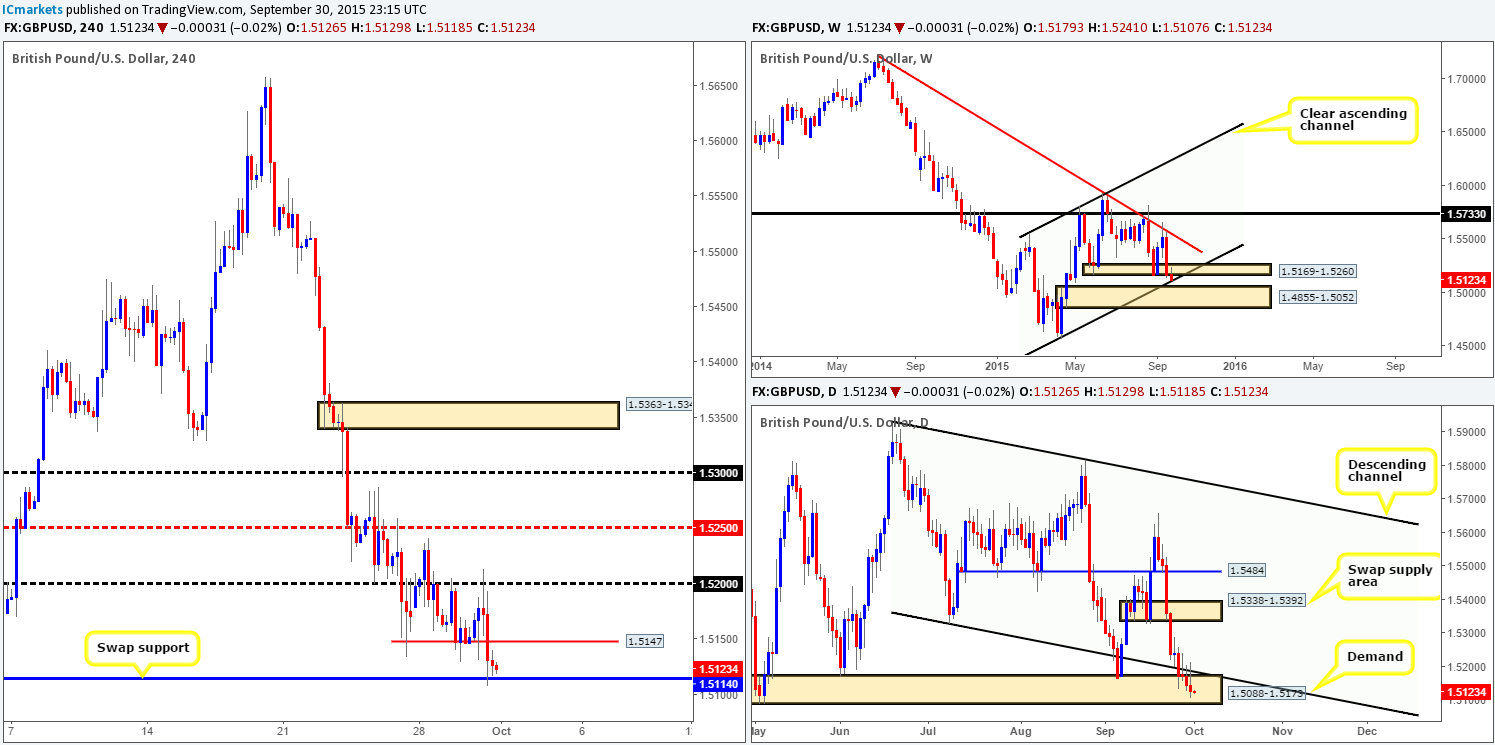
Levels to watch/ live orders:
- Buys: 1.5114 [Tentative – confirmation required] (Stop loss: dependent on where one confirms this level).
- Sells: Flat (Stop loss: N/A).
AUD/USD:
Recent action on the AUD/USD shows price rallied early during yesterday’s trade. This forced this market to break above psychological resistance 0.7000, and come within a pip of connecting with supply at 0.7064-0.7039 before selling off back down to 0.7000.
In view of price now kissing the 0.7000 number once again, let’s take a peek at what the higher timeframes are up to. Over on the weekly scale, the Aussie is currently seen reacting off the top-side of demand coming in at 0.6768-0.6942. Meanwhile, a little lower down on the daily timeframe, we can see that price recently rebounded from the underside of a major swap resistance level at 0.7035.
That being the case, here is our two cents’ worth on where this market could possibly head today:
-
A buy from 0.7000 is certainly viable as long as one waits for the lower timeframes to confirm bullish strength exists here. One would need a relatively tight stop at 0.7000 since there is only forty or so pips of free space to run up the aforementioned 4hr supply.
-
In the event that 0.7000 is taken out, however, one could look to trade any (confirmed) retest seen at the underside of this number. The space below here is far more attractive than above. Check out the tail marked with a black arrow at 0.6989. This spike likely consumed the majority of buyers below 0.7000, which, at least in our book, may suggest a clear path down to 0.6937 – the double bottom pattern, or demand just below it at 0.6920-0.6930.
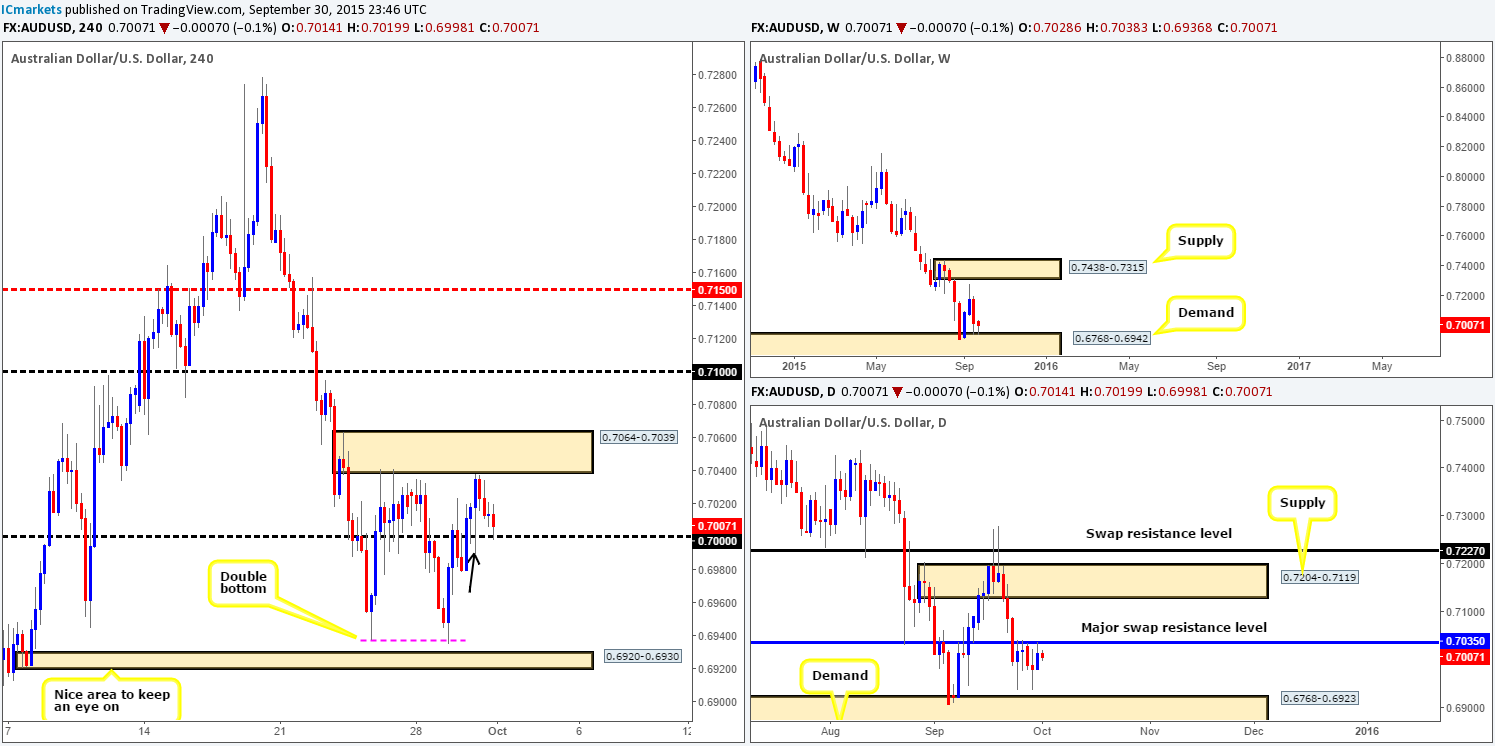
Levels to watch/ live orders:
-
Buys: 0.7000 [Tentative – confirmation required] (Stop loss: dependent on where one confirms this level).
-
Sells: Watch for bids at 0.7000 to be consumed and then look to enter on any retest seen at this level (confirmation required).
USD/JPY:
This morning’s analysis will kick-off with a quick look at the higher timeframe picture. The weekly reveals price is still tightly confined between a swap resistance area at 122.01-121.40 and a support zone coming in at 118.22-119.25. Down on the daily, we can also see price ranging between a swap resistance level at 120.59 and demand drawn from 118.60-119.26.
Given the fact that 4hr action remains trading within a descending channel (119.65/121.21), it’s a very difficult pair for us to trade at the moment. Any level/area positioned in between this downward channel is considered, at least by us, to be mid-range. That being the case, here is what we have jotted down so far:
-
The mid-level number 120.50 is still an attractive level to look for shorts. Not only is it positioned on the outskirts of the aforementioned channel, but it also boasts 61.8% Fib resistance at 120.46. In addition to this, the above said daily swap (resistance) level sits just nine pips above this hurdle at 120.59. In the event of a fakeout above this area, do keep a close eye on 120.71 for a potential bounce south.
-
Other than the above, we still really like the Quasimodo support 119.21. Granted, this level is not located at the extremes of the downward channel, but it has held price higher on two occasions now. What is more, it also boasts convergence with both weekly and daily demand (see above in bold).
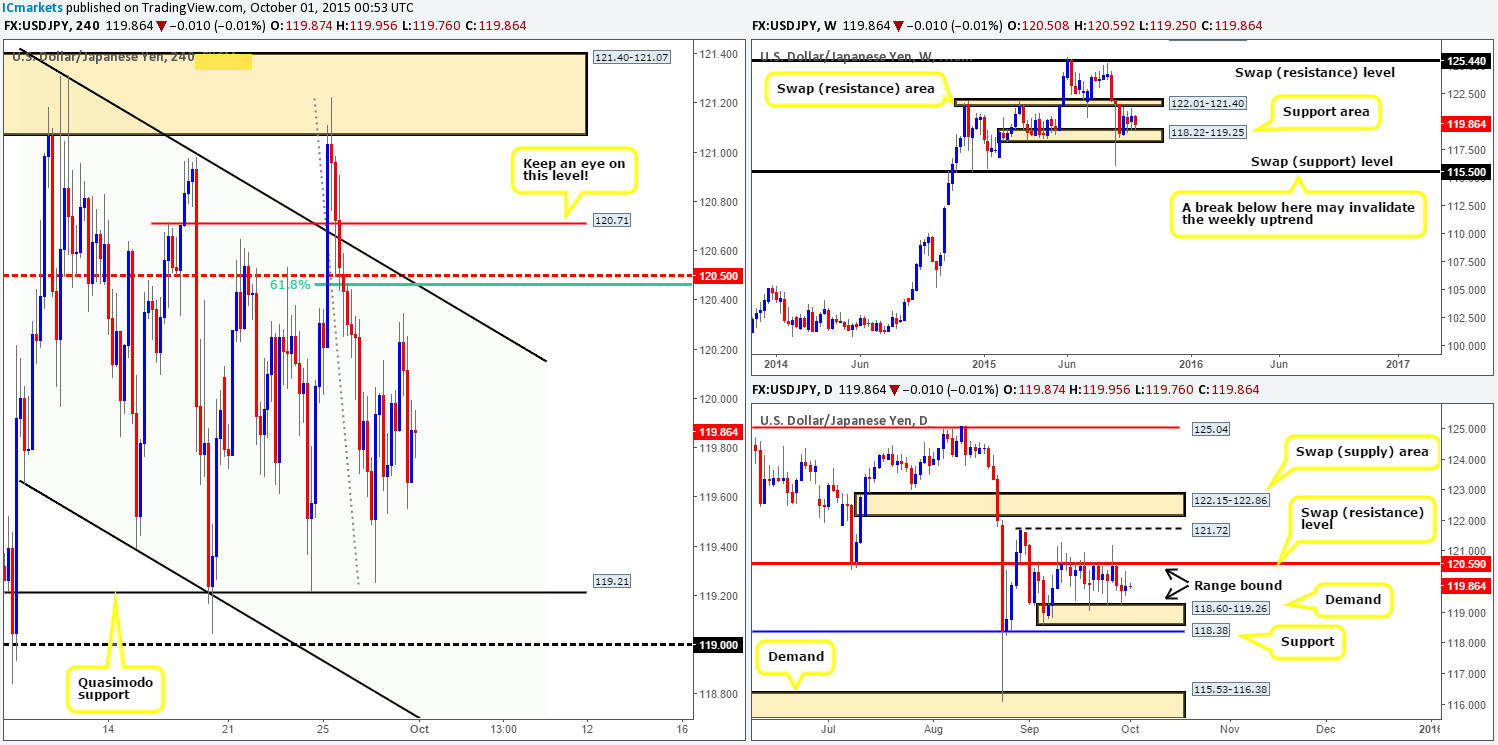
Levels to watch/ live orders:
- Buys: 119.21 [Tentative – confirmation required] (Stop loss: dependent on where one confirms this level).
- Sells: 120.59-120.43 [Tentative – confirmation required] (Stop loss: 120.61) 120.71 [Tentative – confirmation required] (Stop loss: dependent on where one confirms this level).
USD/CAD:
Using a top-down approach this morning, we can see that weekly action has sold off from the swap resistance level at 1.3381, consequently painting a beautiful-looking selling tail in the process. Scrolling lower to the daily timeframe reveals the market sold off from supply given at 1.3530-1.3405. The next downside target to keep an eye on from here comes in at an ascending trendline drawn from 1.2562.
Down on the 4hr scale, market action initially held firm at psychological support 1.3400 going into London trade. The mood, however, turned rather sour as we moved into the American afternoon session. Price plummeted close to 100 pips in one fell swoop, taking out both the mid-level number 1.3350 and also demand at 1.3317-1.3329. Consequent to this, the buyers and sellers are now left to battle it out between the underside of this demand (now potential supply) and psychological support 1.3300.
Taking the above into account, what we’re looking for to happen today is price to take out bids at 1.3300 and close lower. This will, in effect, be our cue to begin watching for price to retest 1.3300 as resistance and show some form of lower timeframe confirming price action. Should the above come to fruition, we’ll confidently enter short, targeting 1.3250, which, if you look across to the daily timeframe, you’ll notice it lines up nicely with the aforementioned daily trendline.
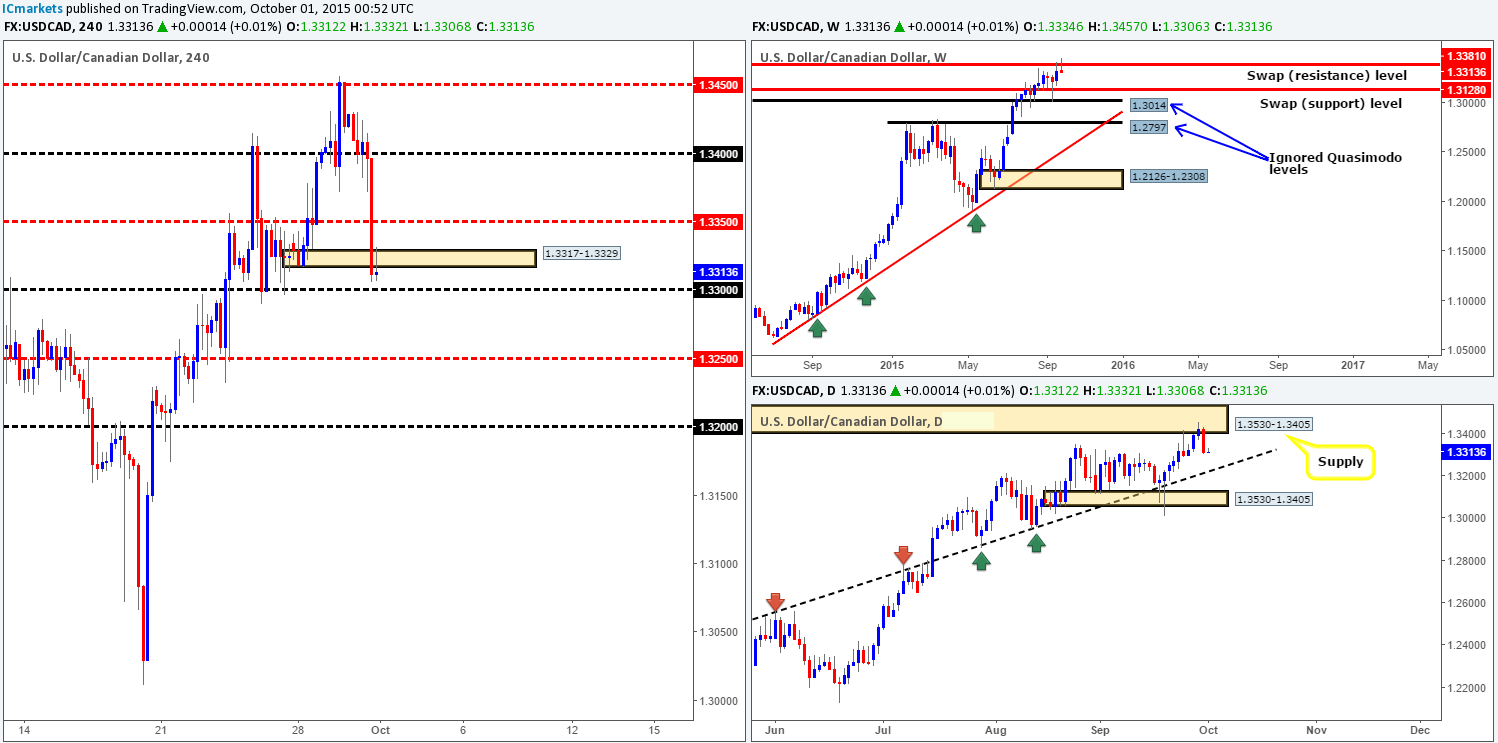
Levels to watch/ live orders:
- Buys: Flat (Stop loss: N/A).
- Sells: Watch for bids at 1.3300 to be consumed and then look to enter on any retest seen at this level (confirmation required).