Key risk events today:
Fed Chair Powell Speaks.
(Previous analysis as well as outside sources – italics).
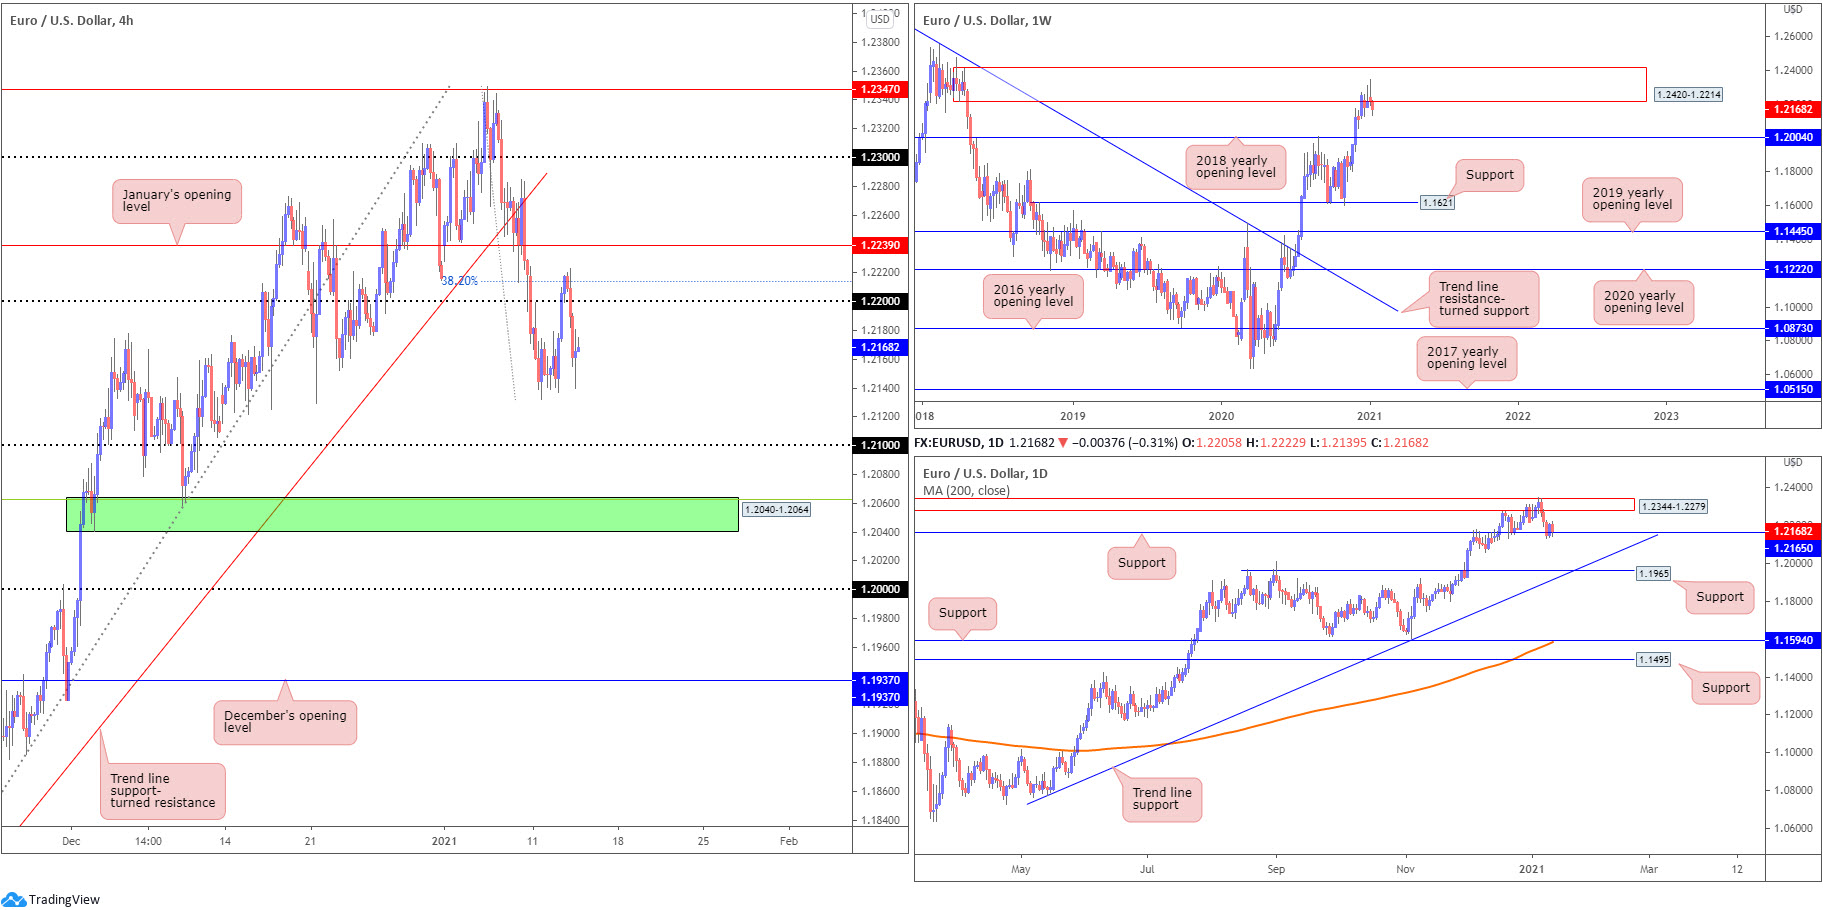
EUR/USD:
For those who read Wednesday’s technical briefing you may recall the following (italics):
A retest at 1.22/1.2213 (H4) could prove interesting for sellers today, particularly for those looking to secure an entry from weekly supply, targeting 1.21 (H4). However, this would entail going up against daily support at 1.2165.
As evident from the H4 chart, price action did indeed cross swords with 1.22/1.2213 (38.2% Fib level) on Wednesday. Clearly reinforced with strong selling interest, Wednesday had the unit retest Tuesday’s lows around the 1.2150 point. South of this level, 1.21 calls for attention, followed by demand (green) at 1.2040-1.2064 and a 38.2% Fibonacci retracement ratio at 1.2062 (green line).
Supply at 1.2420-1.2214 remains central focus on the weekly scale, with last week establishing a shooting star pattern off multi-month peaks at 1.2349. Should sellers take the reins, the 2018 yearly opening value at 1.2004 is likely a level downside movement may target. In terms of trend, however, upside remains favoured – more so if price overthrows the 1.2555 February 12 high (2018). The above implies buyers could take the wheel and eventually attempt to overthrow the aforementioned supply zone.
Technical structure on the daily timeframe is seen shaking hands with support priced in at 1.2165, following a dominant rejection from supply at 1.2344-1.2279 (nestled within the walls of weekly supply mentioned above at 1.2420-1.2214). A break of support not only lays the basis for further selling to support at 1.1965 (and trend line support, taken from the low 1.0774), a bearish move would also add conviction to the weekly timeframe’s supply.
Areas of consideration:
- Longer term, although the trend has faced an upward trajectory since early 2020, weekly price displays signs of weakness within supply at 1.2420-1.2214.
- The retest at 1.22/1.2213 (H4) has clearly interested sellers. Breaching 1.2150 provides an opportunity for current sellers to pyramid positions, targeting 1.21 (H4). A 1.2150 breach could also see fresh sellers enter the fight.
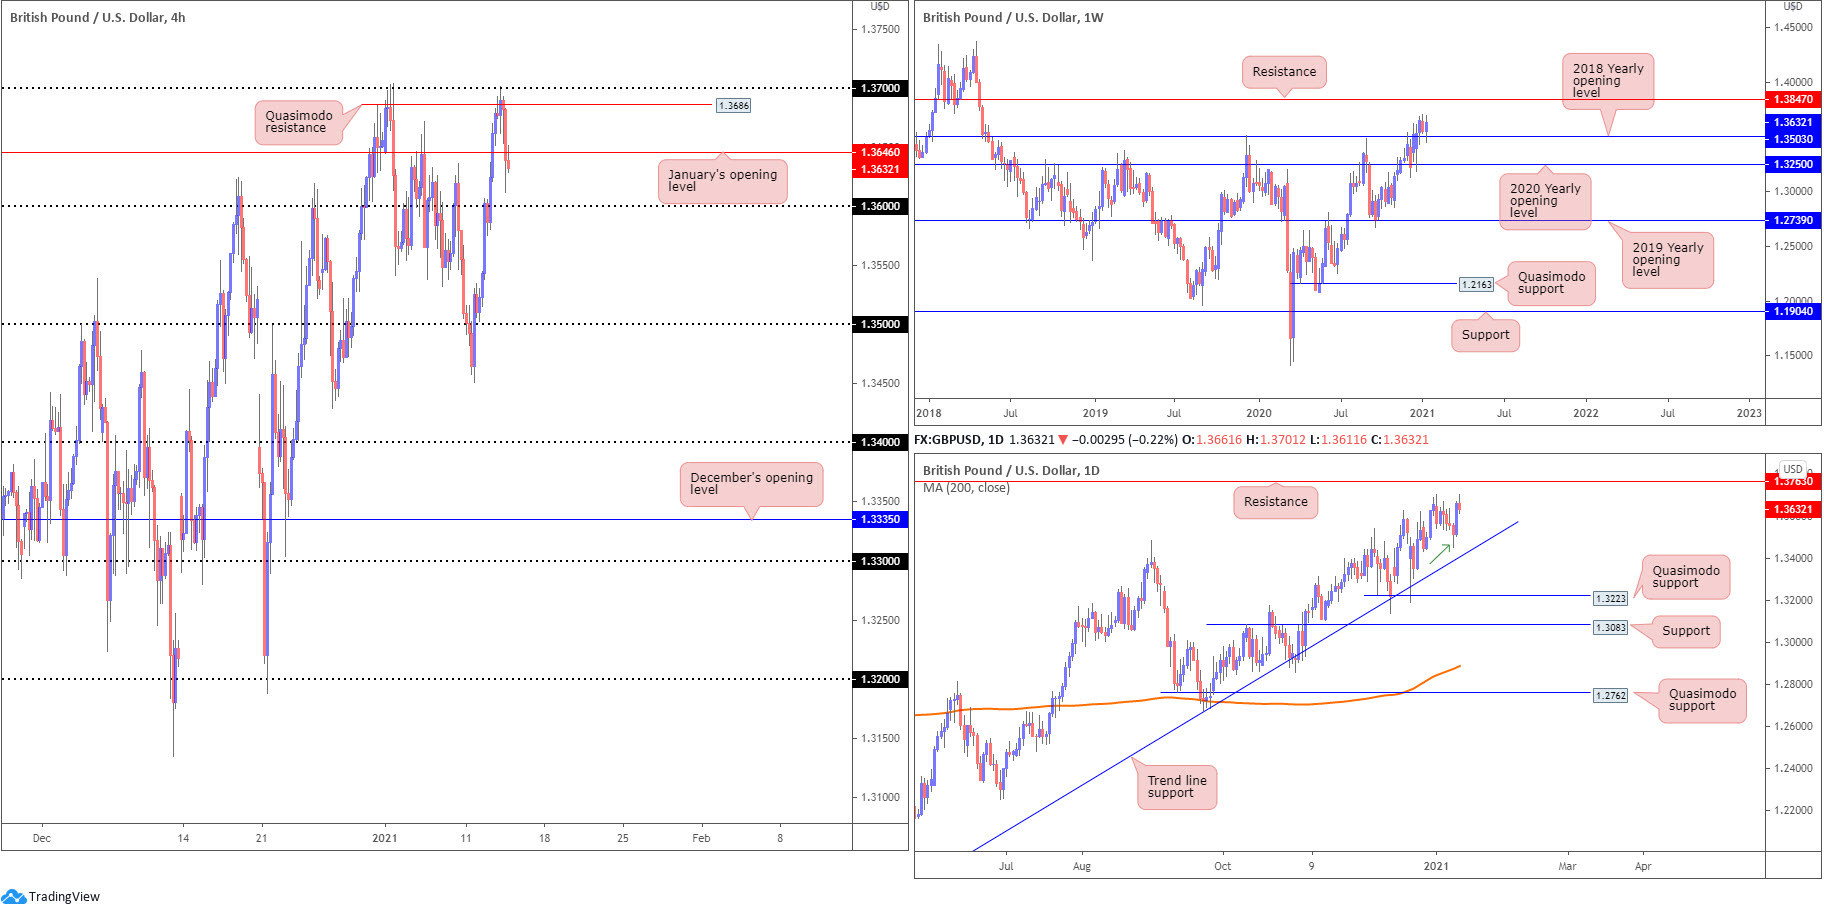
GBP/USD:
GBP/USD grasped the underside of the 1.37 figure on Wednesday, supported by Quasimodo resistance at 1.3686, and explored lower territory as the US dollar index reclaimed a large portion of Tuesday’s losses.
Shorter-term flow (H4) clawed through January’s opening value at 1.3646, airing the possibility of price knocking on 1.36’s door today. Below the aforementioned level, limited support is seen until we welcome the 1.35 neighbourhood.
Technical research based on the weekly timeframe shows buyers remain somewhat offensive off the 2018 yearly opening value at 1.3503. To the upside, resistance at 1.3847 is on the radar. Also of technical interest is a recent engulf of 1.3514 (December 9 [2019] high), helping to confirm the current uptrend in play since early 2020.
The technical landscape on the daily timeframe shows price moulded a bullish pivot swing point (green arrow) on Tuesday, north of trend line support, etched from the low 1.1409. Despite Wednesday’s correction, resistance can be seen at 1.3763, north of the 1.3703 January 4 high.
Areas of consideration:
- Weekly support at 1.3503 holding, in a market trending higher, places long-term buyers in a favourable position.
- 35 is a possible support to be mindful of on the H4 timeframe. Conservative buyers may seek at least additional candlestick confirmation from this level, given the lack of confluence.
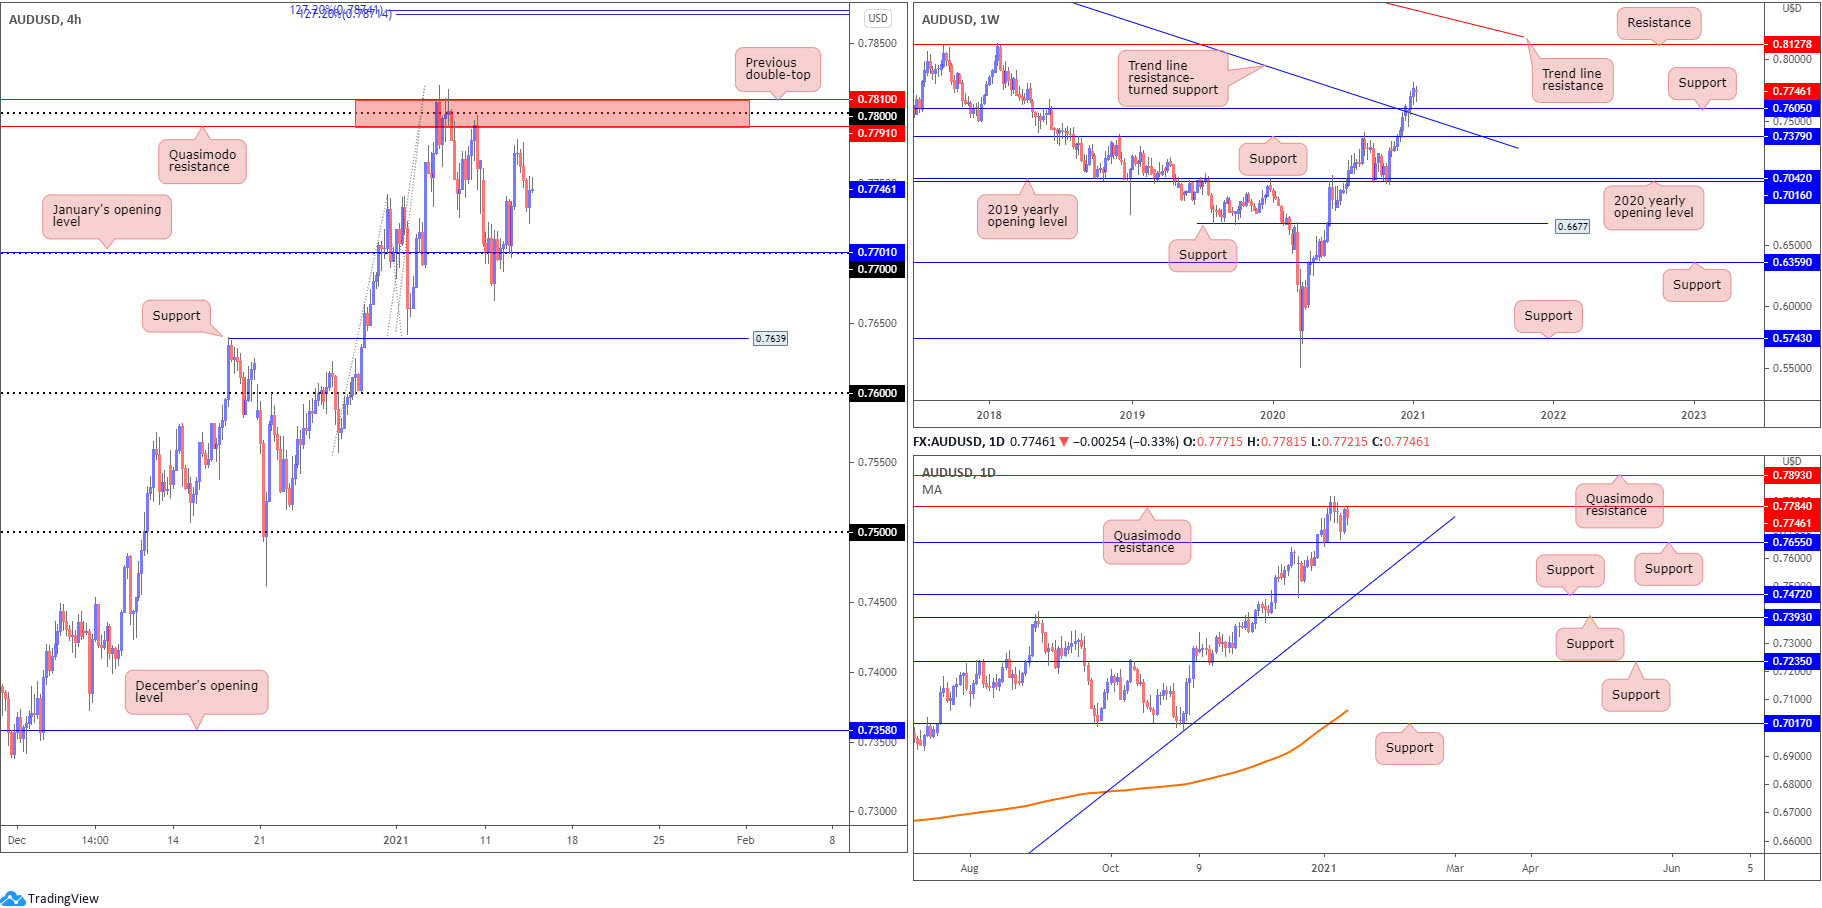
AUD/USD:
The Australian dollar eked out marginal losses against the US dollar on Wednesday, as the US dollar index attempted to reclaim recently lost ground.
Resistance on the H4 timeframe remains fixed around 0.7810/0.7791 (red), an area formed from a previous double-top pattern, a Quasimodo resistance and the 0.78 figure. In terms of support, 0.77 and January’s opening value at 0.7701 are seen. External levels to be aware of are support at 0.7639 and resistance around 0.7873 (Fib ext. levels).
Out of the weekly chart, AUD/USD is seen mildly fading 30-month highs at 0.7820, a few inches north of 0.7605, a previous Quasimodo resistance (now acting support) that merges closely with trend line resistance-turned support, taken from the high 1.1065. This places buyers in a robust position, with room to possibly reach as far north as resistance coming in at 0.8127.
The technical position on the daily timeframe has price loitering south of Quasimodo resistance at 0.7784. This follow’s Monday’s near-test of support at 0.7655. An advance beyond 0.7784 shines the technical spotlight on Quasimodo resistance at 0.7893.
Areas of consideration:
- 78 and the surrounding H4 resistances (0.7810/0.7791), on top of daily Quasimodo resistance at 0.7784, could prove difficult for buyers, despite weekly price exhibiting scope to climb further.
- 77 round number support could make an appearance today, bolstered by January’s opening value from 0.7701 (H4).
- Moves above 0.7810 (H4) may fuel a breakout scenario, targeting 7873, whereas pushing through 0.77 underlines possible movement towards 0.7639.
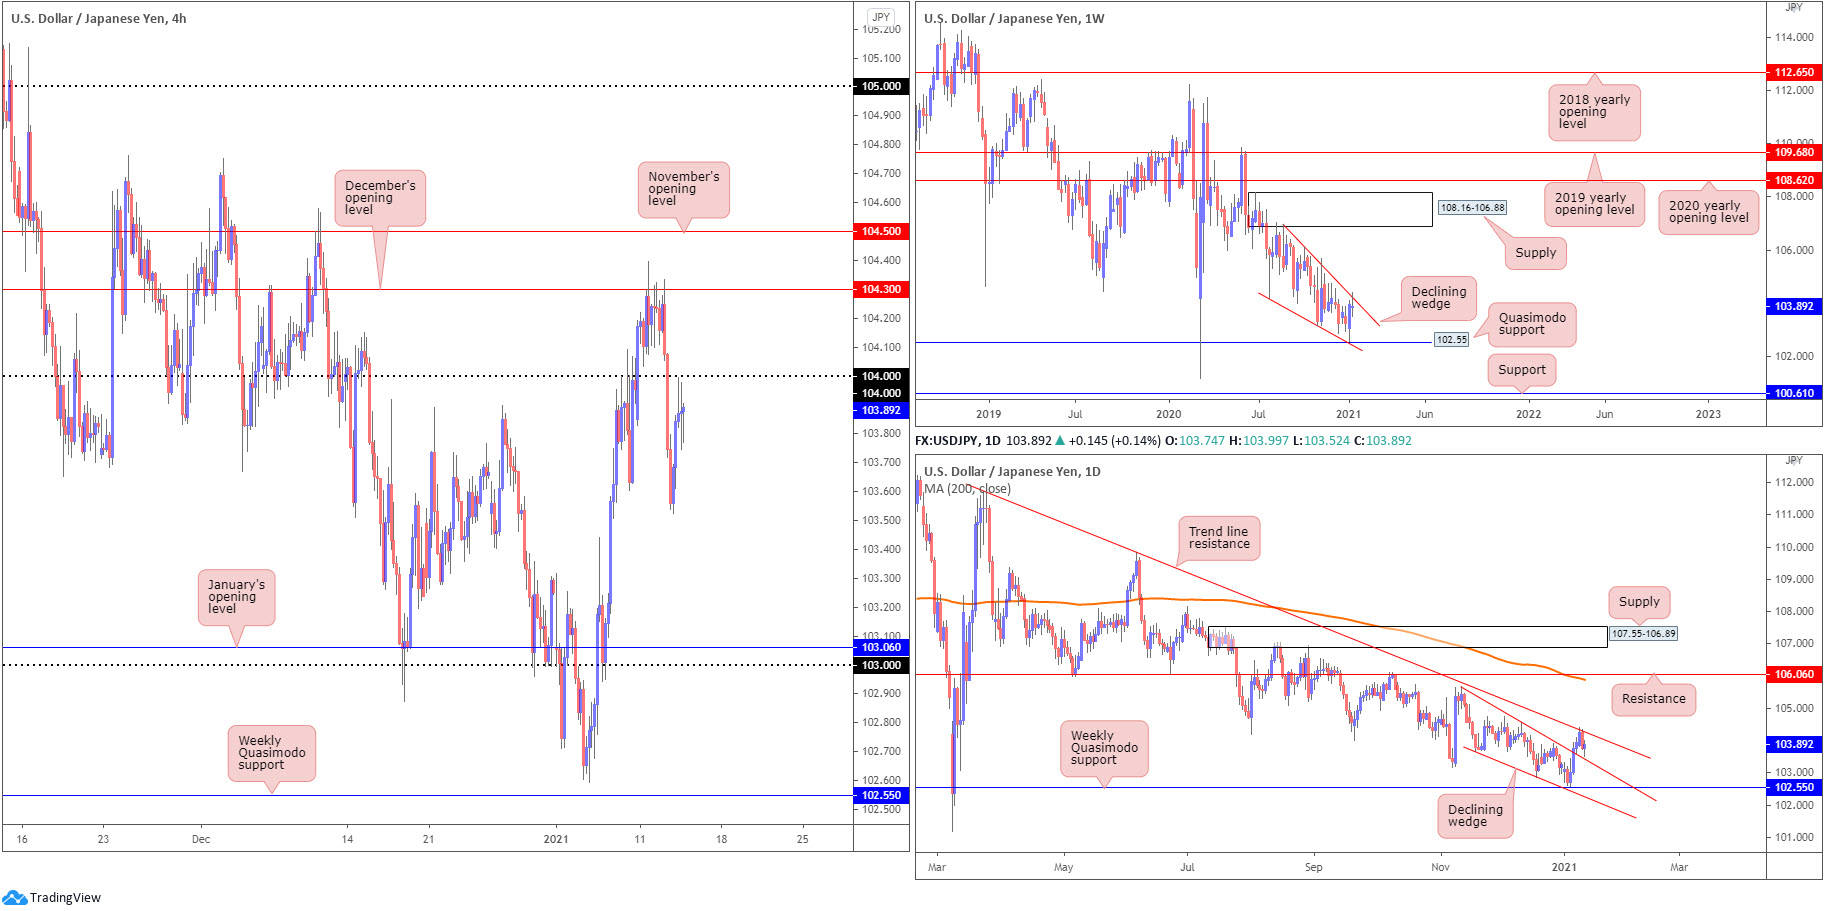
USD/JPY:
Top-down analysis reveals weekly price recently shook hands with the upper edge of a declining wedge pattern, taken from the high 106.94. With room to press lower from here, this may see traders zone in on Quasimodo support at 102.55.
Action out of the daily timeframe also recently had price cross swords with trend line resistance, extended from the high 111.71. Downside support resides around the upper boundary of a recently penetrated declining wedge, taken from the high 105.67.
Finally, H4 structure powered through the 104 figure on Tuesday, following strong selling from December’s opening value at 104.30. Wednesday’s pullback from 103.52, in lockstep with the US dollar index, has placed 104 within touching distance today as a possible resistance level.
Areas of consideration:
- Room for both weekly and daily timeframes to press lower could have H4 sellers defend 104 today. Conservative sellers, however, will likely insist on additional bearish candlestick confirmation before committing. Downside targets rest around yesterday’s low 103.52, followed by January’s opening value at 103.06 and the 103 figure.
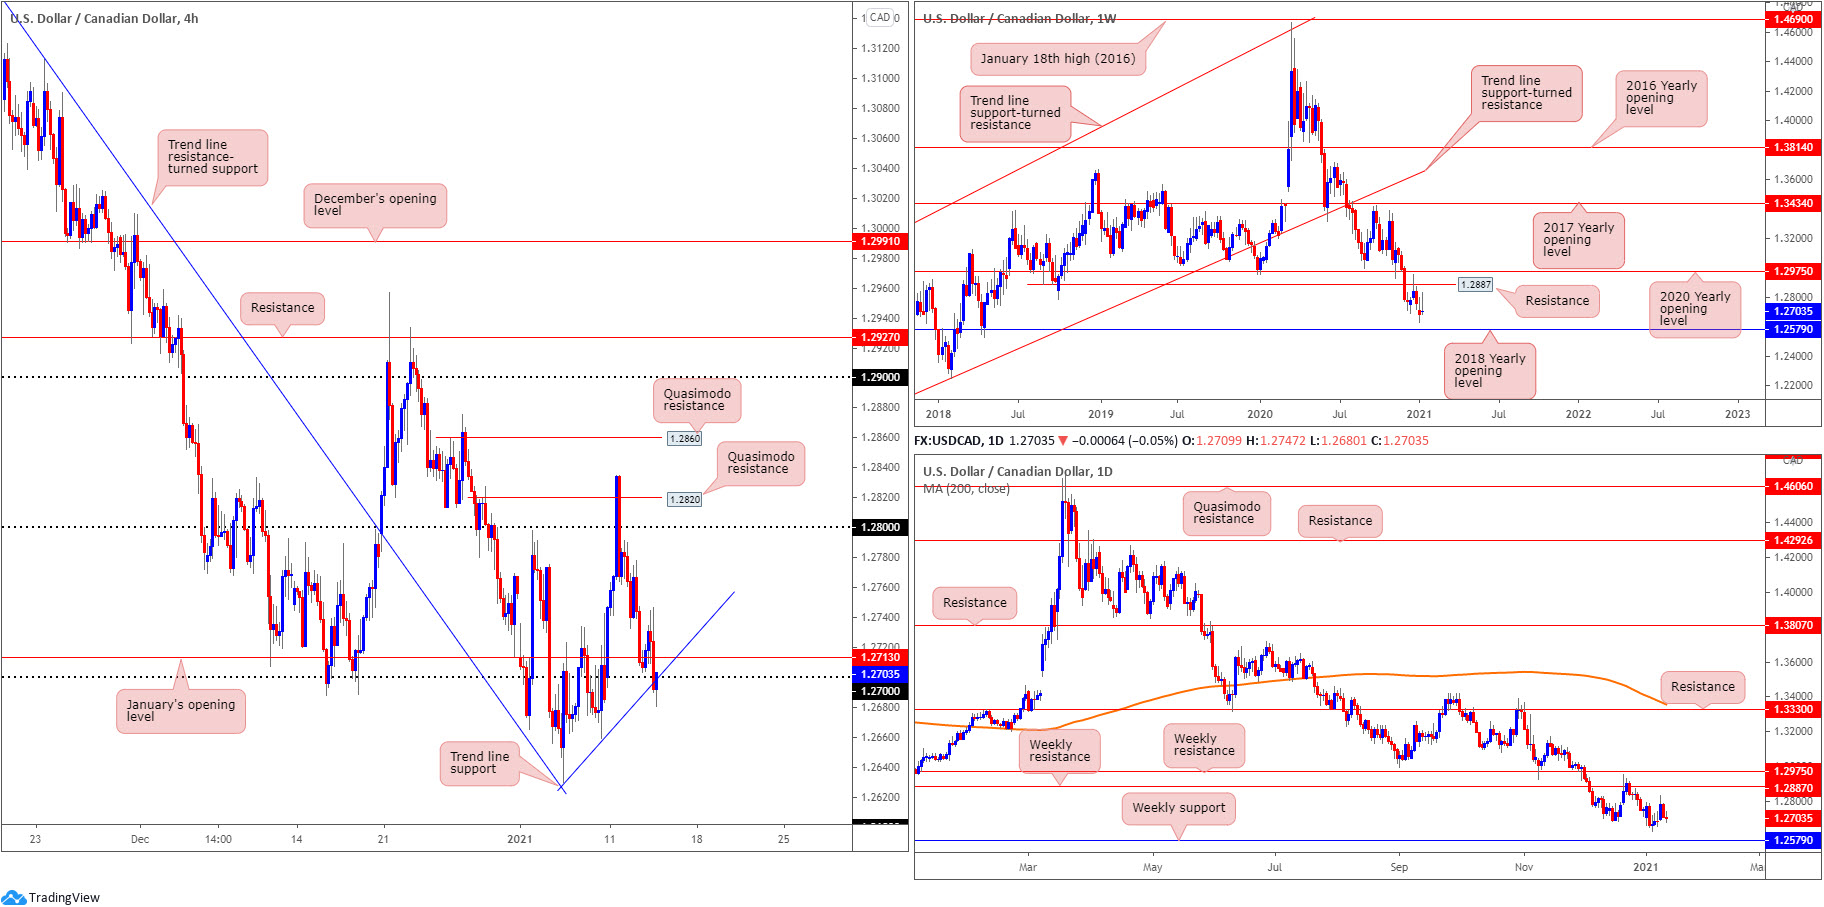
USD/CAD:
The longer-term landscape on USD/CAD remains unchanged.
Below is where we left Wednesday’s technical briefing (italics):
According to longer-term charts (weekly timeframe), this week’s action trades significantly off best levels. Technically, this was expected, particularly after early December obliterated the 2020 yearly opening value at 1.2975 and Quasimodo support at 1.2887. With 1.2887 serving as resistance heading into the close of 2020, this seats the 2018 yearly opening value at 1.2579 in the firing line. Also important to note is that long-term flow (trend) has been pointing lower since topping in March (2020).
The daily chart’s technical picture pretty much resembles that of the weekly timeframe: weekly resistance at 1.2887 and weekly support plotted at 1.2579.
January’s opening value from 1.2713 served as support in early trading Wednesday, though struggled to overcome 1.2730. This led to the 1.27 figure and associated trend line support, taken from the multi-month low 1.2630, suffering a breach in recent hours.
Pushing through trend line support places 1.2630 in sight, with a break shining the spotlight on 1.26, sited just north of weekly support mentioned above at 1.2579.
Areas of consideration:
- Daily and weekly timeframes, according to the technical studies presented above, exhibit bearish posture.
- With the above on board, and H4 currently retesting the underside of 1.27 (and trendline support), a bearish scenario could form to target 1.2630, as well as the 1.26 figure and weekly support at 1.2579.
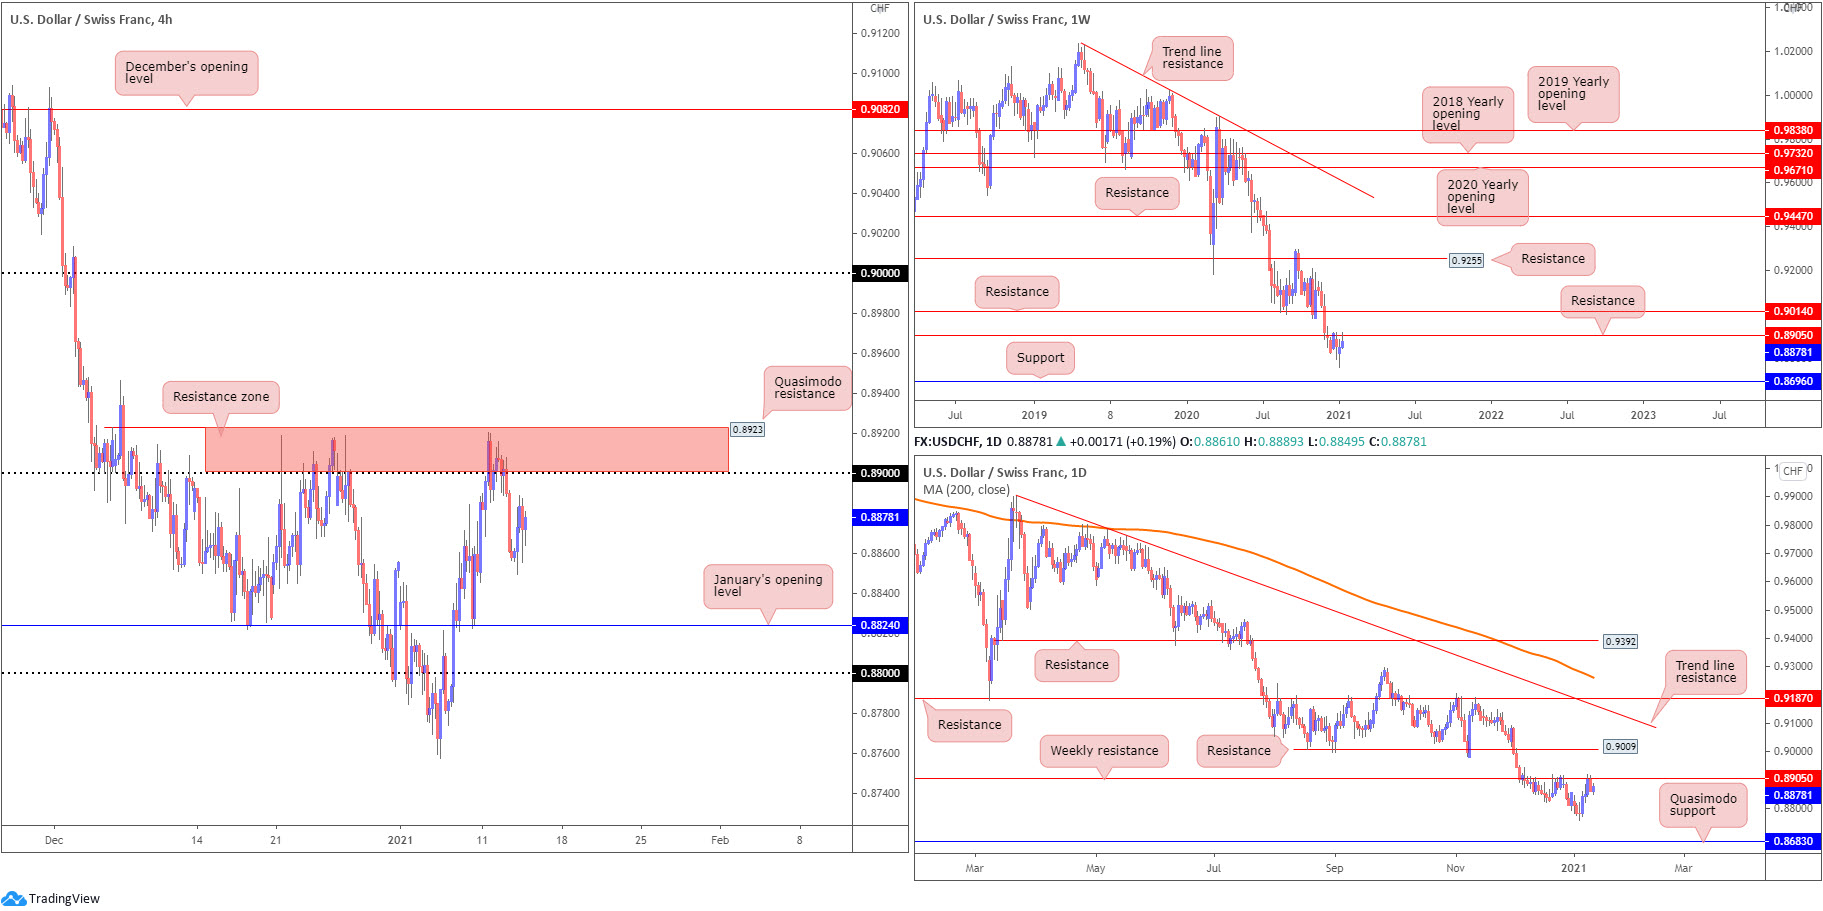
USD/CHF:
Higher timeframe technical structure gracing the USD/CHF pair is interesting.
Not only can traders see the trend facing southbound since April 2019, weekly resistance at 0.8905 also recently stole the spotlight. This – coupled with H4 resistance marked between 0.8923 (Quasimodo resistance) and the 0.89 figure (red zone) – is likely to continue to weigh on any upside attempts.
In addition to the above, this throws January’s opening value from 0.8824 and the 0.88 figure in the mix as potential support targets on the H4 scale.
Areas of consideration:
- Having seen room for all three timeframes (H4, daily and weekly) to seek lower terrain, this could prompt a bearish theme should 0.8923/0.89 call for a retest today.
- Leaving the aforementioned resistance zone unchallenged, however, may (as underlined in Wednesday’s technical briefing) also call for traders to drill down to the lower timeframes and pursue short-term trading setups, targeting the 0.88/0.8824ish range (H4).
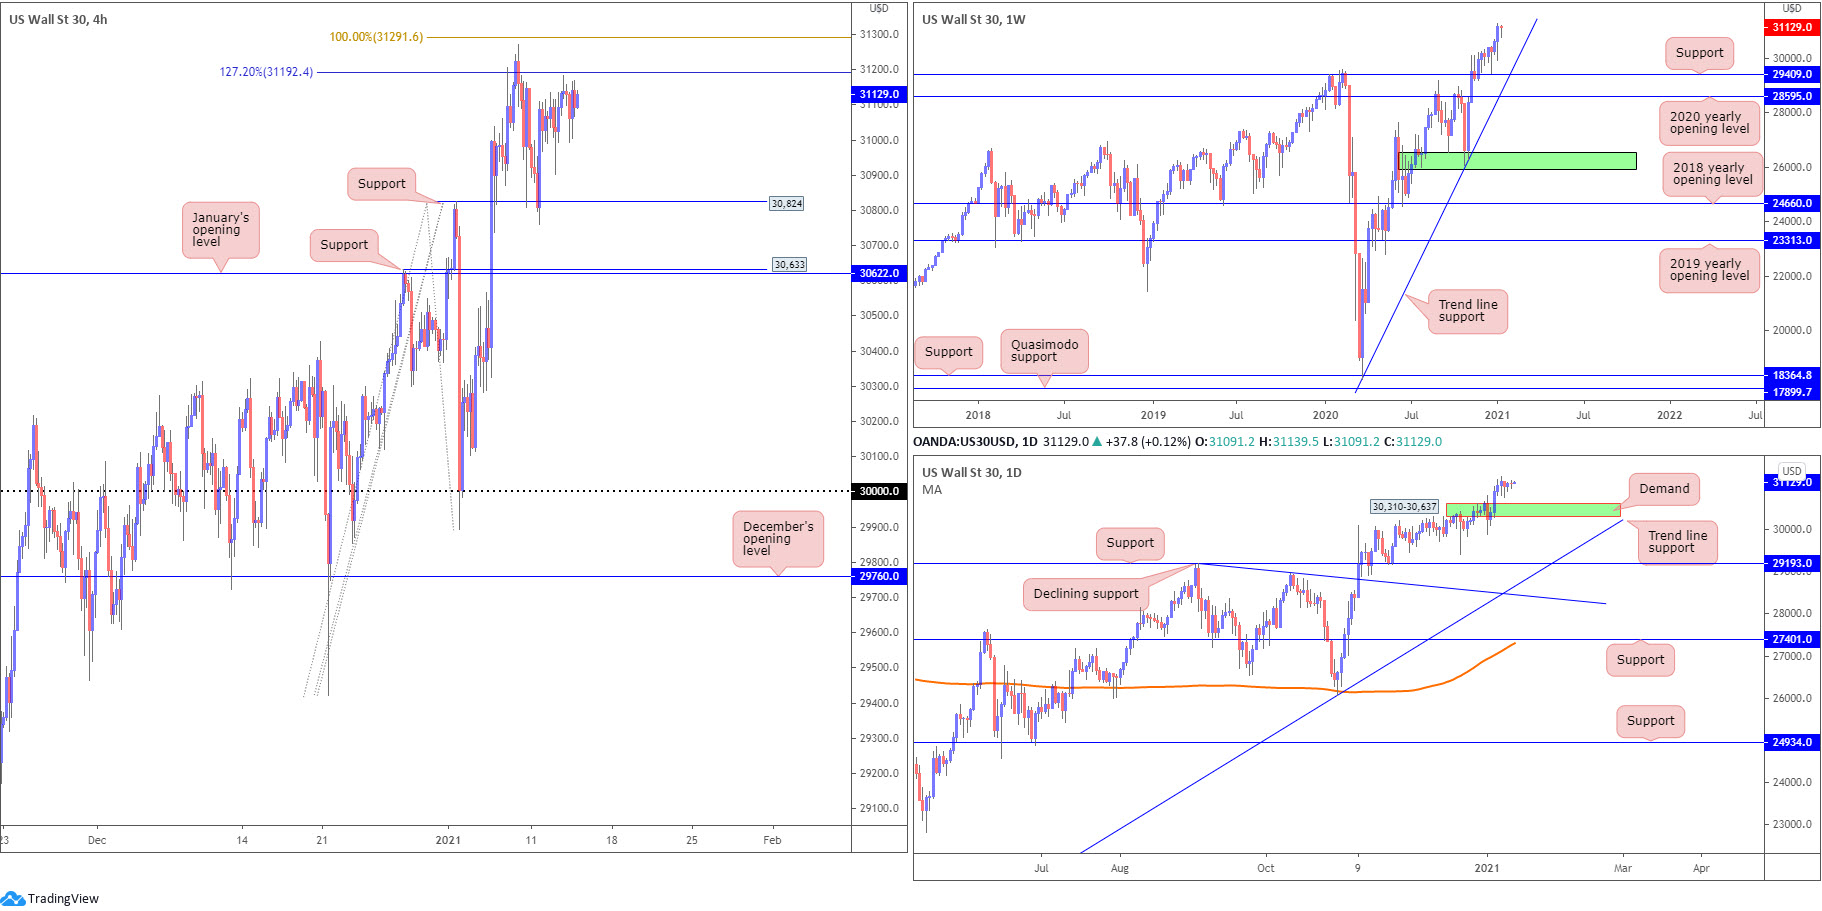
Dow Jones Industrial Average:
US equities settled modestly higher Wednesday, according to major benchmarks, as investors digested impeachment proceedings. The Dow Jones Industrial Average fell 8.22 points, or 0.03%; the S&P 500 advanced 8.65 points, or 0.23% and the Nasdaq advanced 56.52 points, or 0.43%.
Technically, limited change was observed yesterday, therefore much of the following will echo thoughts put forward in Wednesday’s technical briefing.
H4 price reveals the unit remains capped between Fibonacci resistance (127.2% Fibonacci projection point at 31,192/100% Fibonacci extension level at 31,291) and support priced in at 30,824 (swing high). Below here, support resides at 30,633, a previous Quasimodo resistance level that blends with January’s opening value at 30,622.
From the weekly timeframe, the DJIA remains circling all-time peaks at 31,271. Should a correction occur, limited support is in sight until 29,409 (previous Quasimodo resistance), together with nearby trend line support, extended from the low 18,213.
A closer reading of price action on the daily timeframe shows the unit has put forward an indecisive tone since the beginning of the week. If a correction does indeed come to pass, demand is seen at 30,310-30,637.
Areas of consideration:
- H4 support at 30,824.
- H4 resistance (Fibonacci) between 31,192/31,291.
- H4 support at 30,633 and January’s opening value at 30,622, an area plotted within the upper range of daily demand at 30,310-30,637.
- A H4 breakout above 31,291 potentially fuels a bullish breakout theme to refresh all-time peaks.
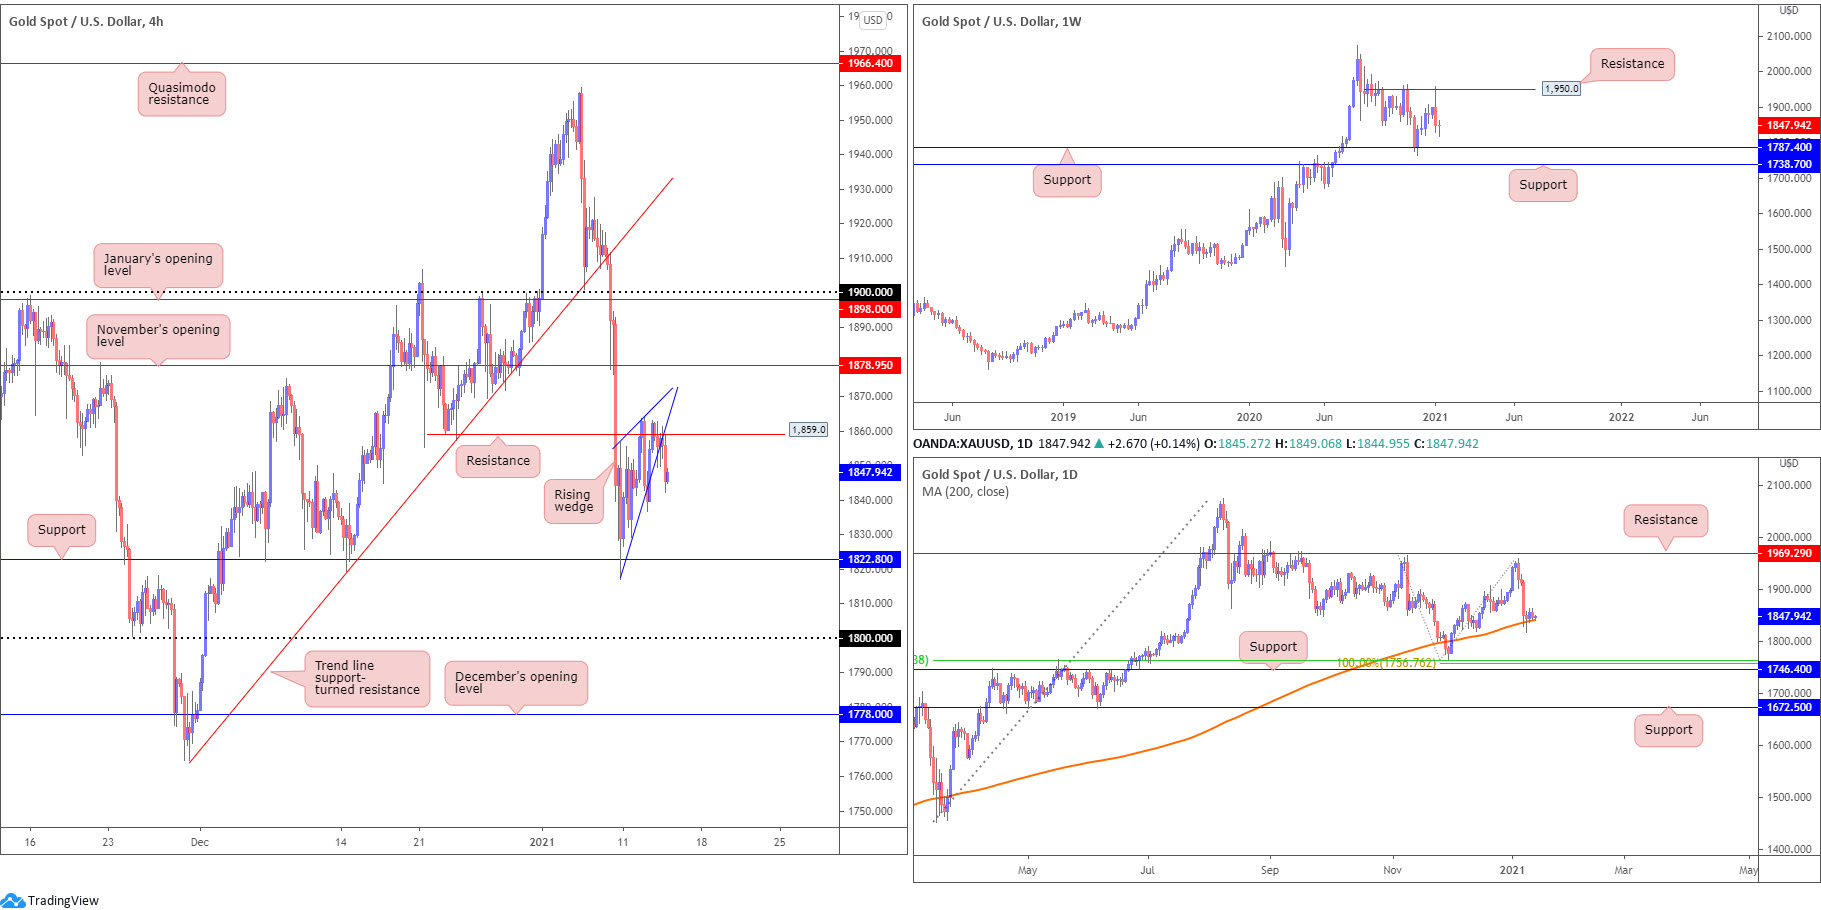
XAU/USD (GOLD):
Top-down analysis shows that although weekly price currently trades off worst levels, last week fell sharply from resistance at $1,950. This implies further selling could develop, targeting support at $1,787, a level plotted just north of another layer of support at $1,738.
Down a step, however, we can see price action on the daily timeframe testing the 200-day SMA (orange – $1,841). Technically speaking, this is likely one of the factors behind the weekly timeframe’s reluctance to reach for support at $1,787.
A closer reading of price action on the H4 timeframe shows the precious metal formed a rising wedge pattern ($1,817/$1,856), with the unit breaking out to the downside yesterday, aided by resistance at $1,859. This could lead to another retest at support drawn from $1,822 today, with a break exposing the $1,800 figure.
Areas of consideration:
- Short-term sellers are likely to look closely at the recent H4 rising wedge breach, with an initial target perhaps set around H4 support at $1,822.
- Failure to hold lower, nevertheless, driven on the back of bullish flow from the 200-day SMA, could have H4 players pursue a bullish theme north of resistance at $1,859, targeting November’s opening value from $1,878.
The accuracy, completeness and timeliness of the information contained on this site cannot be guaranteed. IC Markets does not warranty, guarantee or make any representations, or assume any liability regarding financial results based on the use of the information in the site.
News, views, opinions, recommendations and other information obtained from sources outside of www.icmarkets.com.au, used in this site are believed to be reliable, but we cannot guarantee their accuracy or completeness. All such information is subject to change at any time without notice. IC Markets assumes no responsibility for the content of any linked site.
The fact that such links may exist does not indicate approval or endorsement of any material contained on any linked site. IC Markets is not liable for any harm caused by the transmission, through accessing the services or information on this site, of a computer virus, or other computer code or programming device that might be used to access, delete, damage, disable, disrupt or otherwise impede in any manner, the operation of the site or of any user’s software, hardware, data or property.


