EUR/USD:
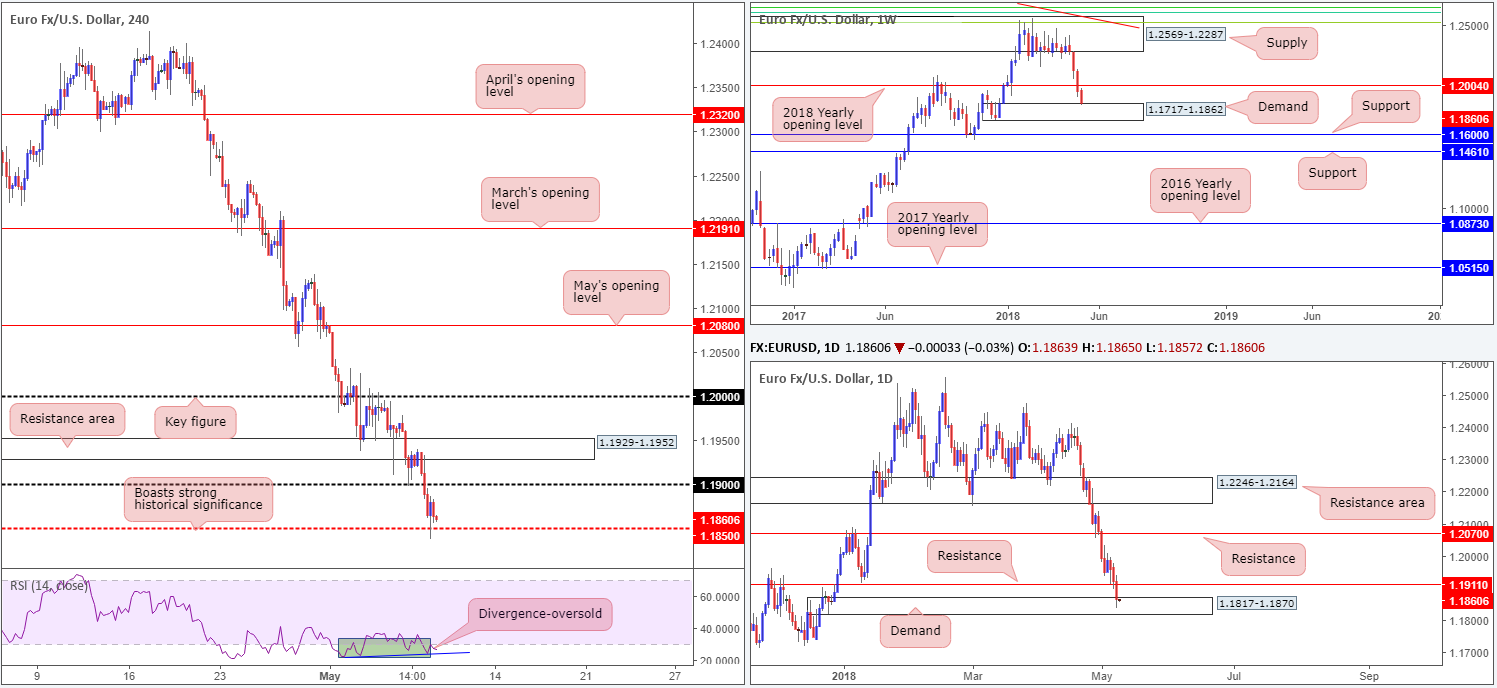
US President Trump confirmed the US is to withdraw from the Iran nuclear deal with the 'highest level' of sanctions to be imposed on Iran. In response, a mild correction to the upside was observed on the EUR/USD.
In regard to the technical picture, however, Tuesday’s movement shows that the 1.19 handle was digested in the early hours of London, permitting the euro to strike fresh 2018 lows and shake hands with a H4 mid-level support at 1.1850: a level that boasts strong historical significance as a support/resistance level. Also worth noting on the H4 scale is that the H4 RSI is currently displaying divergence and oversold readings.
Yesterday’s selling also saw the single currency swallow daily support at 1.1911, and conclude the day connecting with a nearby daily demand base located at 1.1817-1.1870. What’s also noteworthy from a technical perspective is that this daily area happens to be attached to the top edge of a strong-looking weekly demand area currently in motion at 1.1717-1.1862 (note the robust momentum derived from its base).
Potential trading zones:
Technically speaking, the market looks set to eat away at some of its recent losses.
We say this simply because supportive structure is observed across the board in this market right now. As highlighted above, H4 action is seen trading off of a notable mid-level number and both weekly and daily price are situated at demand. Further adding to this, though, the US dollar index is currently toying with the lower edge of a monthly supply at 95.13-92.75, following a sweet bounce off of monthly support at 88.50. This, in our book, adds weight to a potential round of euro buying.
Stop-loss placement from 1.1850s is, as far as we can see, best placed beyond the confines of the current daily demand (below 1.1817).
Upside targets from 1.1850s falls in at 1.19, followed by daily resistance at 1.1911 and a H4 resistance area (which held beautifully during early Asia trade on Tuesday) plotted at 1.1929-1.1952.
Data points to consider today: US PPI m/m.
GBP/USD:
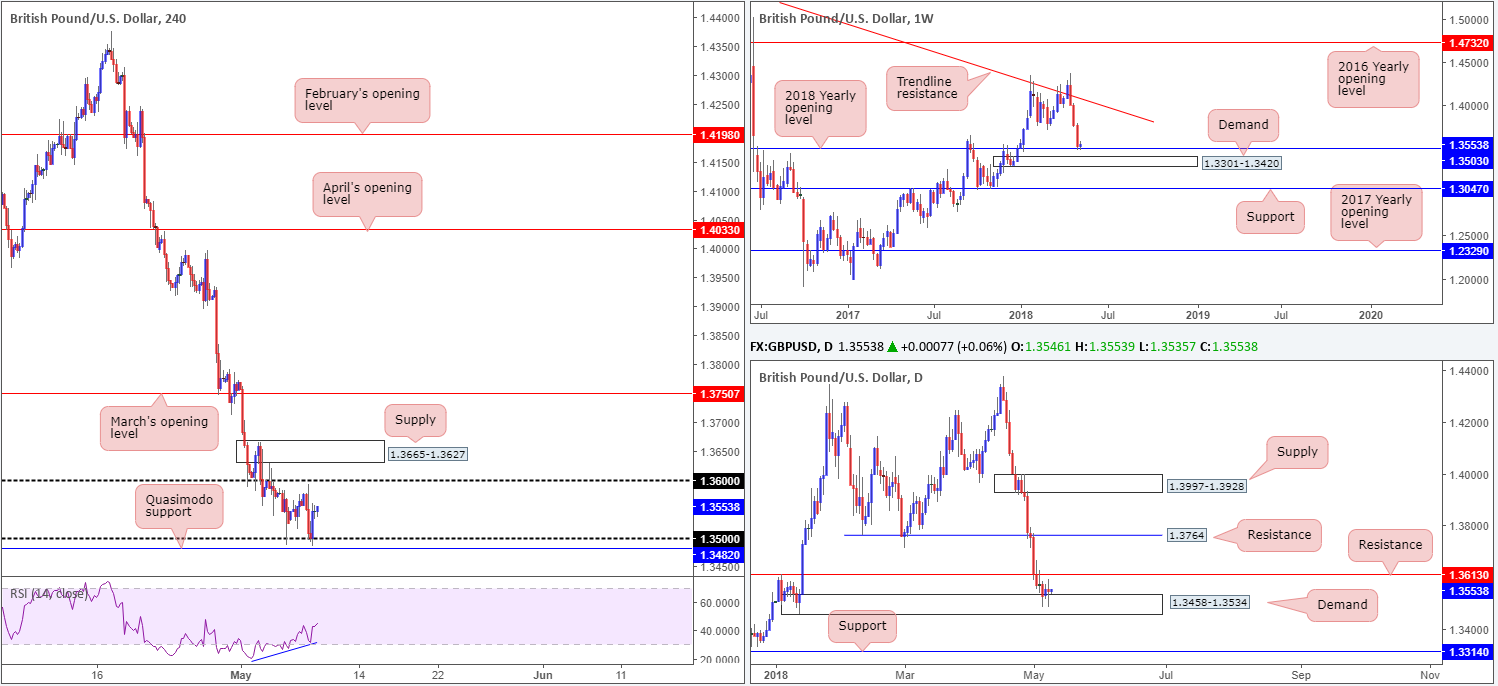
Data out of the UK: Halifax HPI m/m, disappointed on Tuesday, consequently exacerbating intraday downside which in due course saw H4 price connect with the 1.35 vicinity. As you can see, 1.35 held as the market entered US hours, but somewhat stagnated in later trade despite US President Trump confirming the US is to withdraw from the Iran nuclear deal.
For those who read Tuesday’s report, the team highlighted possible buying opportunities off 1.35. This is down to the GBP/USD currently emphasizing strong supportive structure across the board –
Weekly flow, although recorded reasonably steep losses last week, shook hands with a 2018 yearly opening level at 1.3503, which happens to be placed just ahead of a weekly demand base drawn from 1.3301-1.3420. This is further supported by daily demand that surrounds the weekly level at 1.3458-1.3534. Also, let’s not forget that the US dollar index is currently testing the lower edge of a monthly supply at 95.13-92.75, potentially adding weight to a move higher on the GBP/USD.
Potential trading zones:
The move off 1.35 was stronger than expected, which is likely to attract buyers into the market. Stop-loss placement for long positions at current price is best suited below 1.3482: just beneath a H4 Quasimodo support.
Nearby resistance targets fall in at 1.36, daily resistance at 1.3613 and H4 supply at 1.3665-1.3627.
Risk/reward has been somewhat skewed thanks to the larger-than-expected H4 bull candle printed off 1.35, so trade with caution!
Data points to consider today: US PPI m/m.
AUD/USD:
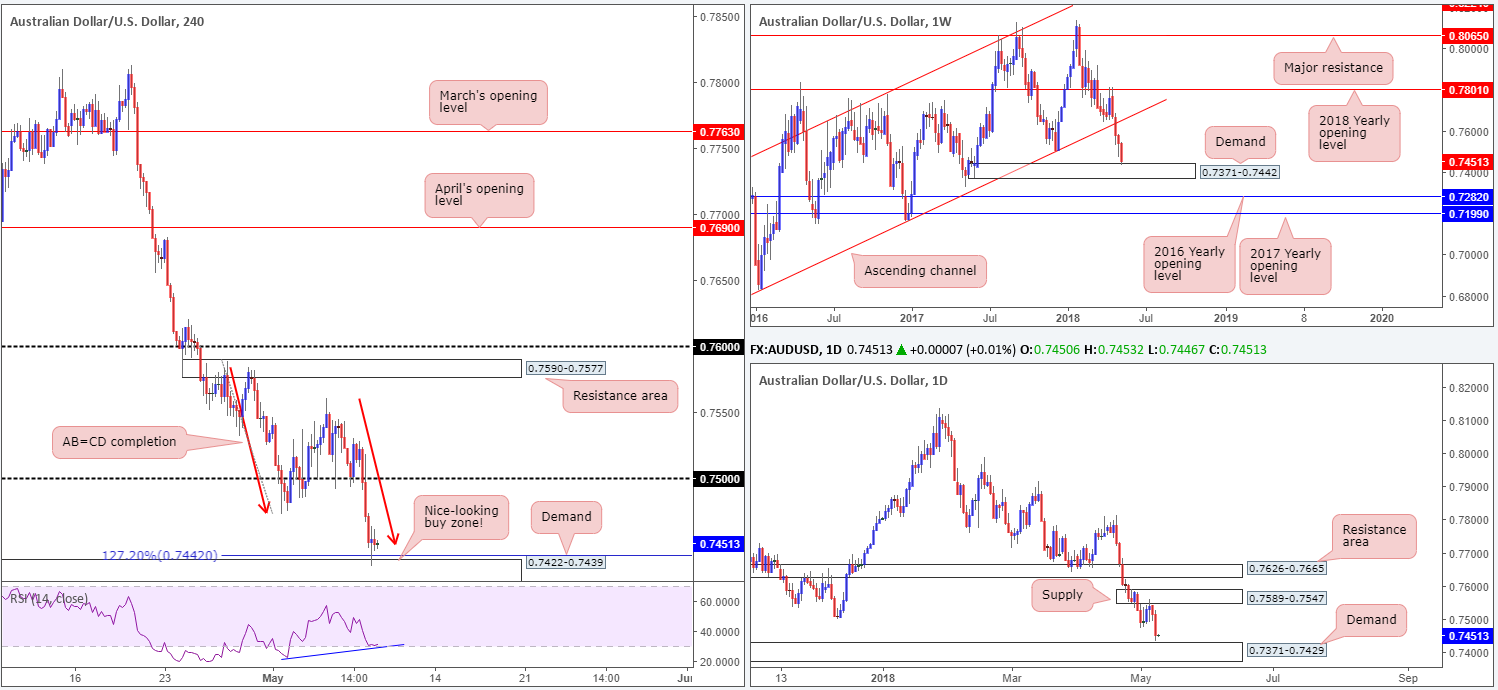
The commodity currency was a clear victim of data disappointment on Tuesday, with Australian retail sales coming in lower than consensus and some fiscal angst surrounding the annual budget. Also weighing on the currency is a robust USD which crossed above the 93.00 marker (US dollar index) in recent movement.
As is shown on the H4 timeframe, 0.75, as expected, was consumed. This gave rise to further downside towards H4 demand positioned at 0.7422-0.7439, which happens to converge beautifully with a H4 AB=CD 127.2% Fib ext. point at 0.7442. Further to this, we can see the H4 RSI indicator exhibiting clear divergence to the upside. Also noteworthy, the current H4 demand area is glued to the top edge of daily demand at 0.7371-0.7429 and also positioned within the top limit of weekly demand at 0.7371-0.7442.
Potential trading zones:
As the H4 demand has strong connections to higher-timeframe structure, along with a sound approach and is bolstered by H4 RSI divergence, the Aussie may attempt to recover from here today.
Stop-loss orders, according to the technicals, are best positioned just beneath the current H4 demand at 0.7420. As for take-profit targets, the 0.75 handle would be considered the first upside hindrance.
Data points to consider today: US PPI m/m.
USD/JPY:
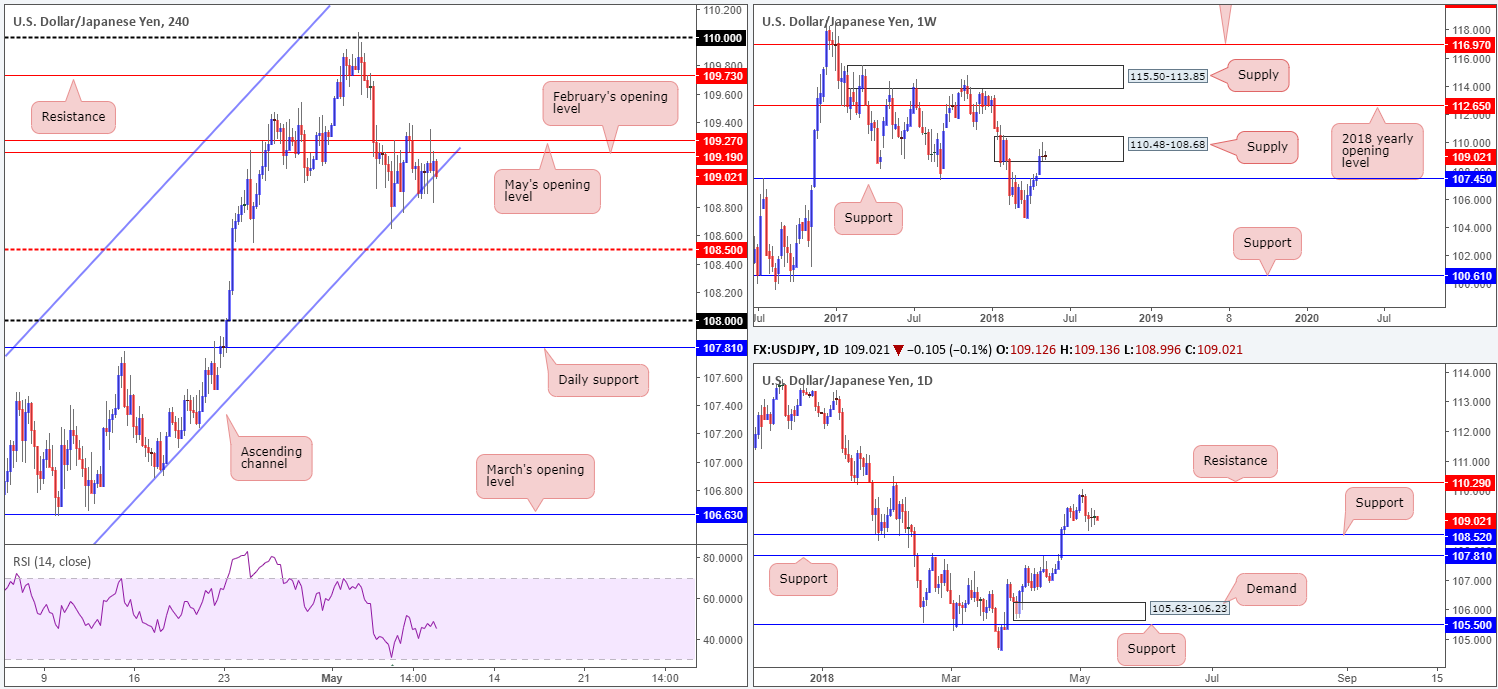
Despite US President Trump confirming the US is to withdraw from the Iran nuclear deal, the USD/JPY wrapped up Tuesday’s session relatively unchanged. As is evident on the H4 timeframe, the pair is currently stapled between a rising channel support extended from the low 104.62 and 109.19/109.27: February and May’s opening levels. A violation to the downside has the H4 mid-level support at 108.50 in view, whereas a move to the upside could approach H4 resistance plotted at 109.73.
Thanks to yesterday’s lackluster performance, much of the following report will echo thoughts put forward in Tuesday’s analysis…
In terms of higher-timeframe structure, daily price penciled in another clear-cut indecision candle as it lingers just north of daily support plotted at 108.52. Higher up on the curve, nevertheless, the weekly candles are seen trading within the walls of a weekly supply zone pictured at 110.48-108.68. As you can see, the pair concluded last week’s trading in the shape of a robust weekly selling wick, also known as a bearish pin-bar formation. Should this attract sellers into the market this week, traders will likely have their crosshairs pinned on weekly support drawn from 107.45.
Potential trading zones:
A break of the current H4 channel support is likely, in our assessment. Overhead pressure coming in from the weekly timeframe may force the unit down to the H4 mid-level support 108.50, which, as you can probably see, aligns beautifully with daily support mentioned above at 108.52. Unfortunately, this does not leave much wiggle room to trade short. In fact, by the time H4 price closes below the H4 channel support, there will likely be less than 20 pips to play with.
Long positions from 108.50 could be an option. Though, at this point, traders would be effectively be buying into potential weekly flow as weekly price likely has its eye on weekly support at 107.45.
Trade with caution.
Data points to consider today: US PPI m/m.
USD/CAD:
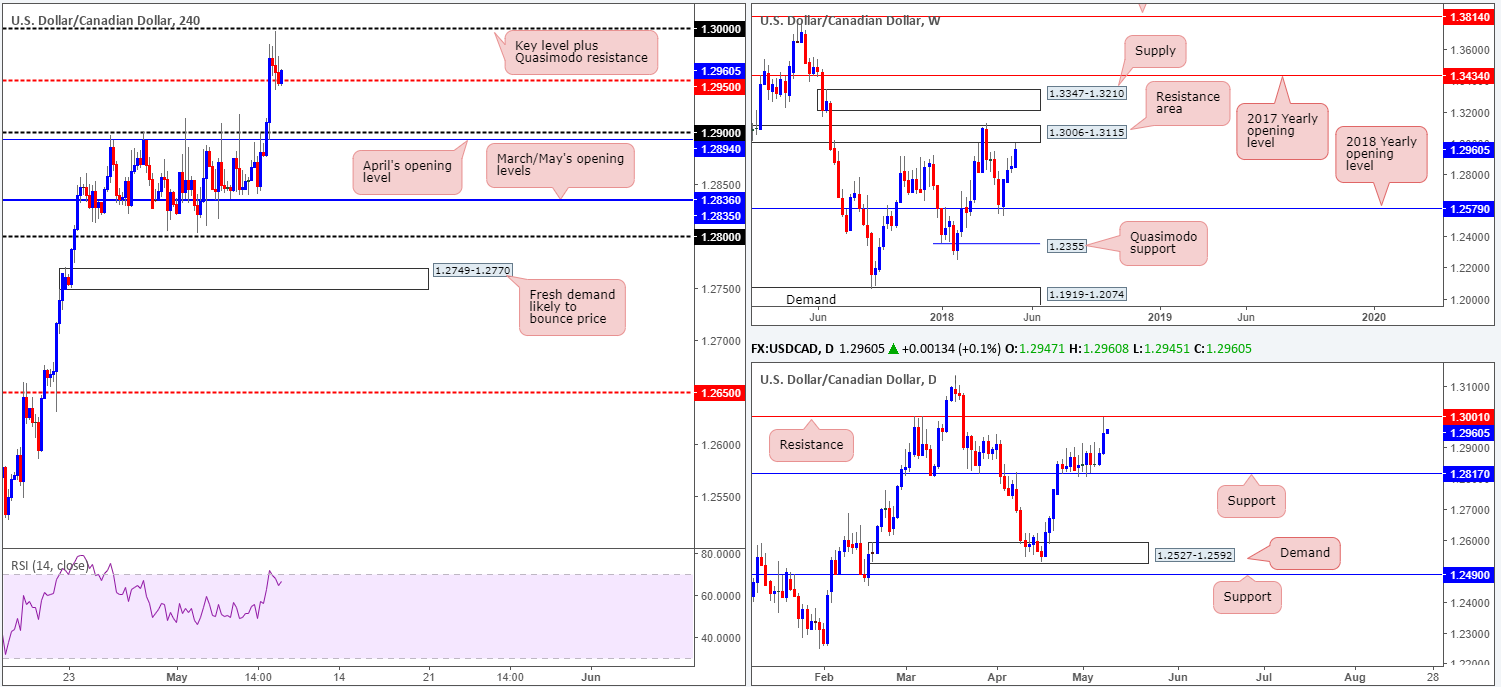
In recent sessions, the USD/CAD struck fresh multi-week highs above 1.2950 to reach 1.2997 amidst more NAFTA talk highlighting progress, and following weaker-than-forecast Canadian housing starts data.
From a structural standpoint, H4 price came within a few pips of connecting with the key figure 1.30, which intersects nicely with a H4 Quasimodo resistance taken from early March, before mildly pulling back during US trade. The H4 mid-level support at 1.2950 is currently seen providing support to the market in the short term.
Longer term, however, we can see that price topped just south of a weekly resistance area at 1.3006-1.3115 and nearby daily resistance at 1.3001. The next downside target on the bigger picture falls in at 1.2817: a daily support level.
Potential trading zones:
On account of the noted resistances across the board, the team feels further downside could be on the cards. A break beyond 1.2950, therefore, could be taken as a cue to begin looking for intraday shorts, with an initial target objective set at 1.29. Although daily price shows downside free until we reach 1.2817, we anticipate bullish interest off of 1.29 having seen how well it held as resistance in recent trade. Therefore, should you pin down a short beyond 1.2950, consider locking in some profits at 1.29 and, if feasible, reducing risk to breakeven.
Data points to consider today: US PPI m/m; Canadian building permits m/m.
USD/CHF:
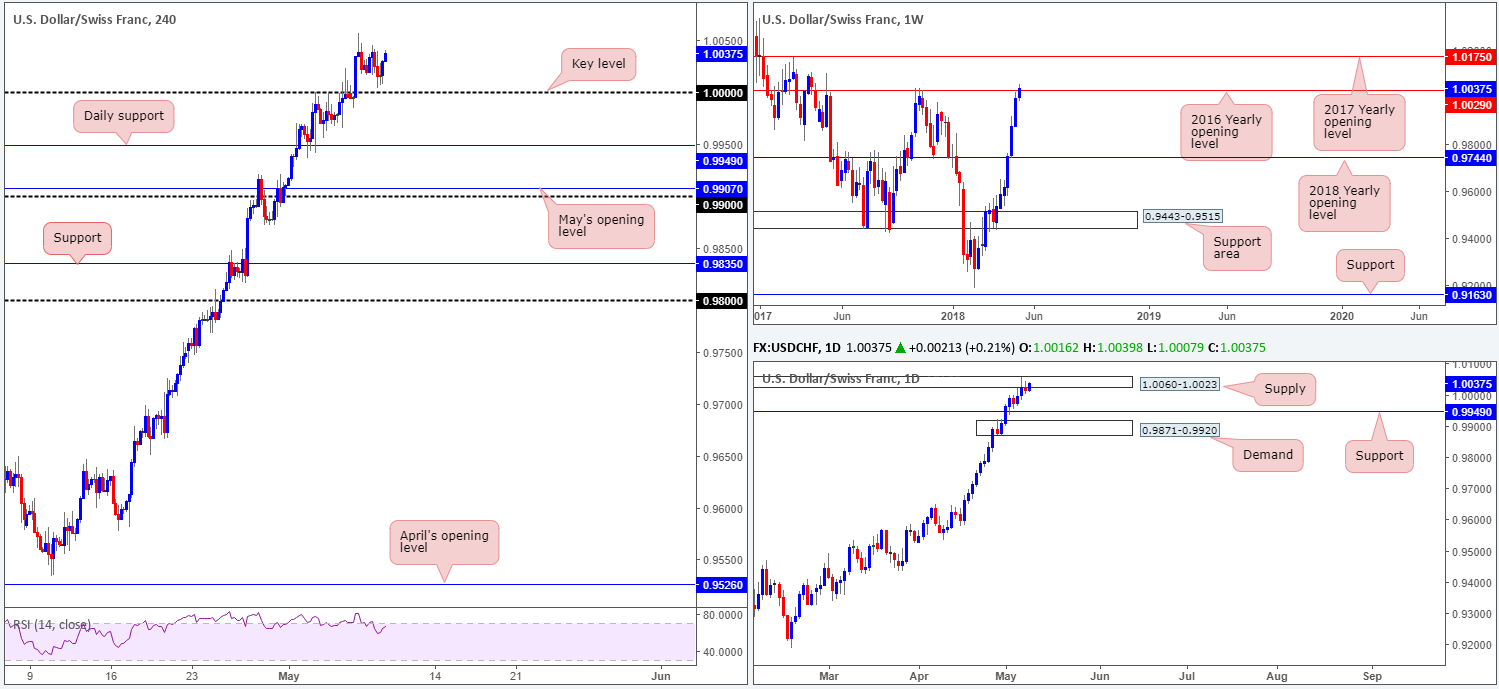
On the whole, this market’s structure remained unchanged over the course of Tuesday’s trade, ranging 40 pips on the day. Given this, our outlook remains identical to yesterdays…
In light of recent movement, a large portion of traders are understandably looking to 1.0000 to hold as support for a possible retest play to the upside. While we agree that sentiment is strong, concern over where the market is positioned on the bigger picture remains a weak point for prospective buyers.
Thanks to last week’s strong bout of buying, weekly price recently bumped heads with the 2016 yearly opening level seen at 1.0029. This is not a level one should overlook! Check out the clean rejection formed on October 2017 which dropped price in excess of 800 pips! Turning the focus over to the daily timeframe, we can clearly see daily supply carved from 1.0060-1.0023 is also in play (encapsulates current weekly level).
Potential trading zones:
1.0000 is likely to play a key role in trade today.
A retest of 1.0000 as support is appealing, despite higher-timeframe concern. Should one witness a H4 full or near-full-bodied bullish rotation candle drawn from here, then we believe longs could be a consideration.
If you’re somewhat nervous at the sight of the current higher-timeframe structure, nevertheless, waiting and seeing if 1.0000 can be taken out could be the way forward. A retest following the break is, according to the technical arrangement, a strong sell signal, targeting daily support as an initial take-profit zone at 0.9949.
Data points to consider today: US PPI m/m.
DOW 30:
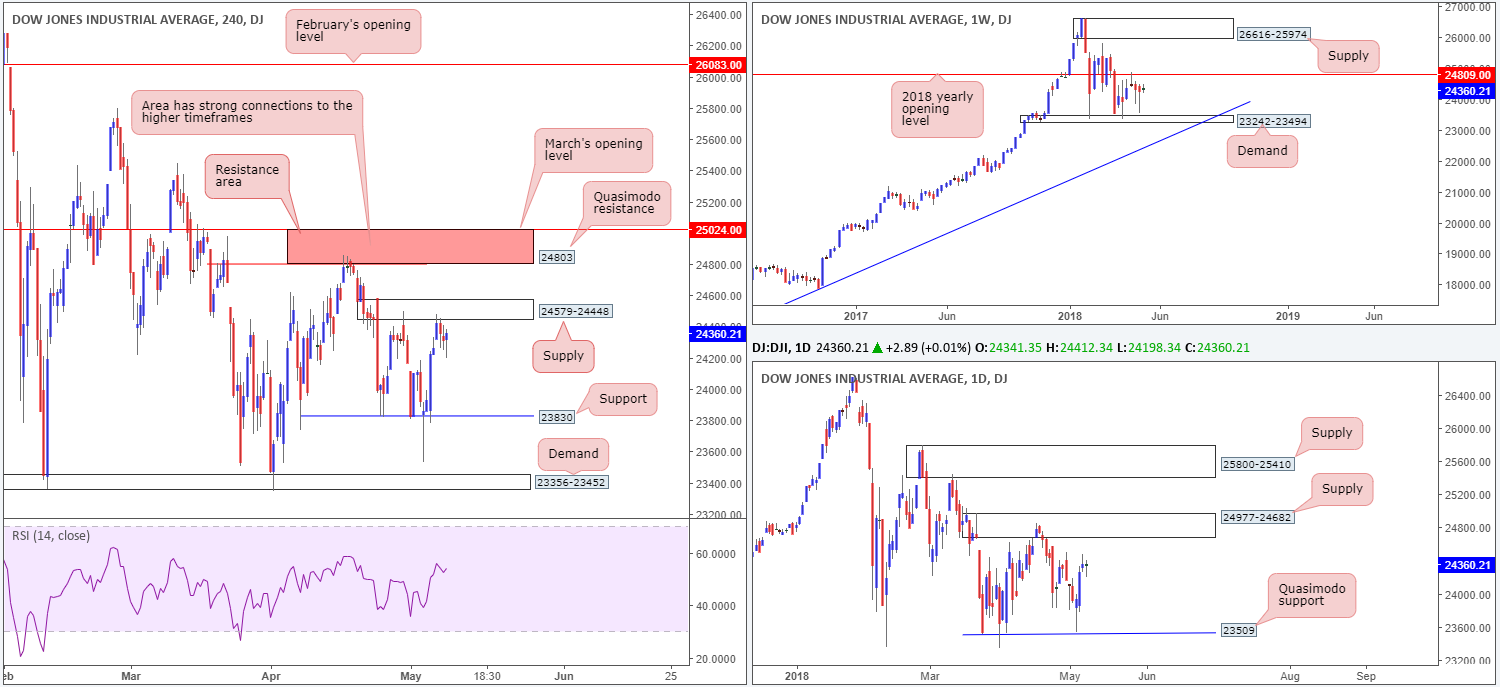
US equities largely traded in a sideways fashion on Tuesday, despite US President Trump confirming the US is to pull out of the Iran nuclear deal, along with Fed’s Chair Powell noting the market is reasonably well aligned with the Fed dot plot.
The H4 candles remain capped beneath H4 supply marked at 24579-24448. This area, as visible on the chart, has already proven its value (see April 30) and therefore could potentially send prices lower once more. Regardless of this, the area we have our eye on right now is the H4 resistance zone marked in red from 25024/24803 (comprised of March’s opening level and a H4 Quasimodo resistance). The reason behind this comes down to its connections with daily supply noted at 24977-24682,and also due to the H4 zone housing the 2018 yearly opening level at 24809 seen on the weekly timeframe.
Potential trading zones:
Having seen the confluence surrounding the current H4 resistance area, shorting from the H4 supply below it at 24579-24448 might not be the best path to take.
As a result, traders may want to consider placing alerts for potential sell trades at the underside of the H4 resistance area. Stop-loss orders, technically speaking, would be best placed above 25024, clearing not only the top edge of daily supply but also the H4 resistance zone as well.
Data points to consider today: US PPI m/m.
GOLD:
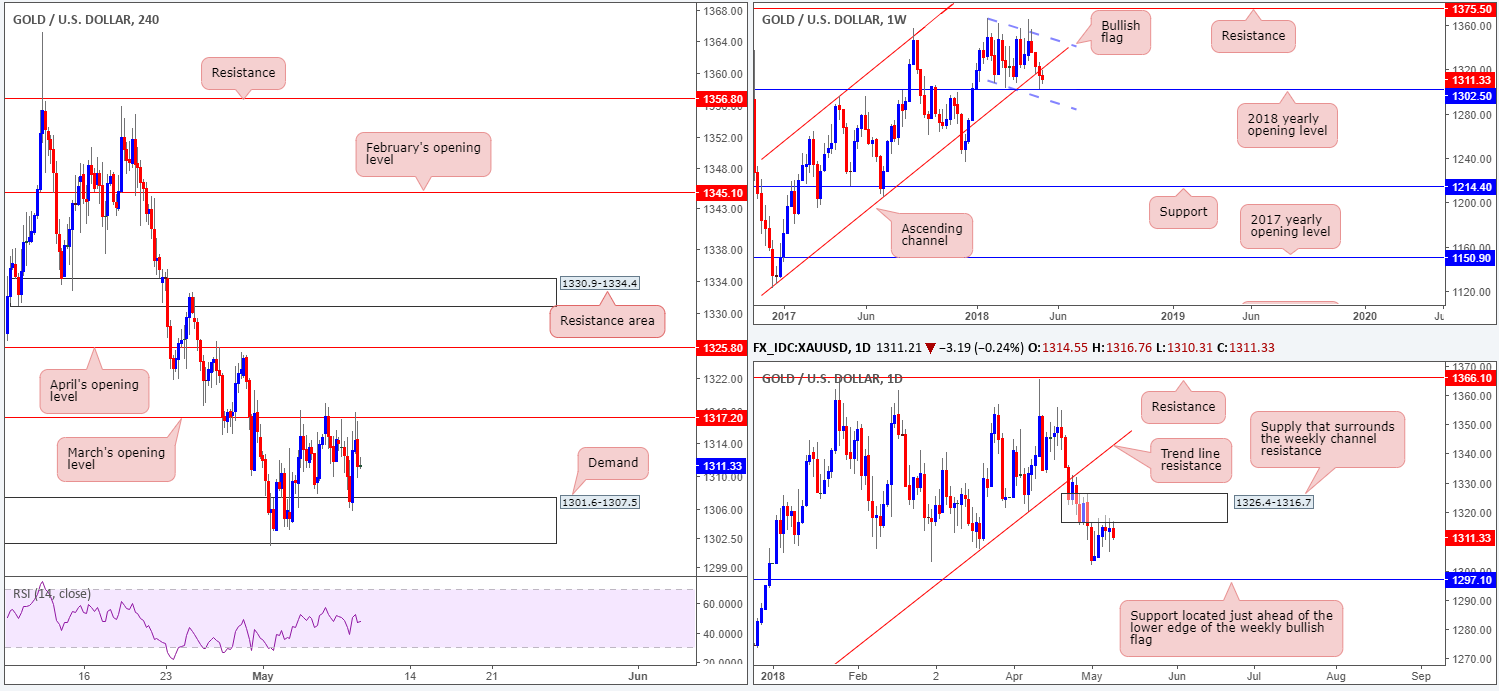
In response to US President Trump withdrawing from the Iran nuclear deal, the price of gold initially climbed higher. The move, nevertheless, was a relatively short-lived one as sellers shielded March’s opening level seen on the H4 timeframe at 1317.2 (seen positioned within the lower limit of daily supply at 1326.4-1316.7, which itself surrounds the weekly channel support taken from the low 1302.5). As you can see, since the beginning of the month the H4 candles have been oscillating amid H4 demand at 1301.6-1307.5, and the aforementioned monthly open barrier.
A violation of March’s band may call for a move towards April’s opening level plotted at 1325.8; whereas a move below the current H4 demand has daily support at 1297.1 in sight (happens to be located just ahead of the lower edge of the weekly bullish flag taken from the low 1307.2).
Given that the current daily supply surrounds the weekly channel resistance, this is considered a significant area.
A push above March’s opening level (located within the lower limit of the current daily supply) is possible since April’s opening barrier (the next upside target on the H4 scale) is also positioned within the noted daily supply, only around the upper limit of the area.
Potential trading zones:
Selling from the aforementioned daily supply seems the more logical route at the moment, in view of its connection to weekly structure. However, H4 players may struggle to short here – the H4 demand mentioned above at 1301.6-1307.5 leaves little room for the sellers to stretch their legs! Given this, the team has noted to look for H4 price to break higher and test April’s opening level for possible shorting opportunities. That way, H4 price should have room to work and bring prices lower.
Stop-loss orders are best positioned above the daily supply (1326.4). Conservative traders, on the other hand, may want to consider waiting for a H4 bearish rotation candle (preferably a full-bodied formation) to form before pulling the trigger.
This site has been designed for informational and educational purposes only and does not constitute an offer to sell nor a solicitation of an offer to buy any products which may be referenced upon the site. The services and information provided through this site are for personal, non-commercial, educational use and display. IC Markets does not provide personal trading advice through this site and does not represent that the products or services discussed are suitable for any trader. Traders are advised not to rely on any information contained in the site in the process of making a fully informed decision.
This site may include market analysis. All ideas, opinions, and/or forecasts, expressed or implied herein, information, charts or examples contained in the lessons, are for informational and educational purposes only and should not be construed as a recommendation to invest, trade, and/or speculate in the markets. Any trades, and/or speculations made in light of the ideas, opinions, and/or forecasts, expressed or implied herein, are committed at your own risk, financial or otherwise.
The use of the site is agreement that the site is for informational and educational purposes only and does not constitute advice in any form in the furtherance of any trade or trading decisions.
The accuracy, completeness and timeliness of the information contained on this site cannot be guaranteed. IC Markets does not warranty, guarantee or make any representations, or assume any liability with regard to financial results based on the use of the information in the site.
News, views, opinions, recommendations and other information obtained from sources outside of www.icmarkets.com.au, used in this site are believed to be reliable, but we cannot guarantee their accuracy or completeness. All such information is subject to change at any time without notice. IC Markets assumes no responsibility for the content of any linked site. The fact that such links may exist does not indicate approval or endorsement of any material contained on any linked site.
IC Markets is not liable for any harm caused by the transmission, through accessing the services or information on this site, of a computer virus, or other computer code or programming device that might be used to access, delete, damage, disable, disrupt or otherwise impede in any manner, the operation of the site or of any user’s software, hardware, data or property.