Wednesday 7th June: Technical outlook and review.
Waiting for lower timeframe confirmation is our main tool to confirm strength within higher timeframe zones, and has really been the key to our trading success. It takes a little time to understand the subtle nuances, however, as each trade is never the same, but once you master the rhythm so to speak, you will be saved from countless unnecessary losing trades. The following is a list of what we look for:
· A break/retest of supply or demand dependent on which way you’re trading.
· A trendline break/retest.
· Buying/selling tails/wicks – essentially we look for a cluster of very obvious spikes off of lower timeframe support and resistance levels within the higher timeframe zone.
· Candlestick patterns. We tend to stick with pin bars and engulfing bars as these have proven to be the most effective.
We typically search for lower-timeframe confirmation between the M15 and H1 timeframes, since most of our higher-timeframe areas begin with the H4. Stops are usually placed 1-3 pips beyond confirming structures.
EUR/USD:
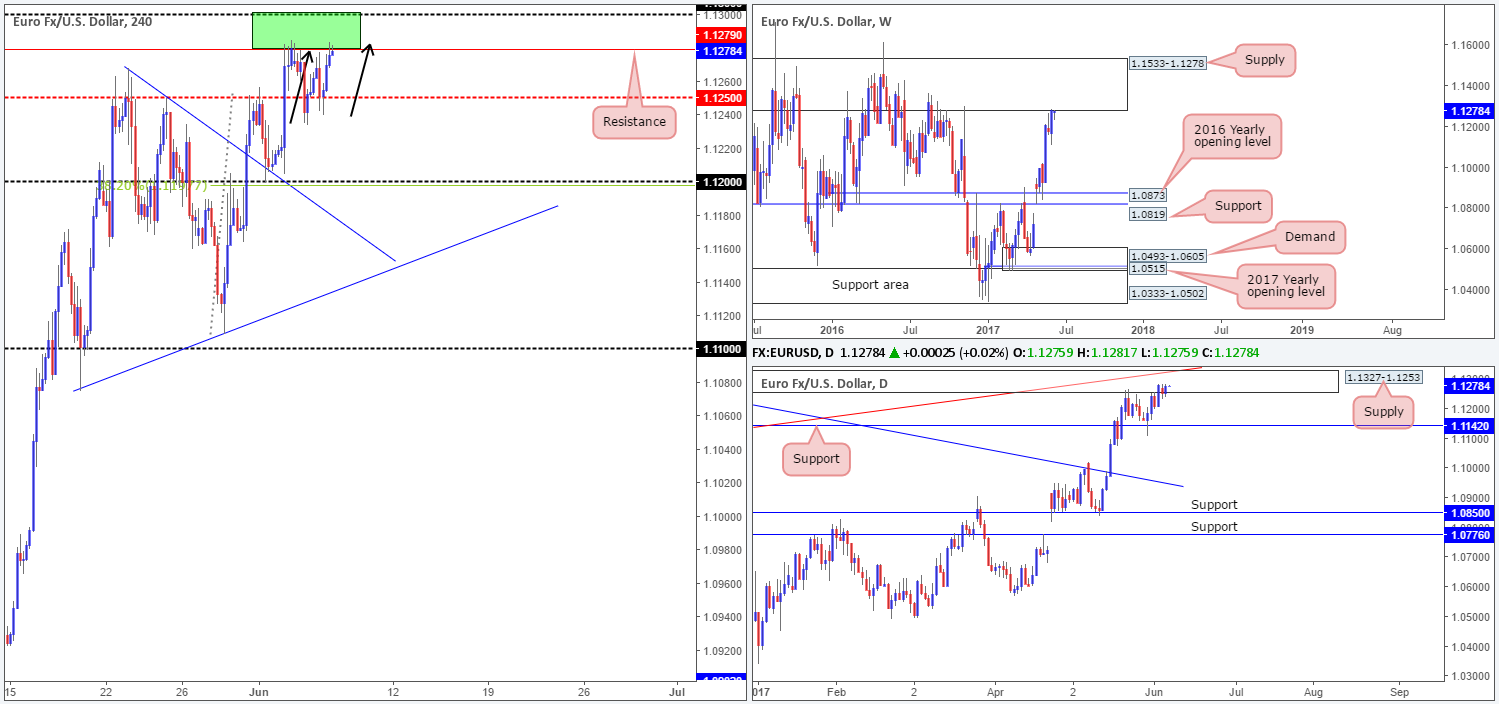
In recent trading, we have seen the EUR/USD bulls go on the offensive. This brought the H4 candles back up to the 1.13/1.1279 H4 area, which, from our perspective, has potential to bounce price again. As mentioned in previous reports, we like this zone because it has formed within both weekly and daily supplies (1.1533-1.1278/1.1327-1.1253). Also of interest is the H4 approach to this area. Notice that there’s an AB=CD bearish pattern completion at 1.1283.
Our suggestions: Unfortunately our team missed the sell from 1.13/1.1279 on Monday. Nevertheless, given the H4 approach and the clear higher-timeframe supplies now in play, our team has taken a short from 1.1282, and positioned a stop-loss order a few pips above 1.13.
Our initial target is the H4 mid-level support at 1.1250, followed by the 1.12 handle, and then possibly daily support coming in at 1.1142.
Data points to consider: No high-impacting news on the docket today.
Levels to watch/live orders:
· Buys: Flat (stop loss: N/A).
· Sells: 1.1282 ([live] stop loss: 1.1302).
GBP/USD:
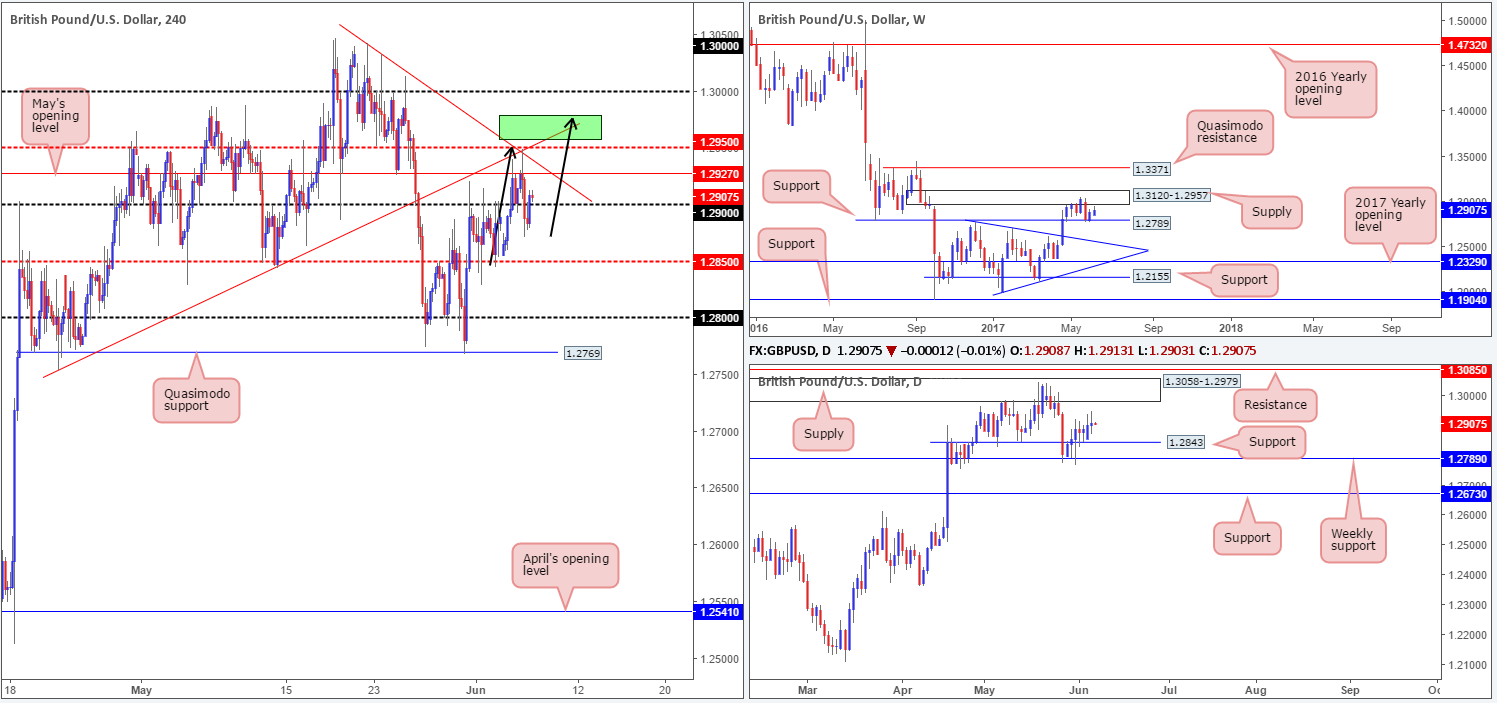
GBP/USD prices are effectively unchanged this morning. From the weekly scale the pair came within striking distance of testing the supply pegged at 1.3120-1.2957. In the event that the market moves lower from here, the next downside target in view can be seen at 1.2789 (support).
Bouncing down to the daily timeframe, yesterday’s segment printed a clear-cut indecision candle between supply logged at 1.3058-1.2979 and support seen at 1.2843. Notice also that the daily supply is lodged within the walls of the said weekly supply.
Looking over to the H4 candles, we can see that price recently bounced (almost to-the-pip) from the mid-level resistance at 1.2950. This barrier, as you can see, intersected with two trendline resistances (1.3042/1.2754). With price seen trading back above 1.29 right now, there’s not a lot of leg room for the bulls to dance. May’s opening level is seen lurking just above at 1.2927, followed closely by the 1.2950 base we just mentioned.
Our suggestions: Right now, the only area that sparks any interest is 1.2957/1.2979 (the underside of both the weekly and daily supplies marked in green on the H4 chart). However, our desk has noted that to trade this zone, a reasonably sized H4 bearish candle would need to form from here, preferably a full-bodied candle. This is simply because there’s a large psychological number 1.30 lurking just above, which has ‘trade me’ written all over it.
Data points to consider: No high-impacting news on the docket today.
Levels to watch/live orders:
· Buys: Flat (stop loss: N/A).
· Sells: 1.2957/1.2979 ([waiting for a reasonably sized H4 bear candle – preferably a full-bodied candle – to form before pulling the trigger is advised] stop loss: ideally beyond the candle’s wick).
AUD/USD:
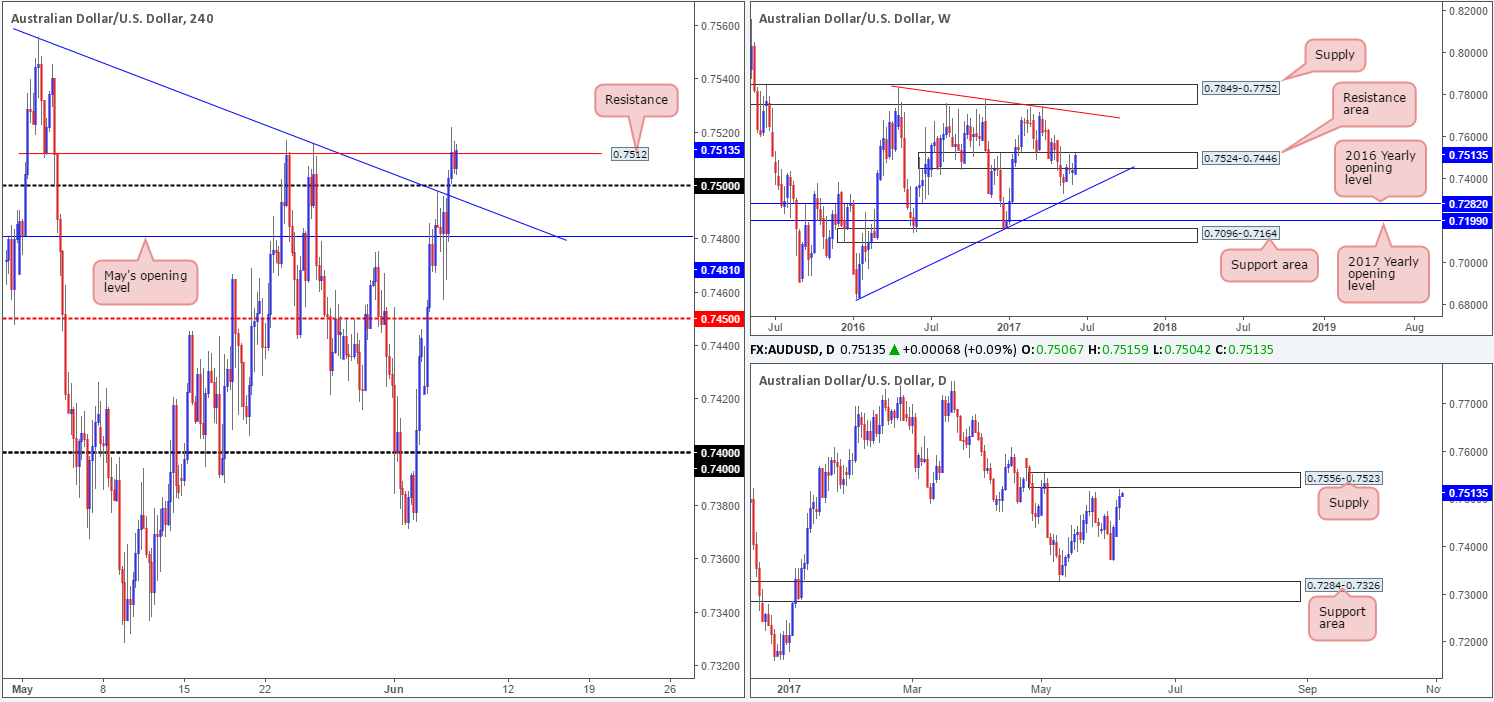
On Tuesday, the RBA decided to leave its monetary policy unchanged, which lifted the Aussie higher. After breaching both the H4 trendline resistance extended from the high 0.7556 and the psychological handle 0.75, the unit ended the day settling beneath a H4 resistance at 0.7512, which is, at the time of writing, just about holding firm.
Over on the bigger picture, the weekly candles remain within the confines of a resistance area seen at 0.7524-0.7446 (we must admit though, the strength of the bulls seen within this area is concerning). Down on the daily chart, price is currently trading just ahead of a supply zone pegged at 0.7556-0.7523.
Our suggestions: In essence, weekly bulls are showing strength even though they’re positioned within a resistance area. Daily price is seen trading nearby supply, and H4 action looks poised to breach its current resistance. In view of this, we feel it may be best to hit the sidelines today and reassess structure going into Thursday’s open. Hopefully price will be in a more favorable position by then.
Data points to consider: Australian GDP q/q numbers at 2.30am GMT+1.
Levels to watch/live orders:
· Buys: Flat (stop loss: N/A).
· Sells: Flat (stop loss: N/A).
USD/JPY:
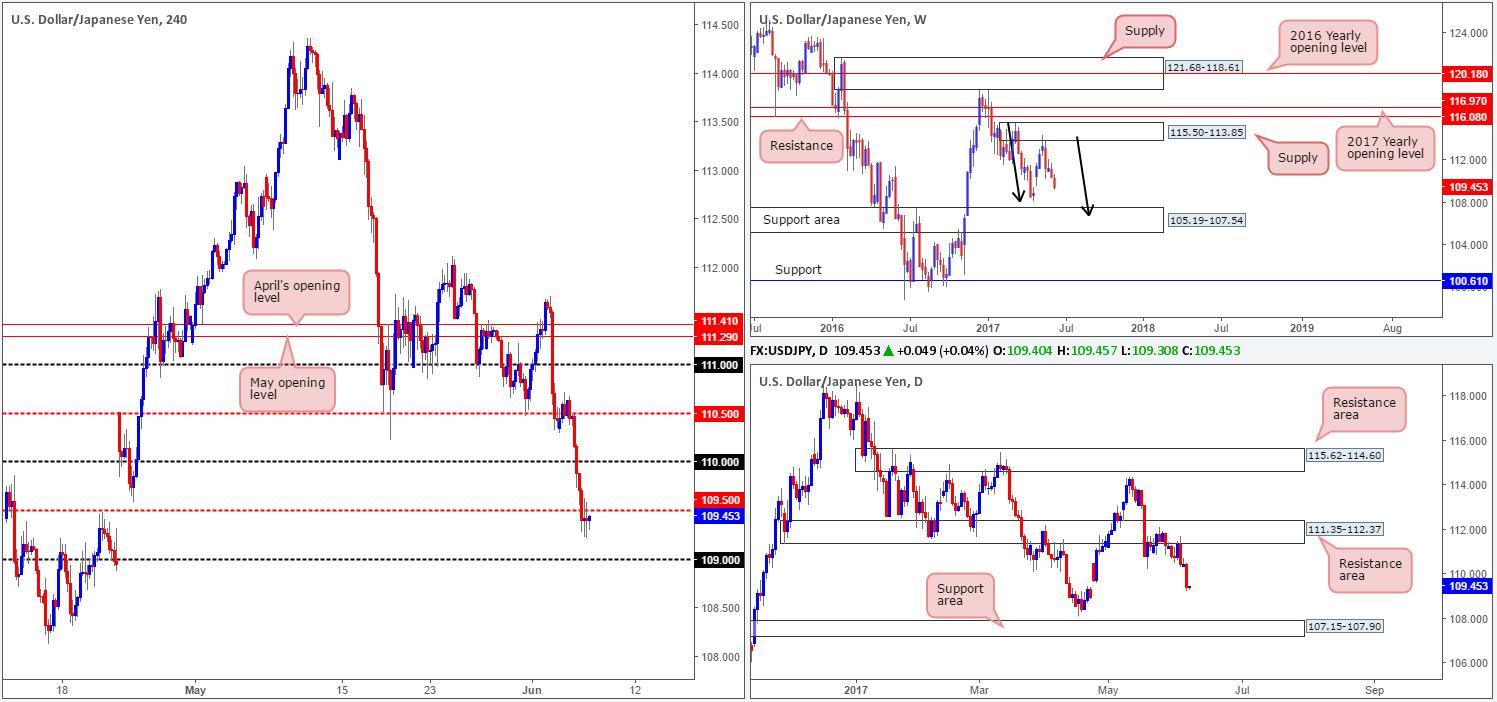
The USD/JPY is trading with a reasonably strong bias to the downside at the moment, as the pair tumbled over 100 pips during yesterday’s segment. H4 price, as you can see, settled below the mid-level number 109.50 and is currently holding as resistance.
Weekly bears continue to remain in a relatively strong position after pushing aggressively lower from supply registered at 115.50-113.85. We know there’s a lot of ground to cover here, but this move could possibly result in further downside taking shape in the form of a weekly AB=CD correction (see black arrows) that terminates within a weekly support area marked at 105.19-107.54 (stretches all the way back to early 2014).
In conjunction with weekly flow, daily price extended the bounce seen from the resistance area penciled in at 111.35-112.37, which could see price drive lower in the coming week to 107.15-107.90: a support zone that’s glued to the top edge of the said weekly support area.
Our suggestions: With the above notes in mind, our desk will be looking for (lower timeframe-confirmed – see the top of this report) shorts off 109.50 today, with an initial take-profit target set around the 109 vicinity.
Data points to consider: No high-impacting news on the docket today.
Levels to watch/live orders:
· Buys: Flat (stop loss: N/A).
· Sells: 109.50 region ([waiting for a lower-timeframe sell signal to form before pulling the trigger is advised] stop loss: dependent on where one confirms the area).
USD/CAD:
The USD/CAD, as you can see, bounced nicely from the H4 mid-level hurdle 1.3450 going into yesterday’s London open. This number was an area we highlighted as a possible buy zone since it also represents a daily support, unites with a 61.8% H4 Fib support line taken from the low 1.3387 and is also positioned nearby the 2017 yearly opening level at 1.3434 seen on the weekly chart. While H4 bulls are seen struggling here, this may indicate that 1.3434 may be brought into the picture sometime during today’s segment.
Our suggestions: While a second bounce from 1.3434/1.3450 is high probability we believe, we’d recommend waiting for a reasonably sized H4 bullish candle to form from here, preferably a full-bodied candle. This will help avoid an unnecessary loss on a potential fake down to the 1.34 hurdle.
Data points to consider: Crude oil inventories at 3pm GMT+1.

Levels to watch/live orders:
- Buys: 1.3434/1.3450 region ([waiting for a reasonably sized H4 bull candle – preferably a full-bodied candle – to form before pulling the trigger is advised] stop loss: ideally beyond the candle’s tail).
- Sells: Flat (Stop loss: N/A).
USD/CHF:
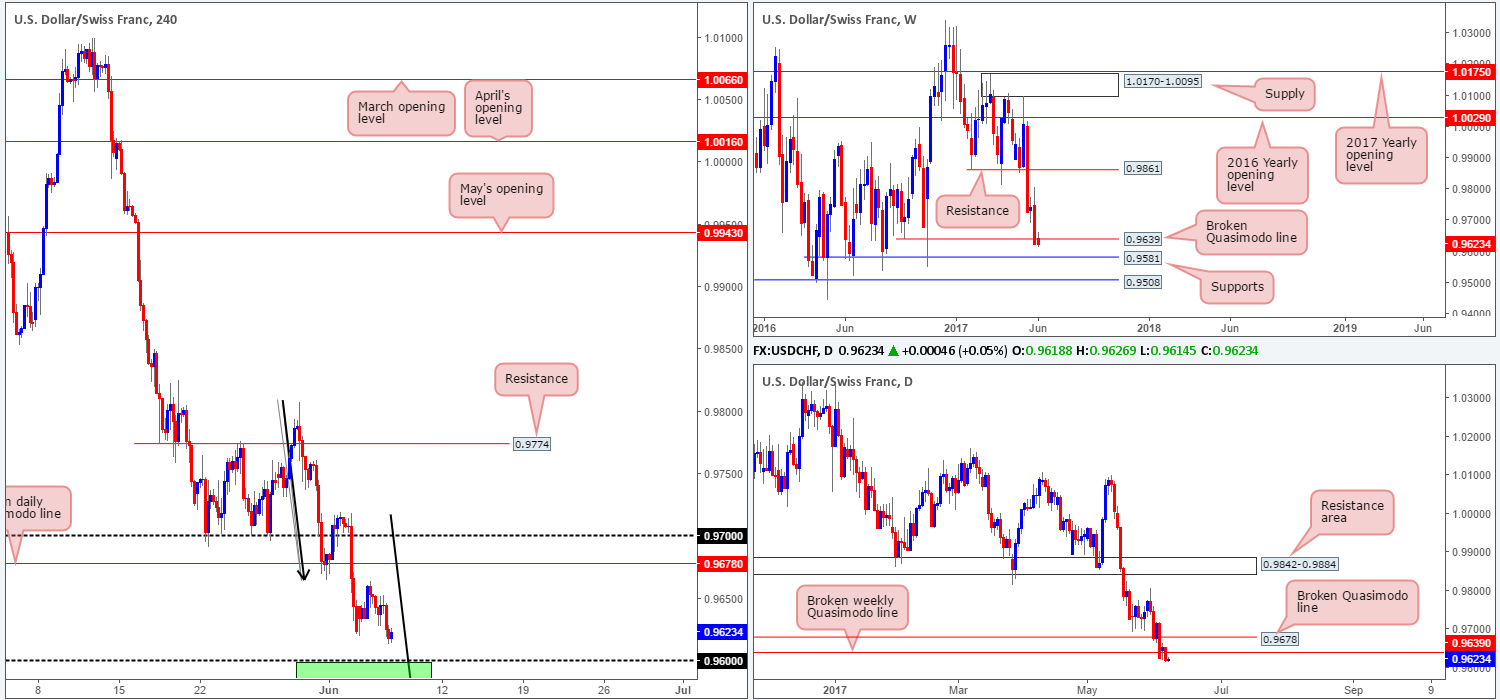
Although the USD/CHF punched lower yesterday, our outlook remains the same. On the weekly timeframe, we can see price trading beneath 0.9639: a recently broken Quasimodo line. The next downside target beyond this hurdle is seen around a support level drawn from 0.9581. Down on the daily chart, however, the unit shows the break below the above said weekly Quasimodo line could have potentially cleared the path south all the way down to 0.9546: a daily triple-bottom formation. Should price reach this line, nevertheless, we’d be wary of taking a long from here since a daily Quasimodo support level is seen lurking just below at 0.9488.
On the H4 chart, the candles are seen lurking 20 or so pips ahead of the 0.96 handle. 0.96, in our opinion, still deserves attention! Not only is it positioned nearby the weekly support mentioned above at 0.9581, it also sits close to a H4 AB=CD (see black arrows) 161.8% bullish completion point at 0.9572.
Our suggestions: Wait for H4 price to attack 0.9572/0.96 and watch to see if the H4 candles can print a reasonably sized H4 bull candle, preferably a full-bodied candle, before pushing the buy button. This, of course, will by no means guarantee a winning trade, but it will help determine buyer interest and help avoid an unnecessary loss! The first take-profit target from this base will be set around the 0.9650 area.
Data points to consider: No high-impacting news on the docket today.
Levels to watch/live orders:
· Buys: 0.9572/0.96 ([waiting for a reasonably sized H4 bull candle – preferably a full-bodied candle – to form before pulling the trigger is advised] stop loss: ideally beyond the candle’s tail).
· Sells: Flat (stop loss: N/A).
DOW 30:
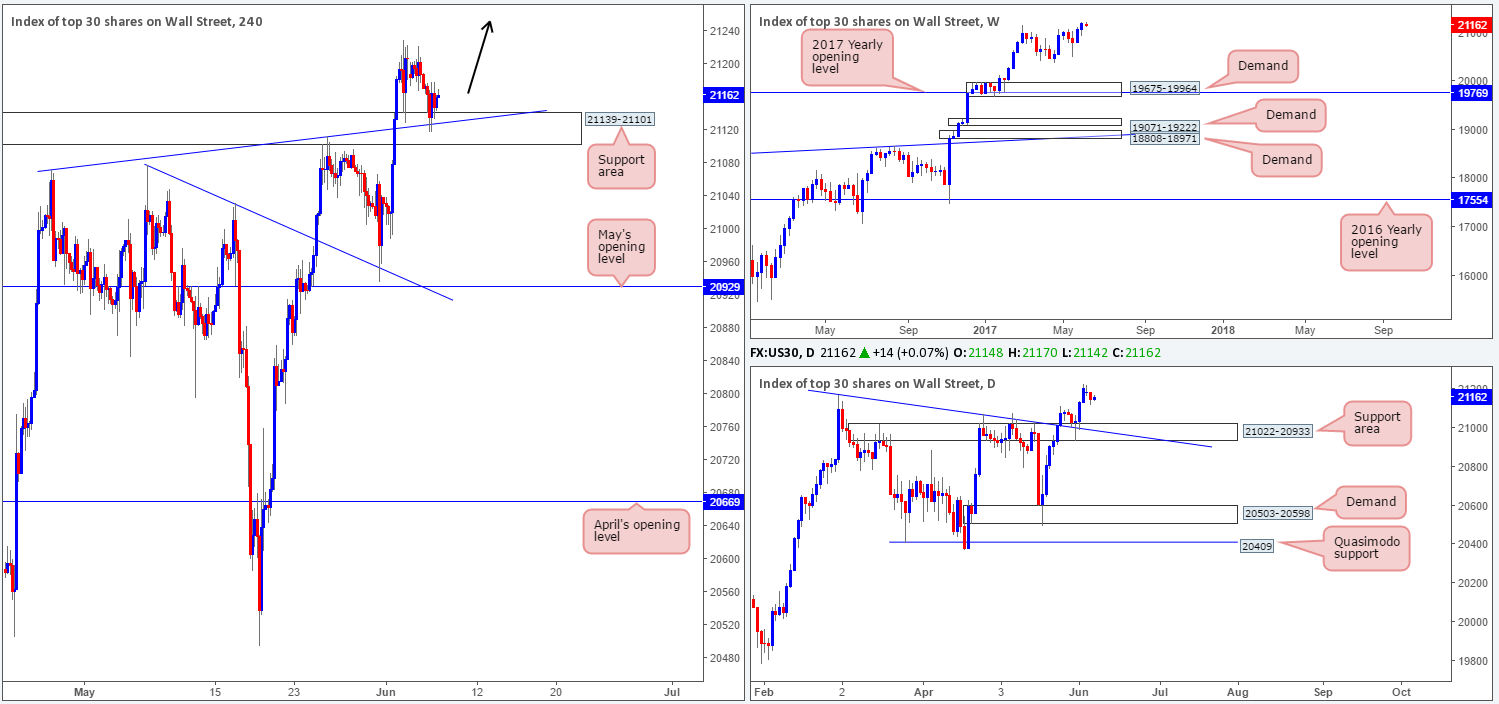
During the course of yesterday’s sessions, the DOW retested the H4 support area at 21139-21101 (converges with a H4 trendline support etched from the high 21072) for a second time. For those who read Tuesday’s report you may recall our team saying that if this should occur, and we happen to see a bullish H4 candle present itself from here, we’d have little hesitation in jumping in long from this base.
In light of the recent action, we have taken a small long position at 21164 and placed stops below the H4 support area at 21097.
Our suggestions: Essentially, what we’re looking for here is trend continuation.
Data points to consider: No high-impacting news on the docket today.
Levels to watch/live orders:
- Buys: 21164 ([live] stop loss: 21097).
- · Sells: Flat (stop loss: N/A).
GOLD:
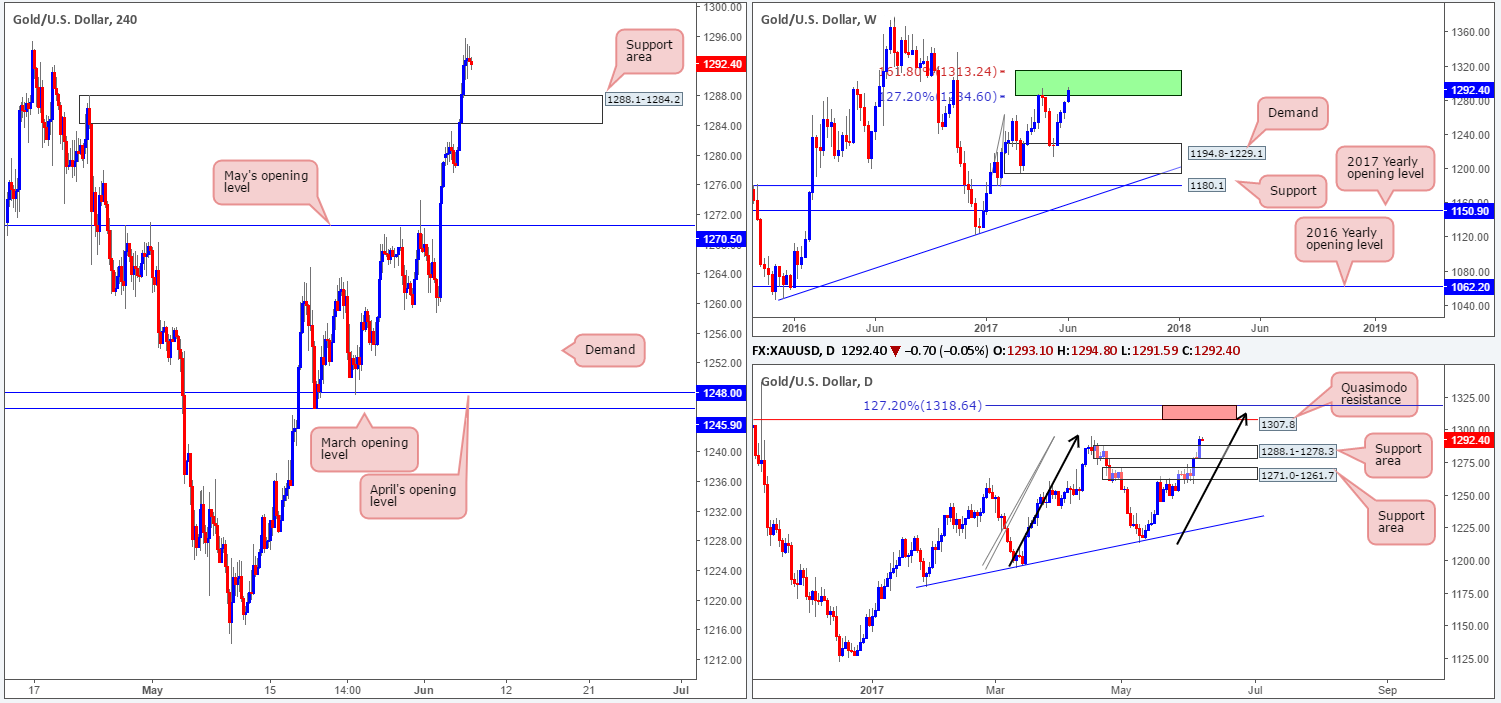
(Trade update: took a loss at 1288.9).
As can be seen from the weekly chart, price recently entered an area comprised of two weekly Fibonacci extensions 161.8/127.2% at 1313.7/1285.2 taken from the low 1188.1 (green zone). Similar to when price struck this zone back in mid-April, we expect the bears to make an appearance here sometime soon.
Down on the daily chart, however, the supply at 1288.1-1278.3 was taken out during yesterday’s trading. The removal of this zone has potentially cleared the pathway north up to the Quasimodo resistance at 1307.8. Also noteworthy is the possible AB=CD daily bearish pattern (see black arrows) that terminates a tad beyond the said Quasimodo resistance (positioned within the upper limits of the weekly green zone) at 1318.6 (127.2% ext.).
Looking over to the H4 chart, we can see that the supply zone at 1288.1-1284.2 was taken out, and has now become a potential support zone.
Our suggestions: Neither a long nor short seems attractive at this time. Buying from the current H4 support area would be risky due to where price is positioned on the weekly chart right now. And, of course, selling into a H4 support area is also not something we’d be comfortable with.
Ultimately we’re watching for the daily candles to test the aforementioned Quasimodo resistance/127.2% AB=CD completion point as this is, given its location on the weekly chart (see above), an ideal sell zone (see red area), in our opinion.
Levels to watch/live orders:
· Buys: Flat (stop loss: N/A).
· Sells: 1318.6/1307.8 is a potential sell zone to keep an eye on.


