EUR/USD:
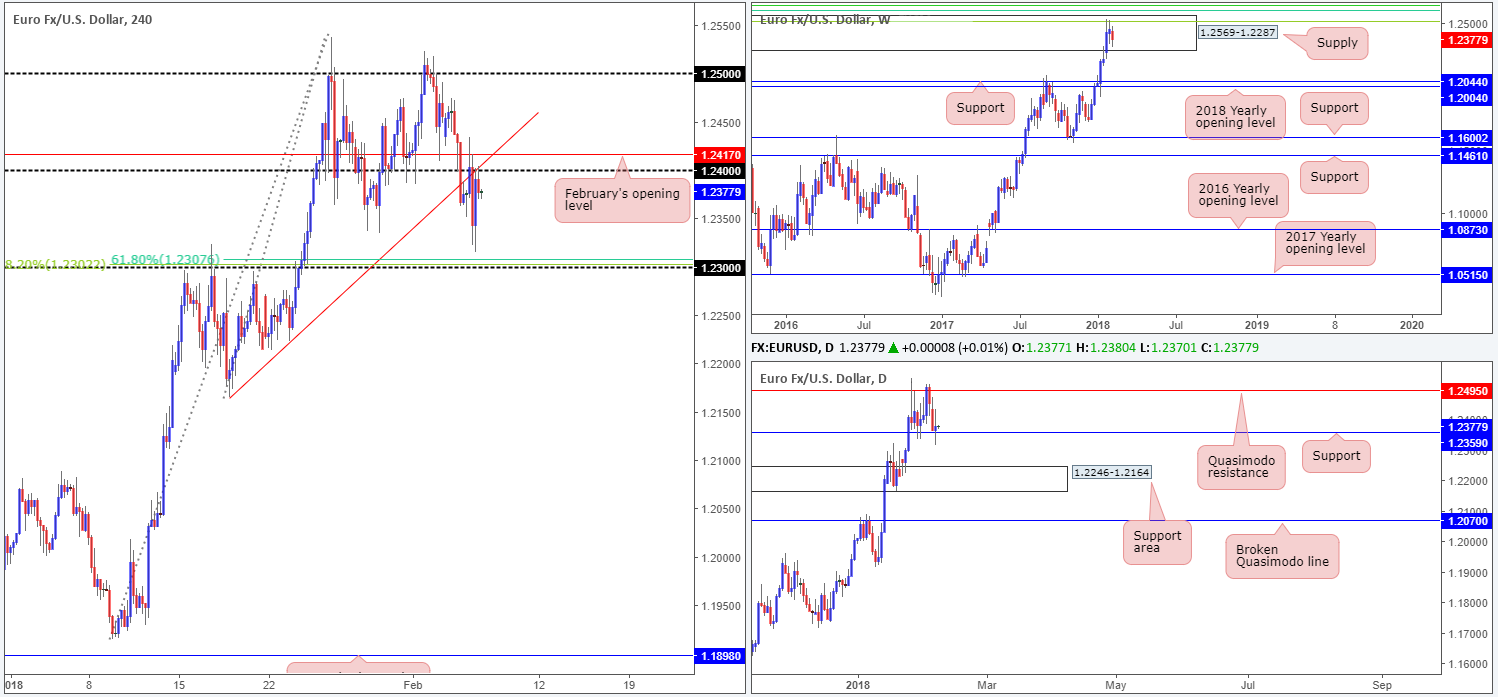
Going into the early hours of London on Tuesday, the single currency sold off and eventually clocked a low of 1.2314 and from there rose 90 pips to a high of 1.2404.
As you can see, the market ended the day fading the 1.24 handle on the H4 timeframe, which happens to fuse beautifully with a recently broken H4 trendline support-turned resistance taken from the low 1.2165.
Over on the weekly timeframe, upward momentum appears to be crumbling as sellers defend the weekly supply zone coming in at 1.2569-1.2287. Continued selling from this base could eventually force the pair to shake hands with weekly support at 1.2044, followed closely by the 2018 yearly opening level at 1.2004.
A little lower on the curve, however, we can see that daily movement recently checked in with daily support at 1.2359 and chalked up a clear-cut daily indecision candle. A violation of this line would likely place the daily support area at 1.2246-1.2164 in the spotlight.
Potential trading zones:
The 1.24 handle, H4 trendline resistance, nearby February opening level at 1.2417 is likely area of interest for sellers today. This area also benefits from being positioned within he walls of the current weekly supply zone. The next H4 downside target from 1.24 can be seen at 1.23, which merges with two H4 Fib supports: 61.8% (1.2307) and 38.2% (1.2302). Let’s keep in mind though that opposing this trade is the current daily support.
Data points to consider: FOMC member Dudley speaks at 1.30pm; FOMC member Williams speaks at 10.20pm GMT.
Areas worthy of attention:
Supports: 1.23 handle; 1.2302; 1.2307; 1.2359; 1.2044; 1.2004.
Resistances: 1.2569-1.2287; 1.2417; H4 trendline resistance; 1.24 handle.
GBP/USD:
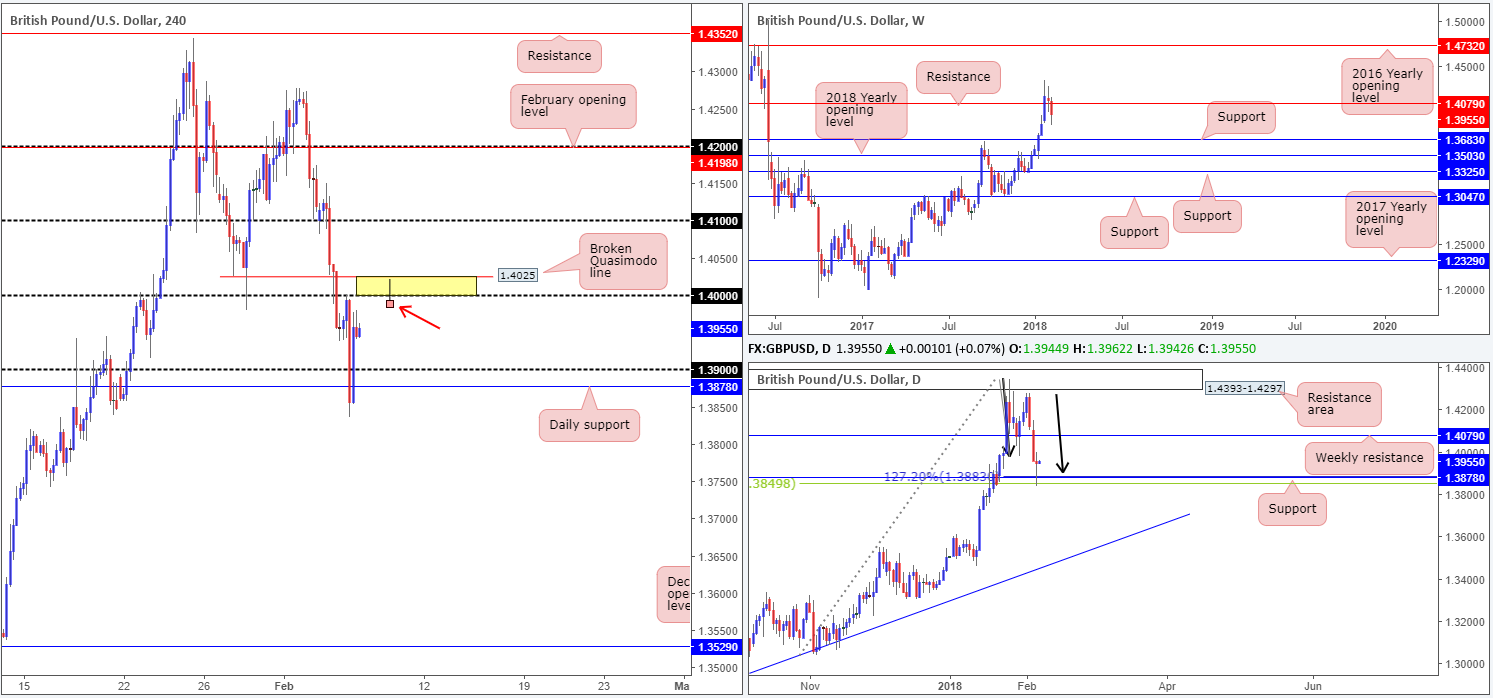
After retesting the underside of the large psychological band 1.40 (H4) amid early London hours, the British pound, in one fell swoop, surpassed both 1.39 and the daily support at 1.3878, registering a session low of 1.3836.
What was also brought into play, however, was a daily AB=CD (see black arrows) 127.2% correction point at 1.3883 and a 38.2% daily Fib support at 1.3849. This, from a technical perspective, helped the pair recover the majority of earlier losses during US trading hours.
The H4 area marked in yellow between 1.40 and a H4 broken Quasimodo line at 1.4025 represents a potential fakeout zone. A huge number of stop-loss orders are typically positioned around large psychological levels. This is why these numbers tend to overshoot at times. The yellow zone highlights where potential stop-loss orders are located.
Potential trading zones:
Although the unit recently responded to a reasonably attractive base of daily support (see above), selling from 1.4025/1.40 is a real possibility. Should H4 price chalk up a selling wick (see H4 chart) that penetrates the yellow H4 fakeout zone and closes below 1.40, this is a strong indication that the bears want to revisit the 1.39 neighborhood. Bolstering this sell is the fact that weekly price shows little support on the horizon until we reach 1.3683.
Data points to consider: UK Halifax HPI m/m at 8.30am; FOMC member Dudley speaks at 1.30pm; FOMC member Williams speaks at 10.20pm GMT.
Areas worthy of attention:
Supports: 1.39 handle; 1.3878; 1.3883; 1.3849; 1.3683.
Resistances: 1.4025; 1.40 handle.
AUD/USD:
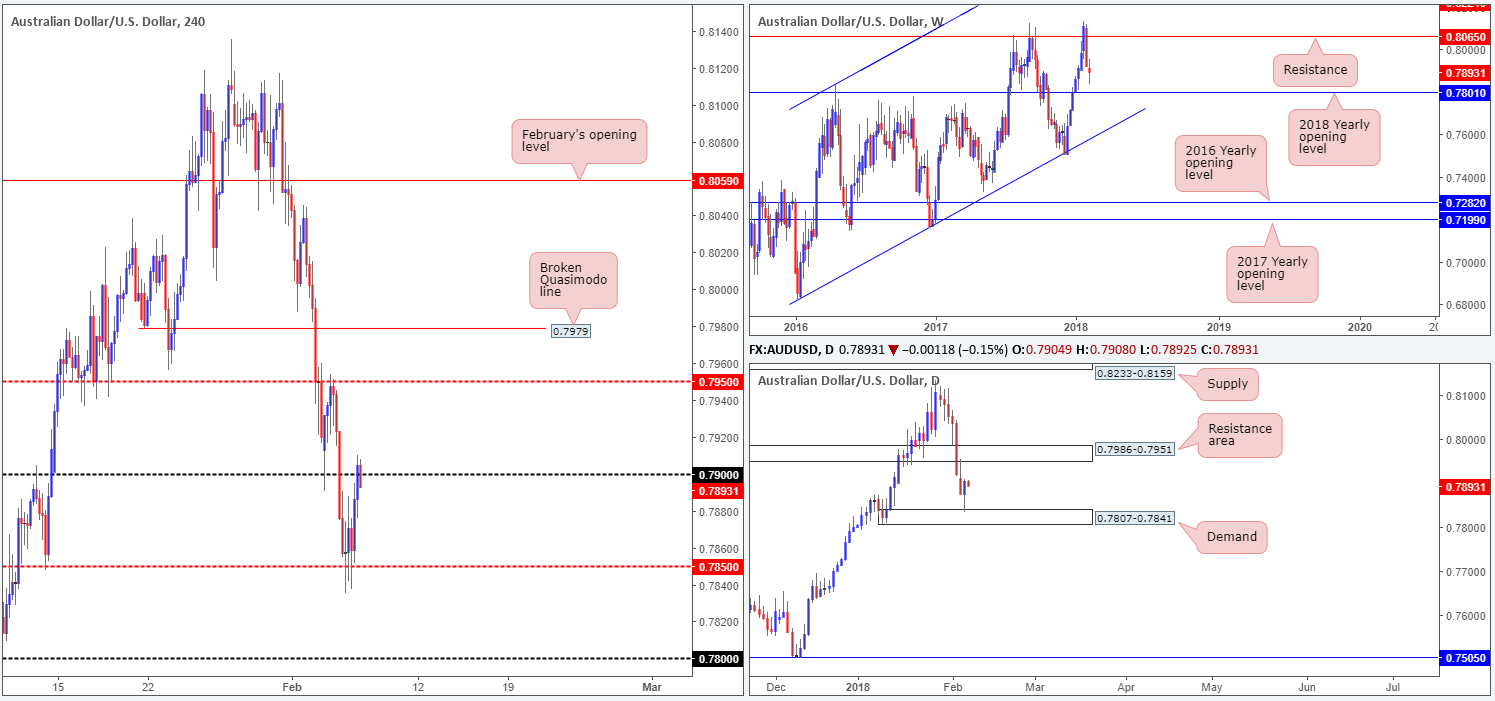
Breaking a six-day bearish phase, the commodity-linked currency printed a healthy recovery during Tuesday’s segment from the top edge of a daily demand base penciled in at 0.7807-0.7841. From the daily scale, technicals suggest further buying up to a daily resistance area at 0.7986-0.7951 is a possibility.
H4 price found a pocket of strong bids around the H4 mid-level support at 0.7850 on Tuesday, and concluded trade closing marginally above the 0.79 handle. As we write, though, H4 sellers are in play and currently pushing the action sub 0.79. Also worth noting is that weekly price shows room to press as far south as the 2018 yearly opening level at 0.7801.
Potential trading zones:
Ultimately, there’s very little to hang our hat on as far as trading setups are concerned. Structure is somewhat restricted. Daily price indicates a potential continuation to the upside, while weekly action portends further downside. This – coupled with H4 price filtering around a psychological band which, as far as we can see, offers little trade confluence – is a market that may be best placed on the back burner today.
Data points to consider: FOMC member Dudley speaks at 1.30pm; FOMC member Williams speaks at 10.20pm GMT.
Areas worthy of attention:
Supports: 0.7850; 0.7807-0.7841; 0.7801.
Resistances: 0.79 handle; 0.7986-0.7951.
USD/JPY:
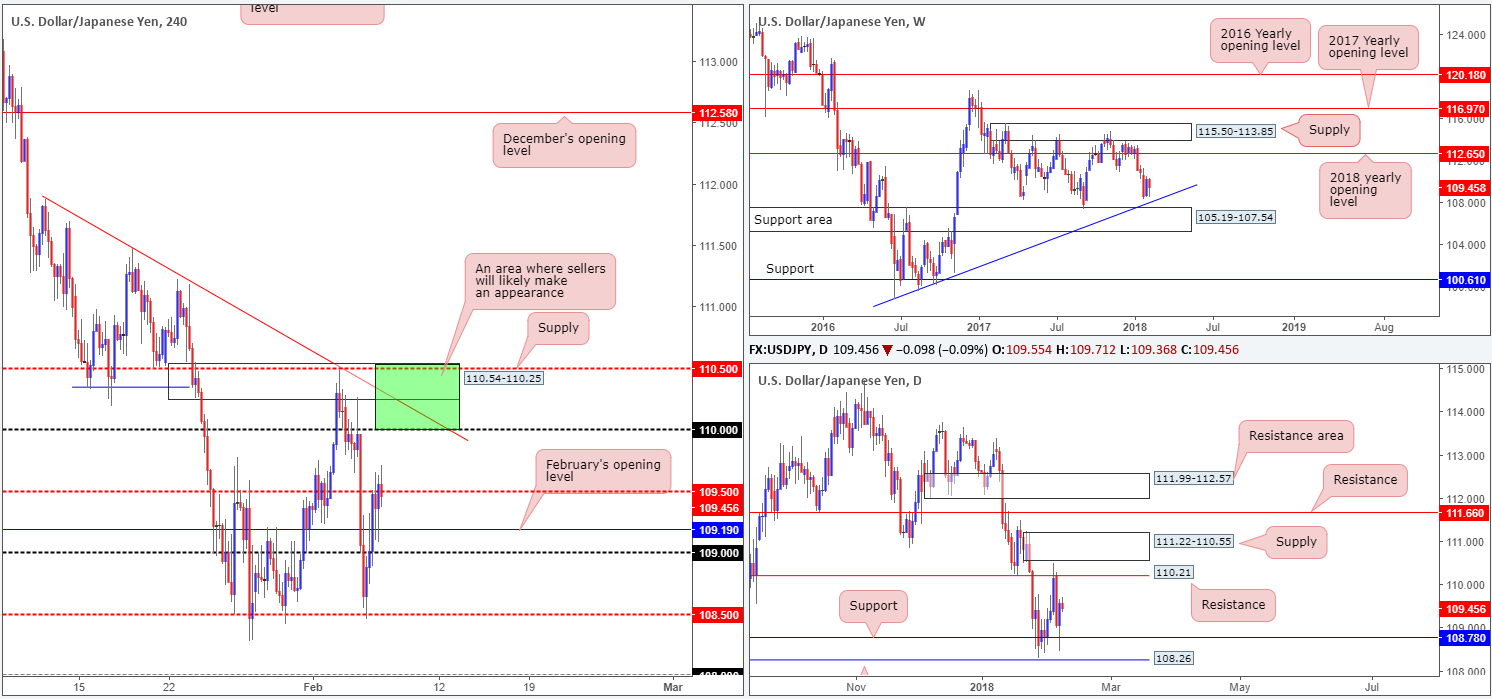
Wall Street aggressively recovered a portion of Monday’s losses on Tuesday, consequently bolstering the USD/JPY market.
The H4 candles, as you can see, managed to climb back above the 109 handle and nearby February opening level at 109.19 during yesterday’s sessions, and is currently seen flirting with the H4 mid-level resistance printed at 109.50.
Daily support at 108.78 was also brought back into the action, which has placed the daily resistance level at 110.21 back in the spotlight.
Weekly movement continues to hover above a weekly trendline support etched from the low 98.78 and a nearby weekly support area coming in at 105.19-107.54.
Potential trading zones:
As can be seen on the H4 timeframe this morning, price action is reasonably cramped. Above 109.50, however, we have the 110 handle, followed closely by a H4 trendline resistance extended from the high 111.87 and a H4 supply base at 110.54-110.25. Given that these H4 structures collide with the aforesaid daily resistance level, active selling could be seen from the H4 area marked in green.
Data points to consider: FOMC member Dudley speaks at 1.30pm; FOMC member Williams speaks at 10.20pm GMT.
Areas worthy of attention:
Supports: 109 handle; 109.19; 108.78; Weekly trendline support; 105.19-107.54.
Resistances: 109.50; 110 handle; H4 trendline resistance; 110.54-110.25.
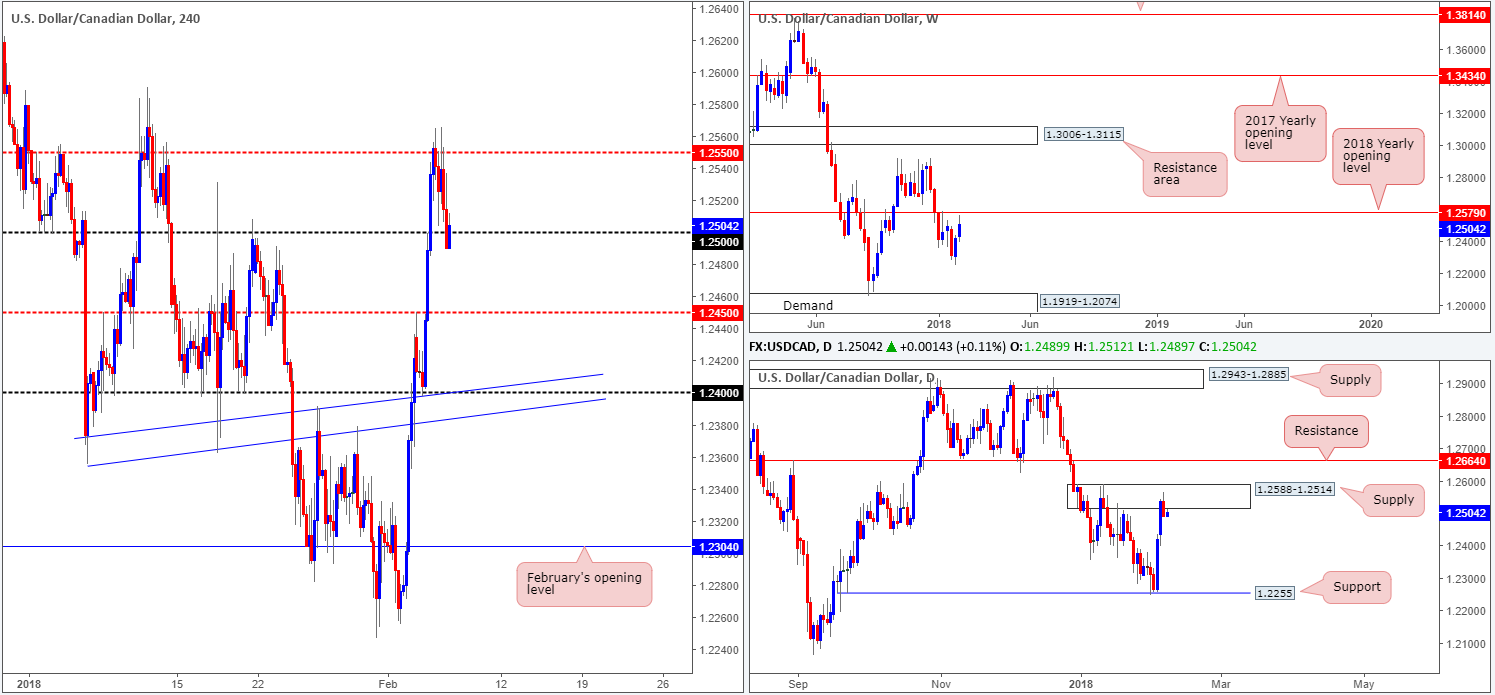
USD/CAD:
Kicking this morning’s analysis off with a look at the weekly timeframe, we can see that price came within striking distance of connecting with the 2018 yearly opening level at 1.2579 during Tuesday’s session. This – coupled with the daily supply zone planted at 1.2588-1.2514 – makes for an interesting base of collective resistance.
Over on the H4 timeframe, the market faded the H4 mid-level resistance barrier at 1.2550 yesterday and concluded the segment closing sub 1.25. Should the current H4 candle respect the underside of 1.25, further downside will likely be in store. How far south, though, is difficult to judge since daily movement shows little support in view until we reach the 1.2255 mark.
Potential trading zones:
Watch for H4 price to respect the underside of 1.25. A solid close lower from here would be ideal! This would likely signal a bearish resumption down to at least the H4 mid-level support at 1.2450. Ultimately though, further selling is highly likely from this point. The final take-profit target for any shorts should, in our view, be positioned around 1.2250ish (daily support).
Data points to consider: FOMC member Dudley speaks at 1.30pm; FOMC member Williams speaks at 10.20pm; CAD building permits at 1.30pm; crude oil inventories at 3.30pm GMT.
Areas worthy of attention:
Supports: 1.25 handle; 1.2450; 1.2255.
Resistances: 1.2550; 1.2588-1.2514; 1.2579.
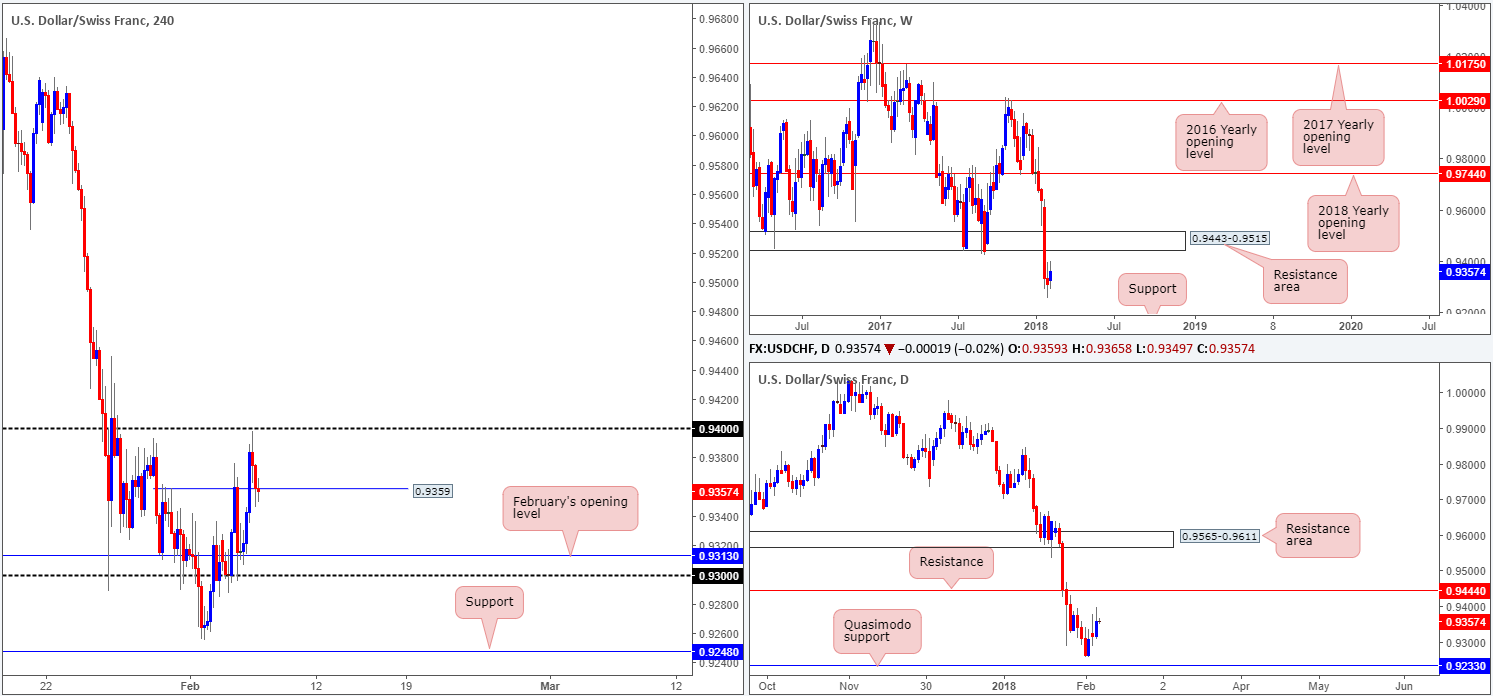
USD/CHF:
An unrelenting push to the upside was seen in recent trading from February’s opening level (H4) at 0.9313, which only really saw any form of resistance after coming within shouting distance of the 0.94 handle. This, as you can see, brought a local H4 support into play at 0.9359, which for now, is holding ground (current H4 candle is printing indecisiveness).
Across on the daily timeframe, the unit is trading with a reasonably strong upside bias since bottoming ahead of a daily Quasimodo support at 0.9233 at the beginning of the month. Further buying from current price, in our view, is a reasonable possibility since there’s little topside resistance on the radar until we connect with 0.9444, which, as you can see from the weekly scale, also denotes the underside of a weekly resistance area at 0.9443-0.9515.
Potential trading zones:
Should H4 bids defend the noted local support at 0.9359 today, a revisit of the 0.94 region, and quite possibly the daily resistance at 0.9444, is likely on the cards.
To pin down a trade from 0.9359, nevertheless, one, in our opinion, would need to drill down to the lower timeframes to enter since this would lower the stop-loss size and thereby increase risk/reward, which is paramount here since price could fade 0.94 once again.
Data points to consider: FOMC member Dudley speaks at 1.30pm; FOMC member Williams speaks at 10.20pm GMT.
Areas worthy of attention:
Supports: 0.9233; 0.9359; 0.9313.
Resistances: 0.94 handle; 0.9444; 0.9443-0.9515.
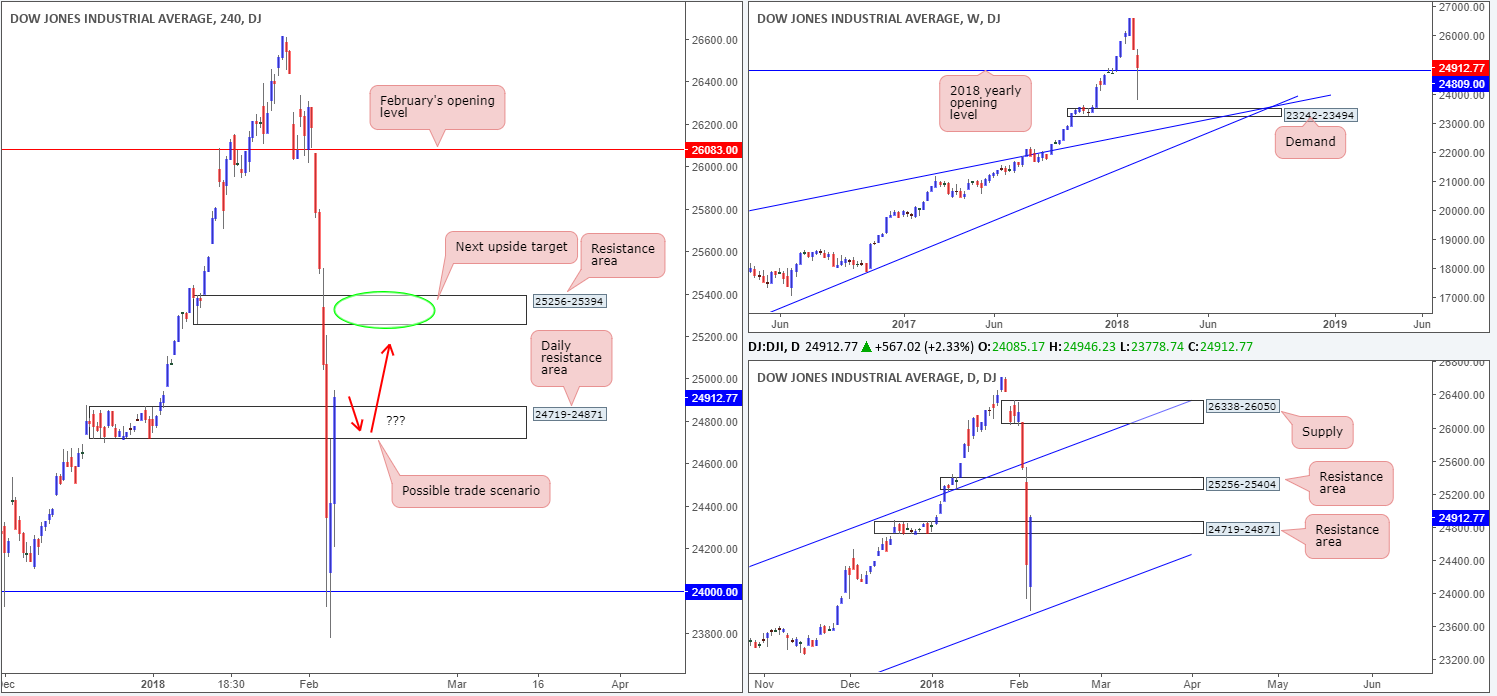
DOW 30:
US equity indexes rebounded sharply on Tuesday following Monday’s brutal selloff. The DJIA remained bid above the $24K mark on the H4 timeframe (and daily channel support extended from the low 17883) and ended the day closing a few points above a daily resistance area logged in at 24719-24871. Further upside from this point has the H4 resistance area at 25256-25394 to target, which is located within the lower limits of a daily resistance area printed at 25256-25404. Also worth noting is the strong buying tail present on the weekly timeframe, which has placed the unit back above its 2018 yearly opening level at 24809.
Potential trading zones:
Should the H4 candles show signs of basing above the current daily resistance area in the form of a retest, a long could be an option at this point. An ideal trade scenario, in our book, would be a H4 retest of the daily zone followed with a reasonably sized H4 full or near-full-bodied bull candle.
Data points to consider: FOMC member Dudley speaks at 1.30pm; FOMC member Williams speaks at 10.20pm GMT.
Areas worthy of attention:
Supports: 24000; daily channel support; 24809.
Resistances: 24719-24871; 25256-25394; 25256-25404.
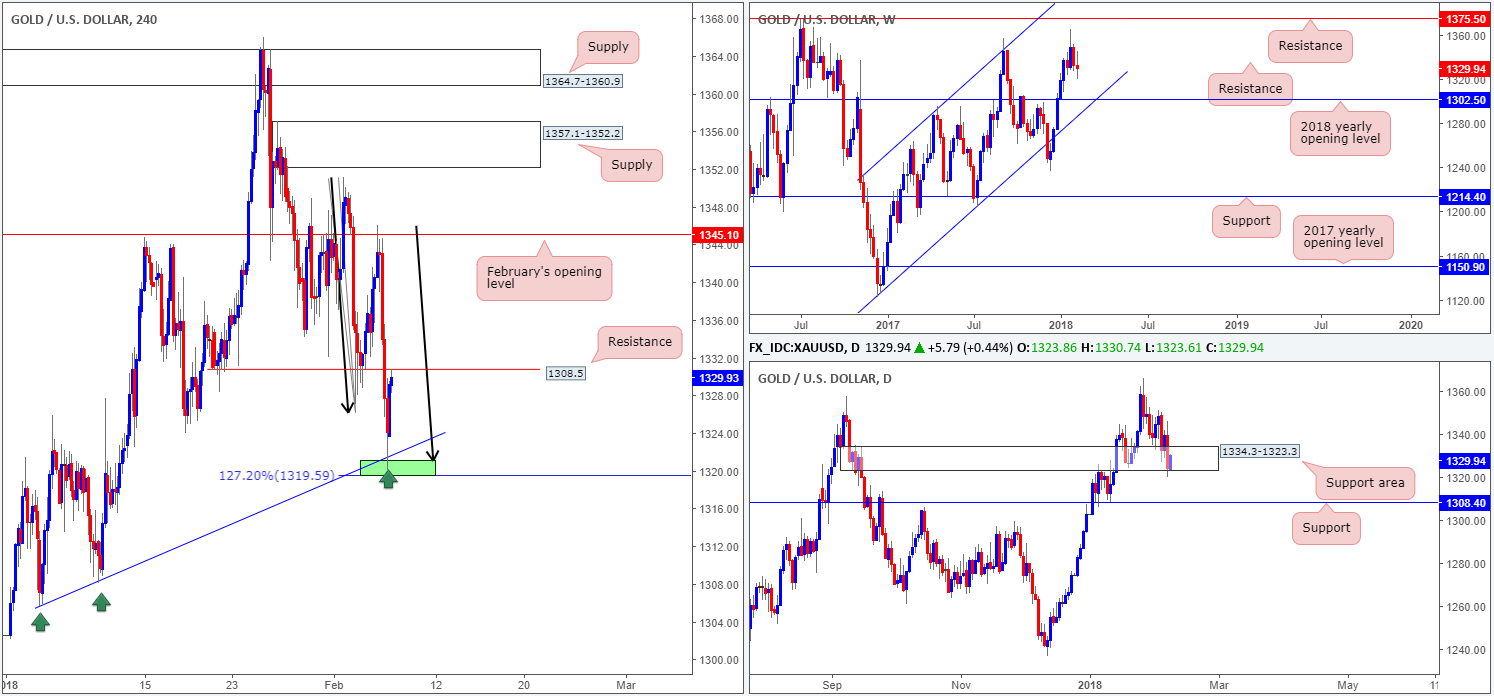
GOLD:
After connecting with February’s opening level seen on the H4 timeframe at 1345.1 in the early hours of Tuesday’s session, the value of gold weakened in aggressive fashion. In the shape of three dominant H4 bearish candles, the unit struck a session low of 1320.3 in the later hours of the US segment. As can be seen from the H4 timeframe, this completed an AB=CD 127.2% move at 1319.5/1321.7 (converged with a local H4 trendline support taken from the low 1305.6) which has so far done a superb job providing support to the metal, now seen touching the underside of a local H4 resistance plotted at 1308.5.
Turning the focus over to the daily timeframe, we can see that the support area at 1334.3-1323.3 remains in play, despite suffering a minor breach yesterday. The next area of interest beneath here can be seen at 1308.4: a daily support level, and then the 2018 yearly opening level seen on the weekly timeframe at 1302.5.
Potential trading zones:
Intraday shorts could be a possibility from 1308.5 given that weekly price shows room to press lower. However, entering into a sell from this point places you in direct conflict with daily buyers, thus not really a high-probability trade, in our view.
Other than the above, we do not see much to hang our hat on for the time being – therefore, we’ll reassess as we move into the European session today.
Areas worthy of attention:
Supports: 1319.5/1321.7; 1334.3-1323.3; 1308.4; 1302.5.
Resistances: 1308.5; 1345.1.
This site has been designed for informational and educational purposes only and does not constitute an offer to sell nor a solicitation of an offer to buy any products which may be referenced upon the site. The services and information provided through this site are for personal, non-commercial, educational use and display. IC Markets does not provide personal trading advice through this site and does not represent that the products or services discussed are suitable for any trader. Traders are advised not to rely on any information contained in the site in the process of making a fully informed decision.
This site may include market analysis. All ideas, opinions, and/or forecasts, expressed or implied herein, information, charts or examples contained in the lessons, are for informational and educational purposes only and should not be construed as a recommendation to invest, trade, and/or speculate in the markets. Any trades, and/or speculations made in light of the ideas, opinions, and/or forecasts, expressed or implied herein, are committed at your own risk, financial or otherwise.
The use of the site is agreement that the site is for informational and educational purposes only and does not constitute advice in any form in the furtherance of any trade or trading decisions.
The accuracy, completeness and timeliness of the information contained on this site cannot be guaranteed. IC Markets does not warranty, guarantee or make any representations, or assume any liability with regard to financial results based on the use of the information in the site.
News, views, opinions, recommendations and other information obtained from sources outside of www.icmarkets.com.au, used in this site are believed to be reliable, but we cannot guarantee their accuracy or completeness. All such information is subject to change at any time without notice. IC Markets assumes no responsibility for the content of any linked site. The fact that such links may exist does not indicate approval or endorsement of any material contained on any linked site.
IC Markets is not liable for any harm caused by the transmission, through accessing the services or information on this site, of a computer virus, or other computer code or programming device that might be used to access, delete, damage, disable, disrupt or otherwise impede in any manner, the operation of the site or of any user’s software, hardware, data or property.