A note on lower timeframe confirming price action…
Waiting for lower timeframe confirmation is our main tool to confirm strength within higher timeframe zones, andhas really been the key to our trading success. It takes a little time to understand the subtle nuances, however, as each trade is never the same, but once you master the rhythm so to speak, you will be saved from countless unnecessary losing trades. The following is a list of what we look for:
- A break/retest of supply or demand dependent on which way you’re trading.
- A trendline break/retest.
- Buying/selling tails – essentially we look for a cluster of very obvious spikes within the higher timeframe zone.
- Candlestick patterns. We tend to only stick with pin bars and engulfing bars as these have proven to be the most effective.
EUR/USD:
The EUR/USD pair, as you can see, aggressively sold off from 1.0986 into a 4hr demand area at 1.0868-1.0902going into the yesterday’s close 1.0879. Although this 4hr demand zone has already been visited (30/07/15), it could still provide a tradable bounce higher today since it converges nicely with a 4hr Harmonic bullish Gartley pattern, which boasts a tight potential reversal zone (PRZ) of only four pips at 1.0874-1.0878 (green area). Additionally, we can also see price trading deep within a minor daily demand area seen at 1.0868-1.0926, which could potentially add strength here.
However, although a bounce higher from here is possible, we are hesitant to buy at this time due to near-term resistance looming just above at both1.0900 and the 4hr ignored Quasimodo level coming in at 1.0924. In the event that price breaks above these two barriers (consequently clearing the majority of sellers out), we may look to buy on any respectable retracement seen, targeting the 4hr supply area at 1.0986-1.0968 as per the blue arrows (lines up with the 38.2% Fibonacci retracement of swings A-D –Scott Carney trade management rules).

Levels to watch/live orders:
- Buys:Watch for 1.0900/1.0924 to be consumed and then look to enter on any retracement seen.
- Sells: Flat (Stop loss: N/A).
GBP/USD:
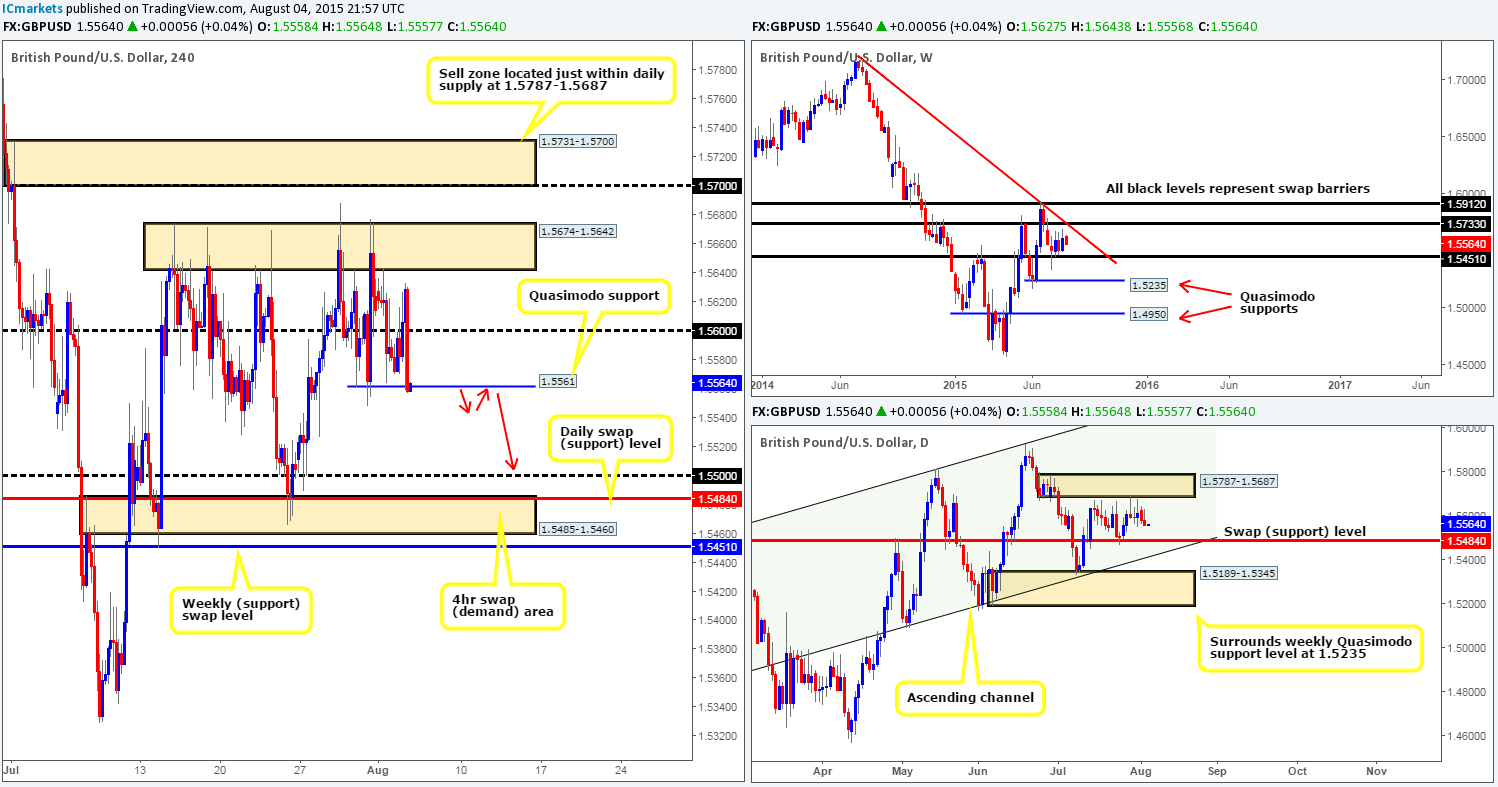
Recent action on Cable shows that price has just closed below a 4hr Quasimodo support level at 1.5561. Should the sellers be able to hold this market below here today, this would likely stimulate a further decline down towards 1.5500. To trade this potential 40-50 pip intraday move south, however, we’d need to see some form of lower timeframe selling confirmation here on the lower timeframes before our team would consider risking live capital.
In the event that we do manage to find an entry at 1.5561 today, we would have no hesitation in closing out our full position out at 1.5500, since at that point, we’ll then then be entering into higher timeframe buying territory (Weekly swap [support] level at 1.5451/Daily swap [support] level at 1.5484), so you may want to take a note of this as a bounce higher from this region is very likely.
Levels to watch/ live orders:
- Buys: Flat (Stop loss: N/A).
- Sells: 1.5561 [Tentative – confirmation required] (Stop loss: Dependent on where one confirms this level).
AUD/USD:
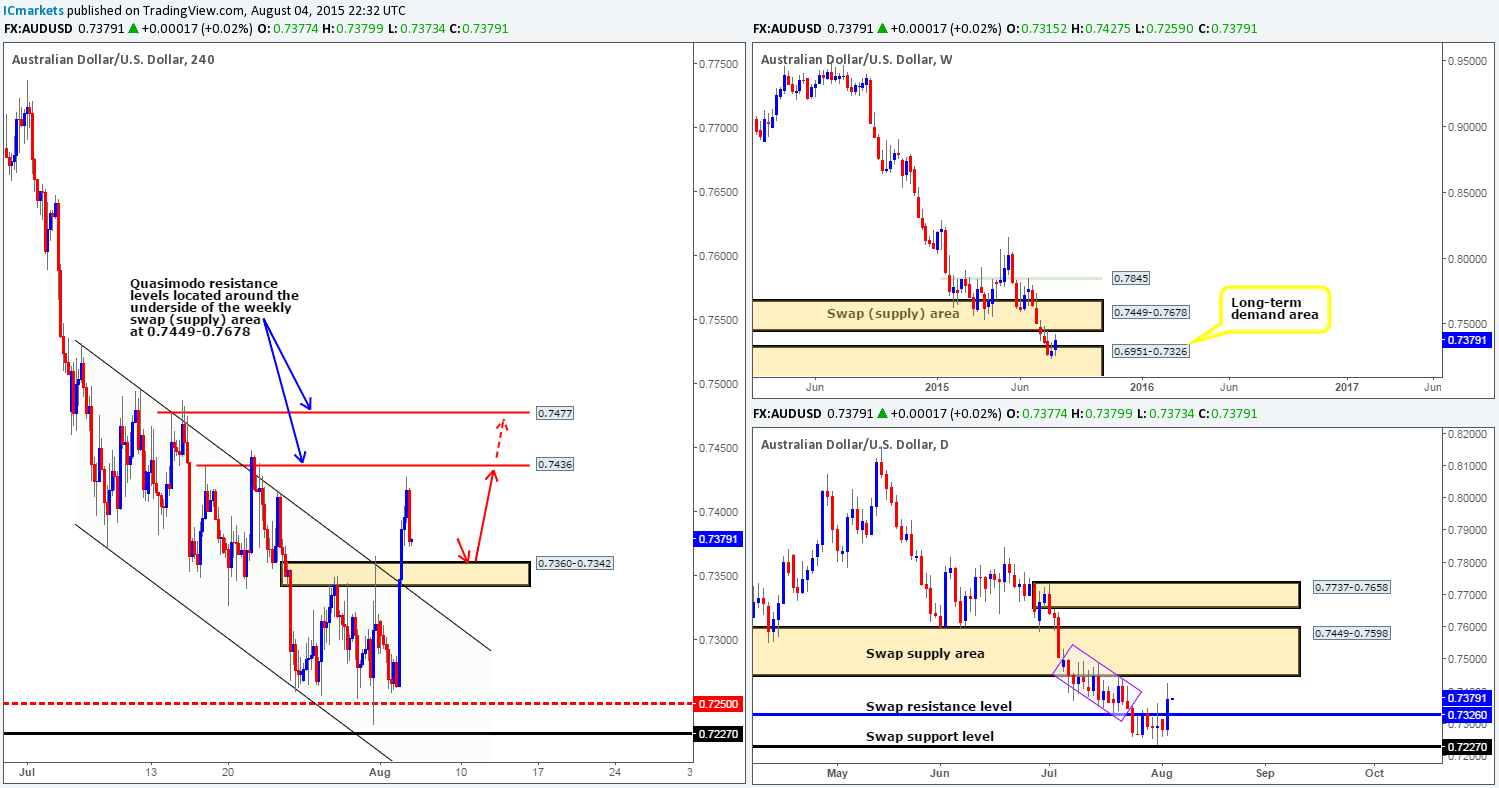
Early on in yesterday’s trade, the AUD/USD pair rocketed north breaking above not only a 4hr downward trending channel (0.7531/0.7371), but also a 4hr supply area coming in at 0.7360-0.7342. It was only once price reached 0.7427 (the high for the day) going into the U.S. afternoon session did we see active sellers make an appearance.
Personally, we’re not too excited by this recent outburst in buying and believe downside risk will continue to plague this pair, due to price not only being entrenched in a humongous downtrend at the moment, but also trading just below resistance on the weekly timeframe in the form of a swap (supply) area at 0.7449-0.7678. Furthermore, check out the daily scale. There is a lot of wood to still chop through (see action within the rotated rectangle) before prices are effectively free to even attack the aforementioned weekly swap (supply) area.
Given the points made above, our team is currently favoring shorts over longs at this time. As such, there are two levels we’re eyeing at the moment; both of them are 4hr Quasimodo resistance levels which come in at 0.7436 and 0.7477 (lower timeframe confirmation is required since it is difficult to know which level will see the best reaction, if any). In order for prices to reach our levels of interest, nonetheless, a further push higher would be required, which could take place from the recently broken 4hr supply (now demand) at 0.7360-0.7342 (see red arrows). This in itself could also be a potential opportunity to buy this market today for traders with an appetite for risk. We would highly recommend only buying here though with lower timeframe confirmation just to be on the safe side.
Levels to watch/ live orders:
- Buys: 0.7360-0.7342[Tentative – confirmation required] (Stop loss: 0.7336).
- Sells: 0.7436 [Tentative – confirmation required] (Stop loss: Dependent on where one confirms this level) 0.7477 [Tentative – confirmation required] (Stop loss: Dependent on where one confirms this level).
USD/JPY:
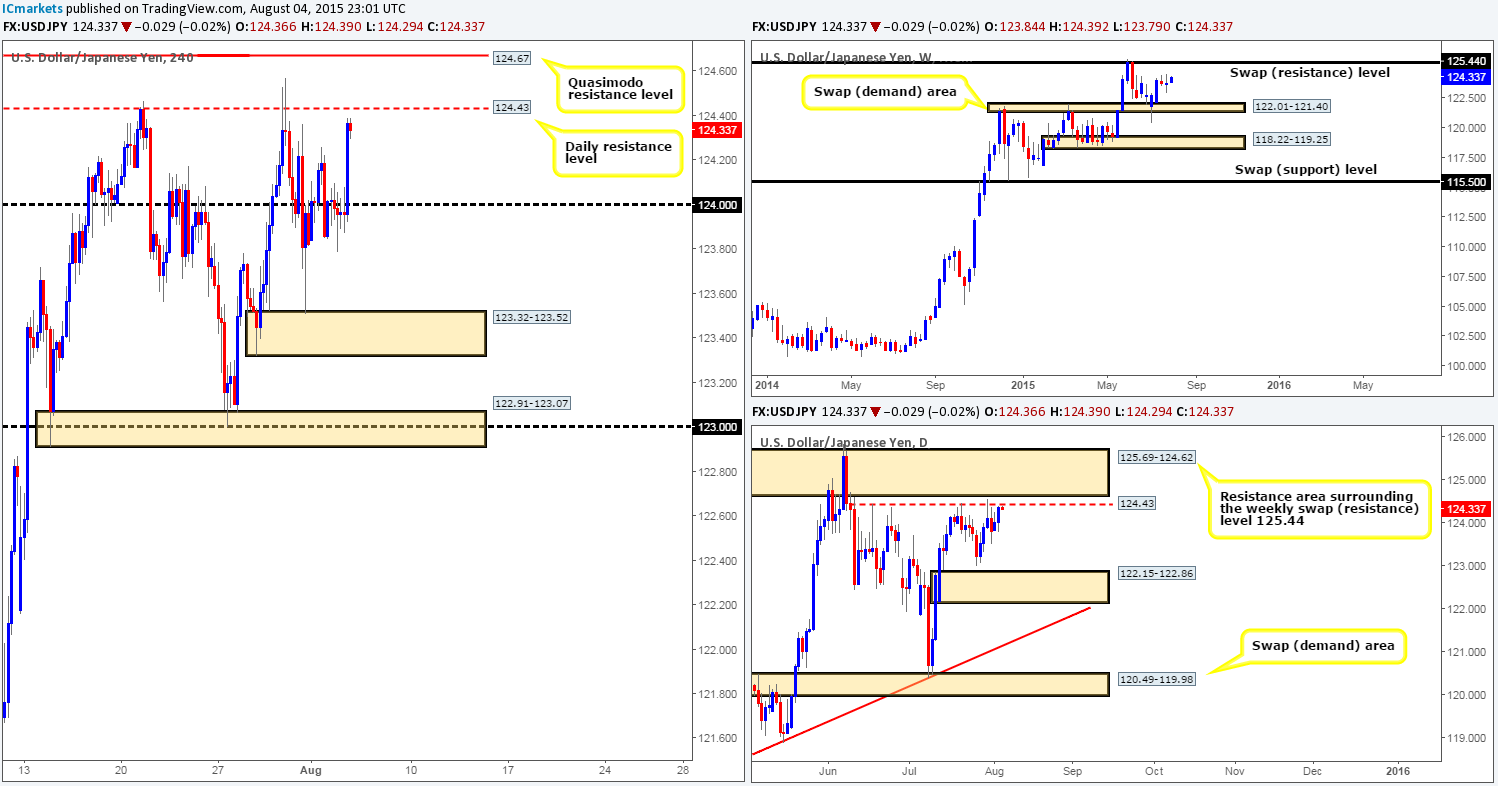
The USD/JPY pair spent much of yesterday’s sessions teasing the underside of 124.00. Offers were holding strong here until a burst of strong bids came in at 123.95 pushing price back up to just below daily resistance at 124.43. On the subject of the daily timeframe, one can see how each time price reacted to the above said resistance level; selling pressure here weakened. With that, we feel a breakout higher is likely going to be seen soon up to the daily resistance area at 125.69-124.62, which will likely lead to prices attacking the 4hr Quasimodo resistance barrier coming in at 124.67 (positioned just within the aforementioned daily resistance area).
Shorting from this 4hr Quasimodo level is certainly a valid trade in our book. Nonetheless, for the trade to be confirmed, we would need to see lower timeframe selling strength form at this level, since let’s not forget that there is room currently being seen for a further push north on the weekly timeframe up to a weekly swap (resistance) level at 125.44, so trade carefully here guys!
Levels to watch/ live orders:
- Buys: Flat (Stop loss: N/A).
- Sells: 124.67 [Tentative – confirmation required] (Stop loss: dependent on where one confirms this level).
USD/CAD:
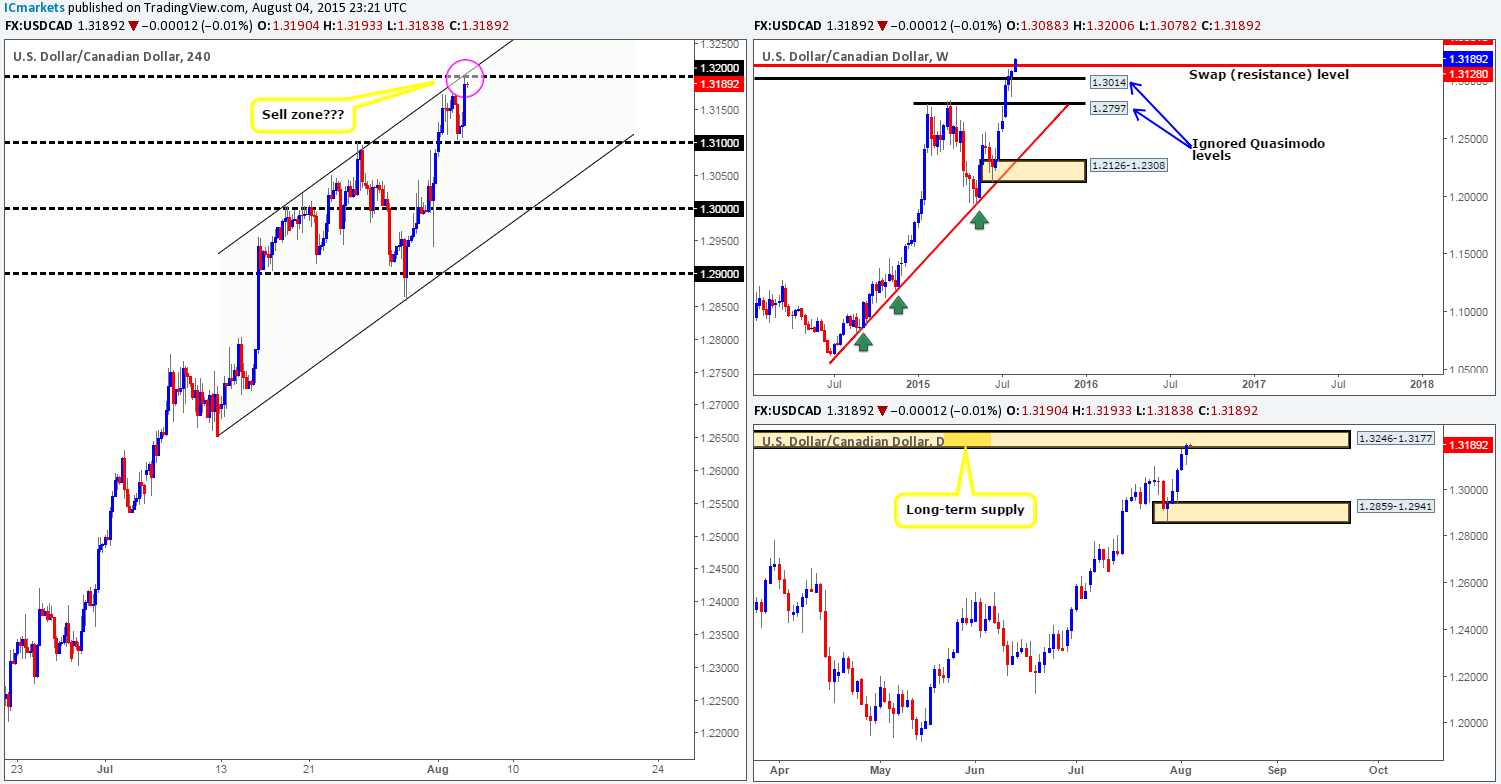
Working our way from the top-down this morning, we can see that price is currently trading above a weekly swap (resistance) level, which could, if the buyers remain strong here, attract further buying up to another weekly swap (resistance) level at 1.3381. Daily timeframe action on the other hand, shows that the buyers and sellers are battling it out within a long-term daily supply area at 1.3246-1.3177.
Moving down to the 4hr timeframe, shows us that price is now teasing the underside of the round number 1.3200, which, as you can see, also converges nicely with the upper band of an ascending 4hr channel extended from the low 1.2652 and high 1.3023. This – coupled with price trading within daily supply at the moment makes this a nice place to look for shorts into this market in our opinion. However, a short from 1.3200 will potentially only be for a small intraday bounce, since the USD/CAD is in one almighty uptrend right now, and, as just mentioned above, has just recently closed above a major weekly resistance level. Therefore, we are going to approach this short trade with caution and only enter should we see corresponding lower timeframe confirmation with a clear take-profit target(s).
Levels to watch/ live orders:
- Buys:Flat (Stop loss: N/A).
- Sells: 1.3200 [Tentative – confirmation required](Stop loss: dependent on where one confirms this level).
USD/CHF:
Mid-way through yesterday’s London morning session, the bulls were seen pressing forward, chopping their way through offers sitting at 0.9700 and gravitating towards a small 4hr supply area seen at 0.9793-0.9778, which also connects with the upper limit of a 4hr ascending channel taken from the low 0.9155 and high 0.9414. This – coupled with the fact that price is not only trading very close to a weekly swap (resistance) level at 0.9796, but is also seen teasing the underside of a daily supply zone at the moment with downtrend confluence (1.0239) at 0.9861-0.9775, makes this an incredibly confluent area to have noted on your watchlist.
However, considering that the 4hr supply zone is so small and the round number 0.9800 is lurking just above, we are expecting a fakeout higher before any sell-off is seen. As such, we have decided to only enter here should lower timeframe confirmation be seen, as this should avoid any unnecessary losses incurred from either a violated zone or a fakeout.

Levels to watch/ live orders:
- Buys: Flat (Stop loss: N/A).
- Sells:0.9793-0.9778 [Tentative – confirmation required] (Stop loss: dependent on where one confirms this area as a fakeout higher is expected).
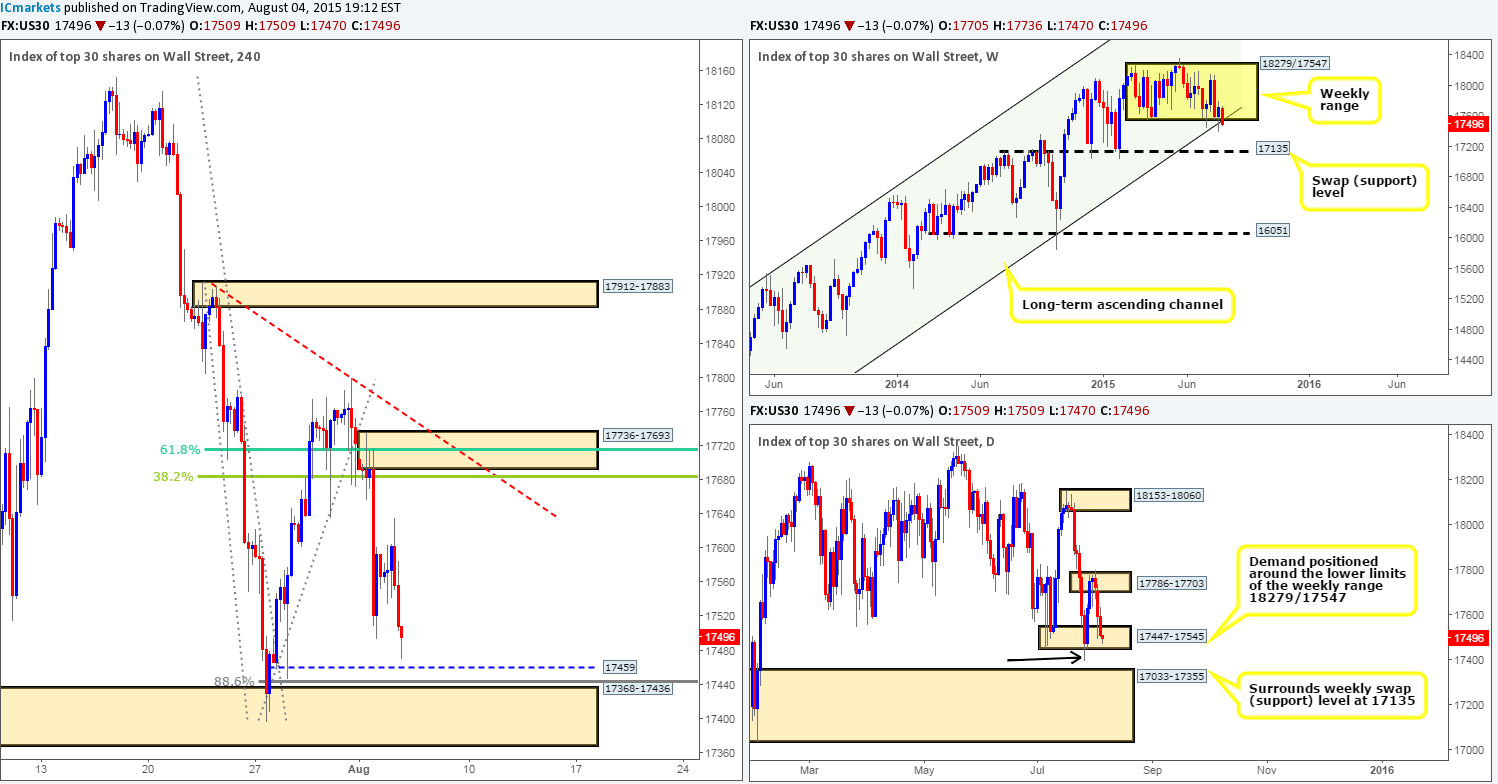
DOW 30:
Going into the U.S open, we can see that the DOW index tumbled from17365, which consequently placed price within touching distance of a small 4hr Quasimodo support level coming in at 17459. This level – together with a deep Fibonacci support of 88.6% at 17445, and a 4hr demand area positioned just below at 17368-17436, forms a nice base area in which to look to buy from.
The higher timeframes, however, are telling a completely different story. Weekly price action shows that the weekly range floor at 17547 appears to really be struggling at the moment. In the event that this weakness persists, we could see prices drop down to connect with a weekly swap (support) level at 17135. Regarding thedaily timeframe, however, price is currently trading within daily demand at 17447-17545 – great for buys, huh? Not necessarily. Check out the tail marked with a black arrow at 17396, this move likely took out a huge amount of bids sitting at this area, thus weakening this barrier and potentially clearing the path south down towards daily demand at 17033-17355 (surrounds the aforementioned weekly swap [support] level).
Therefore, with the higher timeframes indicating further selling is possible, buying from the 4hr Quasimodo support level at 17549 is just too risky for our liking. There are so many trade opportunities out there, and trading ones that echoes uncertainty according to our trade plan is best left on the back burner.
Levels to watch/ live orders:
- Buys: Flat (Stop loss: N/A).
- Sells:Flat (Stop loss: N/A).
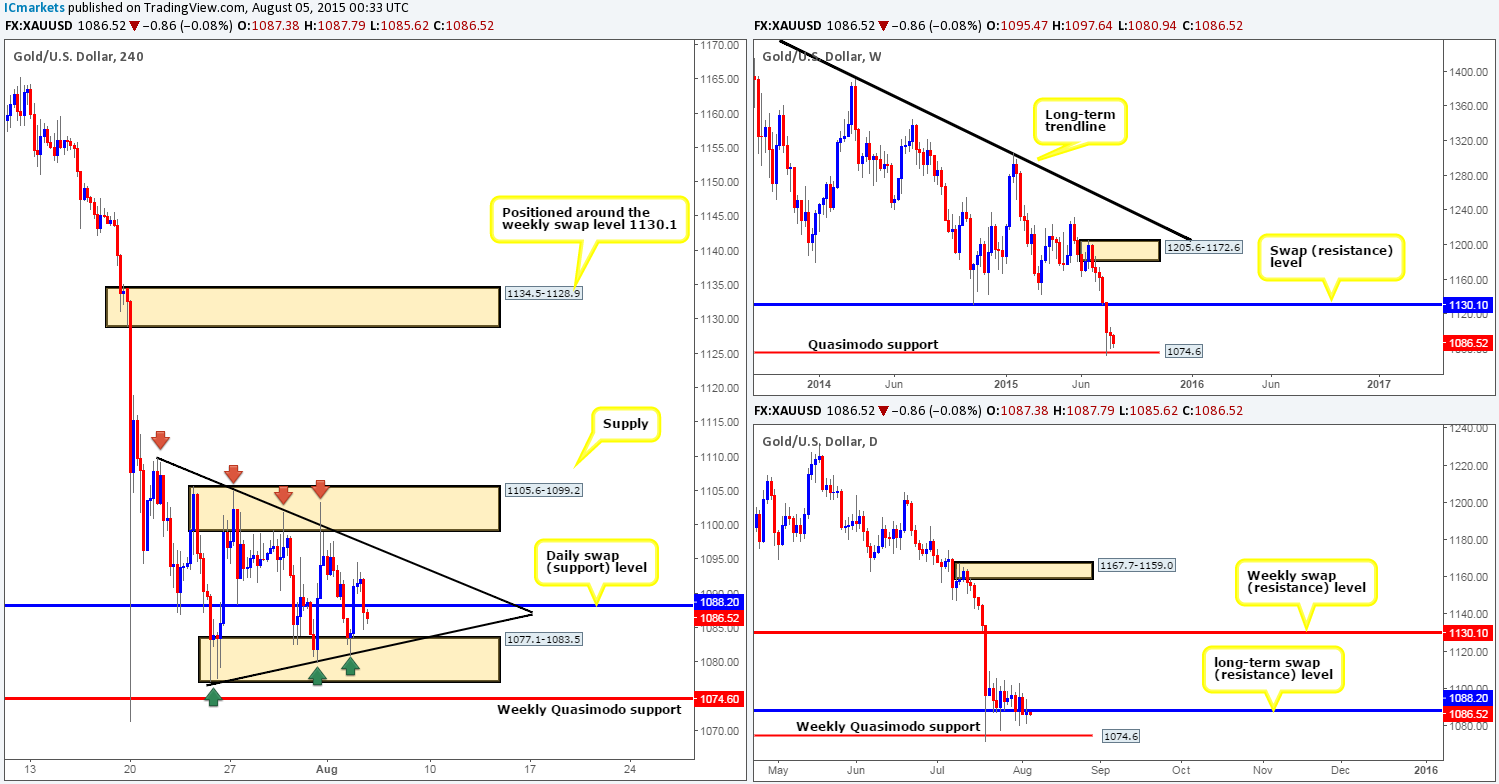
XAU/USD: (Gold)
Beginning from the top this morning, we cansee that price remains hovering above the weekly Quasimodo support level at 1074.6 with very little buying interest being seen at the moment. Meanwhile on the daily timeframe, price is seen trading just below a long-term swap (resistance) level at 1088.2, which, if holds, may encourage more sellers to join in and push prices back down to the aforementioned weekly Quasimodo support level.
Slipping down to the 4hr timeframe, it is clear thatprice is still compressing within a 4hr symmetrical triangle (high: 1109.8 low:1071.2), that boasts extra support from 4hr demand at 1077.1-1083.5 and 4hr supply at 1105.6-1099.2.
Given that the higher timeframe picture is not showing much in the way of direction at present (see above in bold), we are going to keep our objective simple today, in that we’re only going to be looking to trade small intraday bounces off of the limits of the aforementioned 4hr symmetrical triangle that has held so well over the past two weeks. Fakeouts above/below these two colliding barriers are likely. Therefore, lower timeframe confirming price action will be needed before we’d consider entering into a position.
Levels to watch/ live orders:
- Buys: Watch for buying opportunities at the ascending trendline taken from the low 1071.2 (confirmation required).
- Sells: Watch for selling opportunities at the descending trendline taken from the high 1109.8 (confirmation required).


