A note on lower timeframe confirming price action…
Waiting for lower timeframe confirmation is our main tool to confirm strength within higher timeframe zones, andhas really been the key to our trading success. It takes a little time to understand the subtle nuances, however, as each trade is never the same, but once you master the rhythm so to speak, you will be saved from countless unnecessary losing trades. The following is a list of what we look for:
- A break/retest of supply or demand dependent on which way you’re trading.
- A trendline break/retest.
- Buying/selling tails – essentially we look for a cluster of very obvious spikes off of lower timeframe support and resistance levels within the higher timeframe zone.
- Candlestick patterns. We tend to only stick with pin bars and engulfing bars as these have proven to be the most effective.
EUR/USD:
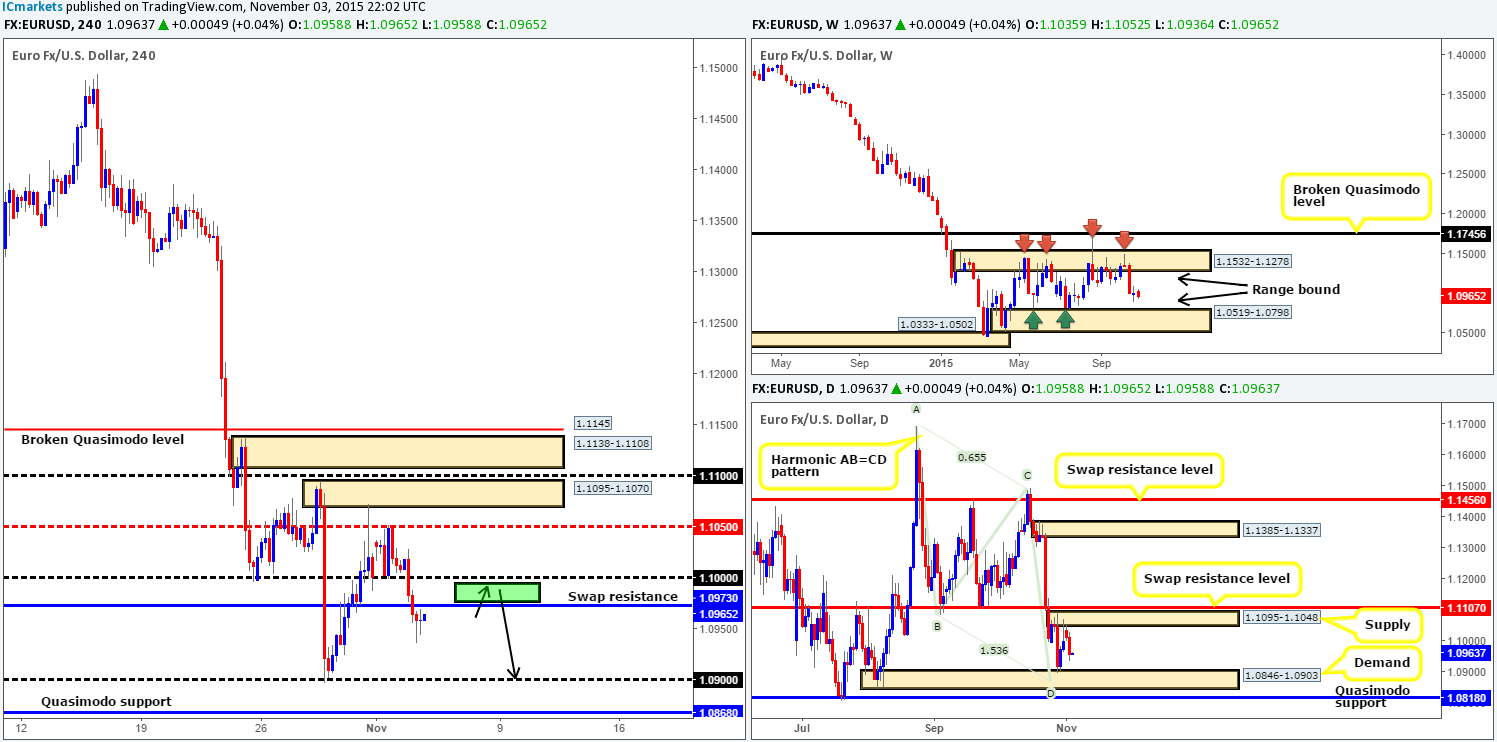
Going into Yesterday’s London open, the EUR pair suffered as sellers drove this market to fresh weekly lows of 1.0936. Consequent to this, bids at both the large psychological support 1.1000 and the the swap support (now resistance) level at 1.0973 were taken out.
Now, this recent downside move has potentially opened the gates to a short trade today. Should we see price successfully retest the 1.0973/1.1000 area, together with a lower timeframe confirming signal, we would have no hesitation in placing a sell order in this market, targeting psychological support 1.0900.
In support of this trade, the weekly chart shows room for prices to continue lower down to range demand coming in at 1.0519-1.0798, along with the daily chart also showing room to move down towards demand drawn from 1.0846-1.0903 (converges with an AB=CD pattern seen within at 1.0875). In fact, 1.0900, our take-profit target, lines up perfectly with the top-side of this daily demand area!
Levels to watch/live orders:
- Buys: Flat (Stop loss: N/A).
- Sells:1.0973/1.1000 [Tentative – confirmation required] (Stop loss: dependent on where one confirms this area).
GBP/USD:
Like the EUR/USD, the GBP/USD also suffered going into London trade yesterday. However, from this market we can see that instead of remaining bearish into close like the EUR did, Pound Sterling rebounded beautifully from the closely-linked swap support levels at 1.5384/1.5373, forcing price back up to the day’s open 1.5415.
Given the above, we are effectively in the same boat as we were yesterday! The only difference we see now is there is possibly less bids to take out to move this market lower. With that, much of our analysis will be similar to the previous…
In that the GBP is still loitering at the underside of weekly supply coming in at 1.5658-1.5425, and with price still showing bearish intent below the swap resistance barrier 1.5484(despite yesterday’s indecision candle), we remain in favor of lower prices. Nevertheless, as we noted yesterday, although there is clear room on both the weekly and daily charts to move lower, there are multiple support structures looming below current price on the 4hr chart.Once/if psychological support 1.5400 and the closely-linked swap support levels at 1.5384/1.5373 are taken out, we’d then be confident selling this market on any retest (confirmation would still be required) seen.

Levels to watch/ live orders:
- Buys: Flat (Stop loss: N/A).
- Sells: Watch for bids to be consumed around 1.5384/1.5373 and then look to trade any retest seen at this area (confirmation required).
AUD/USD:
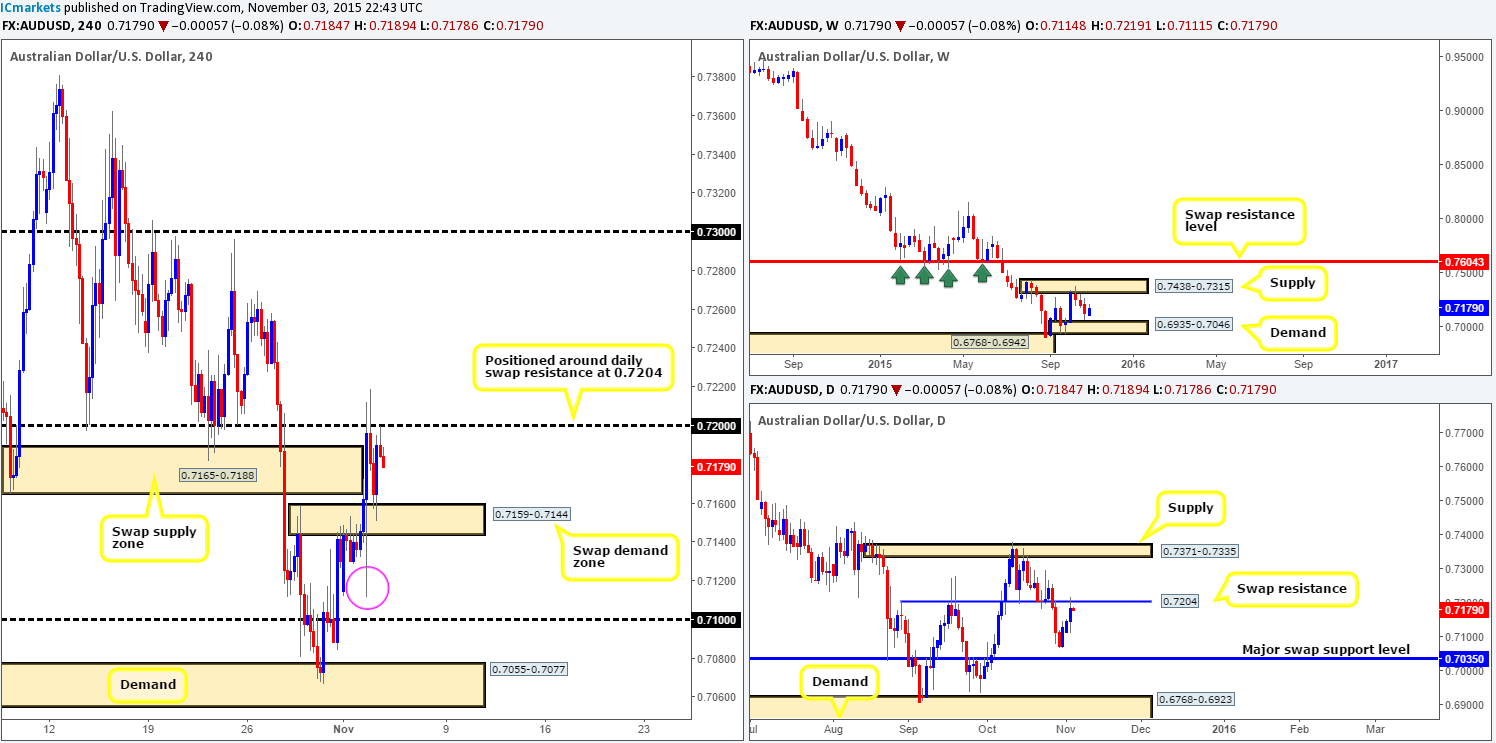
The aftermath of the RBA decision yesterday certainly put an end to the sluggish tone we witnessed during Monday’s trade. Price quickly touched lows of 0.7111 and then proceeded to aggressively advance north. This, as you can see, took out both supply (now acting demand) at 0.7159-0.7144, and also a swap supply area above it at 0.7165-0.7188, before rebounding from the 0.7200 region.
Given that price is now effectively trading mid-range between 0.7200 and the swap demand zone at 0.7159-0.7144 right now, where do we see this market heading to today? Well, the weekly shows price also trading mid-range between supply at 0.7438-0.7315 and demand drawn from 0.6935-0.7046. However, down on the daily chart, we can see that Aussie is now flirting with the underside of a swap resistance level coming in at 0.7204.
With the above in mind, here is what we have noted down so far:
- A short from 0.7200 today would be ideal, but it seems, at the time of writing, we may have missed the boat from this level already. In the event a small pullback is seen today though, we’d consider a sell from here if the lower timeframes showed sellers coming into the market.
- Should the Aussie continue to drive lower from current prices, we’d then be looking for a break below the swap demand zone mentioned above at 0.7159-0.7144. We say this not only because of what we are seeing on the daily timeframe right now (see above), but also because below this area, we see a clear path down to psychological support 0.7100. The low printed during the RBA shenanigans yesterday likely cleared a truckload of demand/bids from the market (pink circle) thus creating free space to run south.
Levels to watch/ live orders:
- Buys:Flat (Stop loss: N/A).
- Sells:0.7200 [Tentative – confirmation required] (Stop loss: dependent on where one confirms this level) watch for bids to be consumed around 0.7159-0.7144 and then look to trade any retest seen at this area (confirmation required).
USD/JPY:
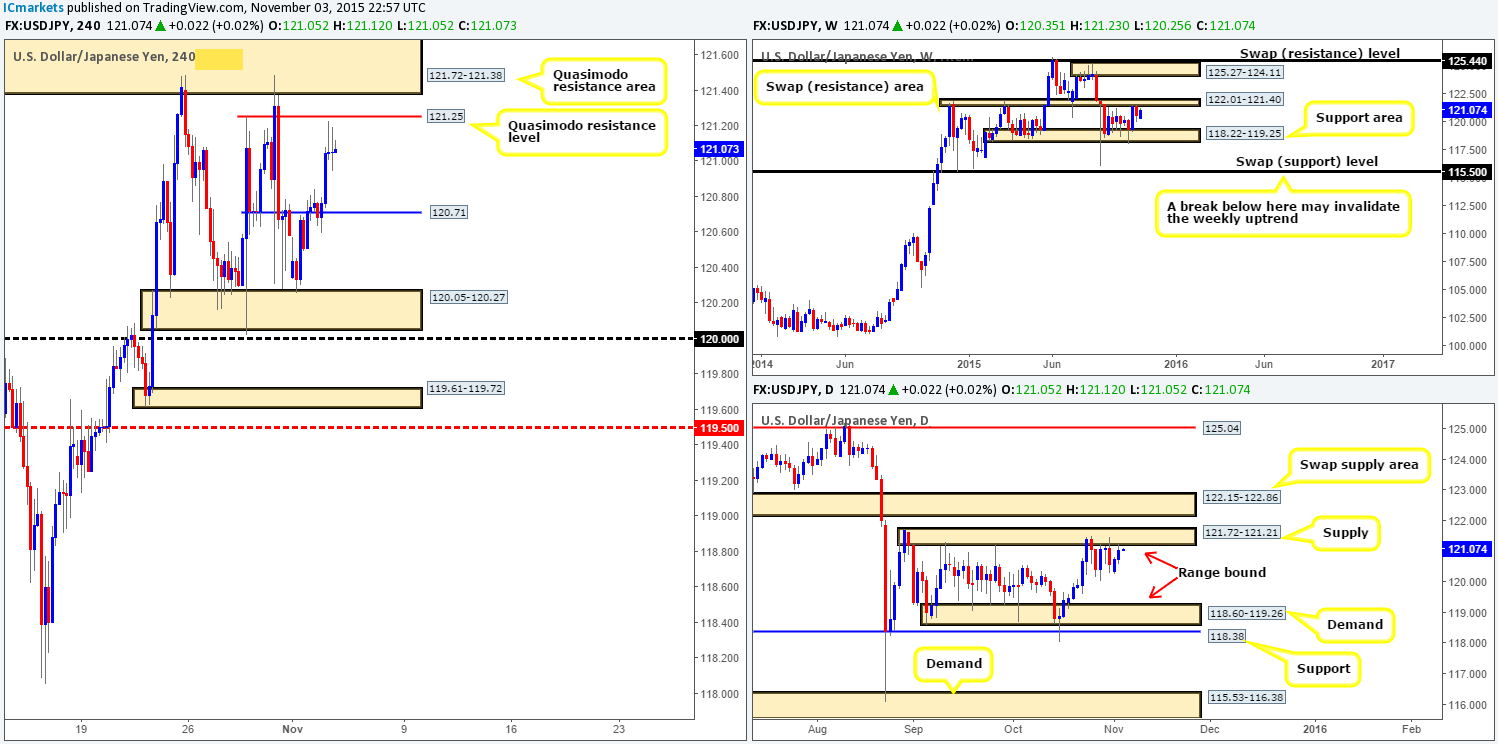
For those who read our previous report (http://www.icmarkets.com/blog/tuesday-3rd-november-daily-technical-outlook-and-review/), you may recall that we mentioned to keep an eye out for potential longs from 120.71, as at that time it was being retested as support. As can be seen from the chart, price reacted nicely from this level during trade yesterday and advanced north up to the just below 121.25 – a Quasimodo resistance level.
In view of price now trading just below a clear resistance zone, followed closely by the Quasimodo resistance area above it at 121.72-121.38, our team is certainly in favor of shorts today. What also made our decision easy was the fact that due to the recent advance north, price is now trading just below both a weekly range resistance area at 122.01-121.40, and a daily range supply coming in at 121.72-121.21. Therefore, to sum up, we have our eye on both 121.25 and the 121.72-121.38 area for possible (confirmed) shorts today.
Levels to watch/ live orders:
- Buys: Flat (Stop loss: N/A).
- Sells: 121.25 [Tentative – confirmation required] (Stop loss: dependent on where confirms this level) 121.72-121.38 [Tentative – confirmation required] (Stop loss: dependent on where confirms this area).
USD/CAD:
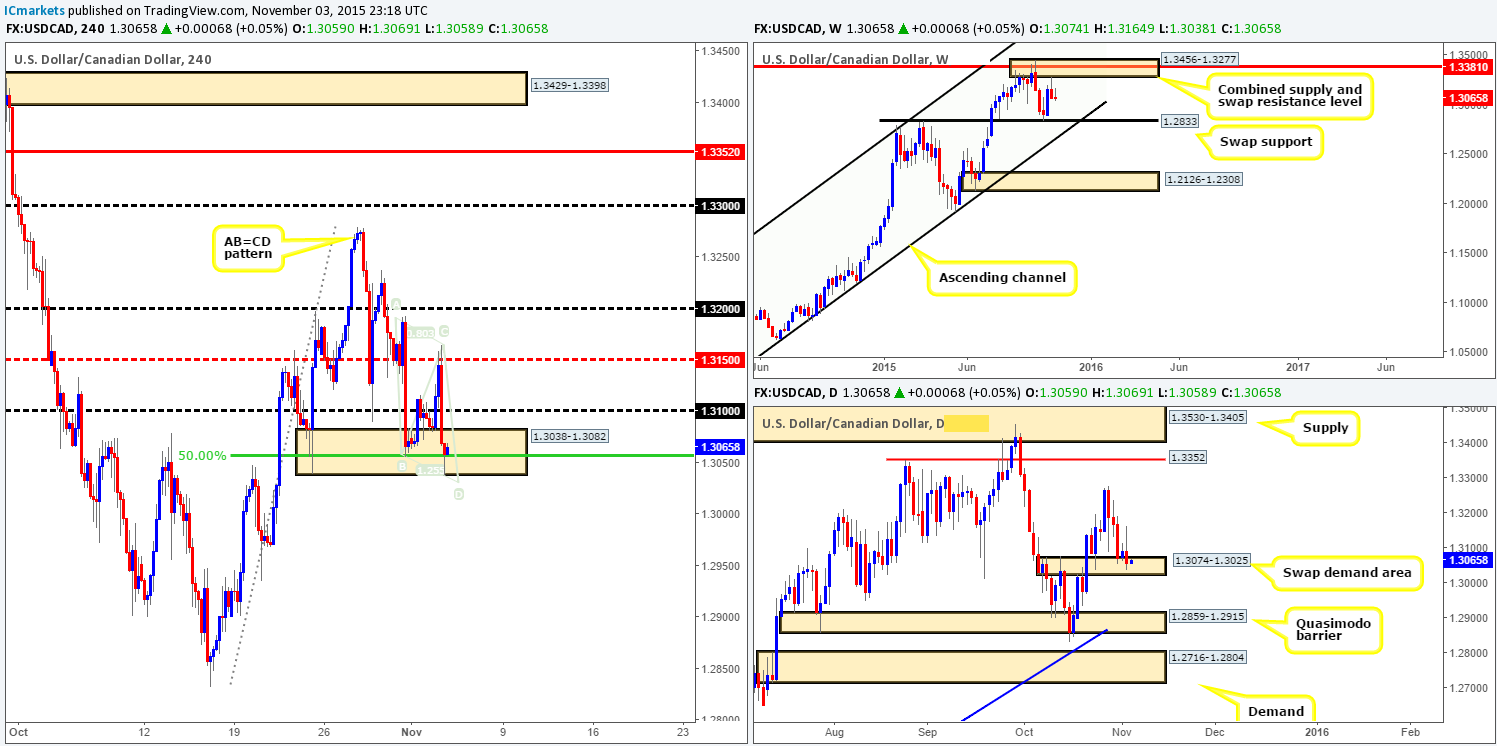
Following on from our previous report (http://www.icmarkets.com/blog/tuesday-3rd-november-daily-technical-outlook-and-review/), we mentioned that we were targeting mid-level resistance 1.3150 as our second take-profit area from the long we took on Friday at 1.3059. As you can see, price hit this area yesterday and we proceeded to close a further 30% of our position. Following this, however, the floor was removed from this market and price dropped like a rock, surpassing psychological support 1.3100 and driving deep into demand drawn from 1.3038-1.3082, consequently closing the remaining 20% of our position at breakeven.
‘As one door closes another one opens’ as they say. Notice that price has chalked up another AB=CD bull pattern that bottoms out just below the above said demand at 1.3029. This – coupled with the converging daily swap (demand) zone seen at 1.3074-1.3025 and the 50.0% Fibonacci support at 1.3055 could be enough to bounce price into profit.
The only drawback to this trade is the weekly timeframe shows room for price to continue lower from supply at 1.3456-1.3277 down to the swap support at 1.2833. Therefore, for us to be confident risking capital here, we’d need to see lower timeframe support hold firm, thus confirming bullish strength exists.
Levels to watch/ live orders:
- Buys:1.3038-1.3082 [Tentative – confirmation required] (Stop loss: dependent on where one confirms this area as a fake lower could be seen here).
- Sells:Flat (stop loss: N/A).
USD/CHF:
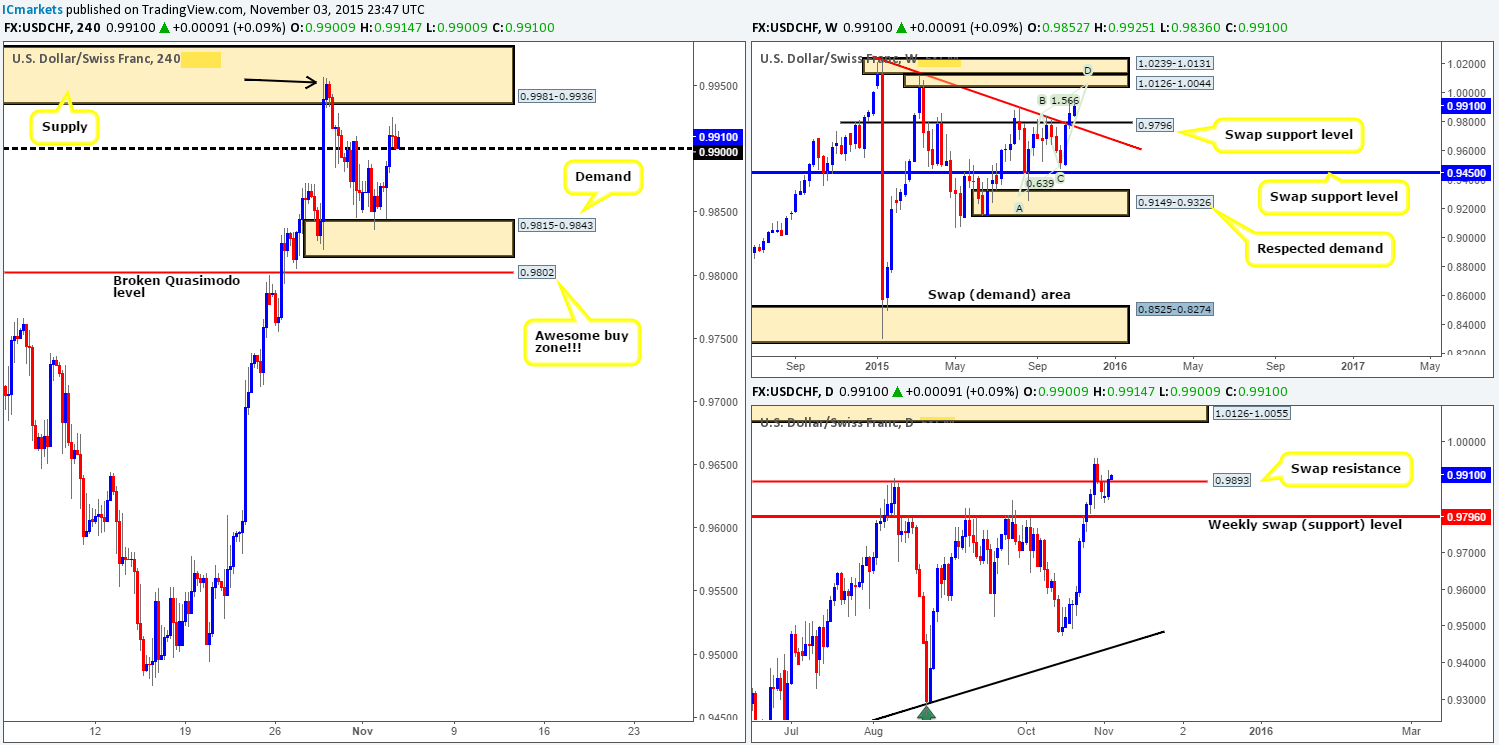
Starting from the top this morning, we can see that the weekly bulls continue to press forward following the close above the swap resistance level at 0.9796. From this angle, we can see a clear run north up to a stacked area of supply coming in at 1.0239-1.0131/1.0126-1.0044. In addition to this formation, we also see a nice-looking AB=CD Harmonic pattern completing around 1.0046, thus forming one heck of a sell zone to keep an eye on!
Lower down on the daily timeframe, price recently close back above a swap resistance level at 0.9893. Assuming that this close is legit and the buyers hold ground here, we may, given enough time, see an advance north up to supply visible at 1.0126-1.0055.
Turning our attention to the 4hr timeframe, however, the recent push north from demand at 0.9815-0.9843 yesterday forced price to close above psychological resistance 0.9900, which is currently being retested as support.
Supposing that 0.9900 does indeed continue to hold firm today, we might, just might see a continuation move north today into supply at 0.9981-0.9936. Last Wednesday’s high 0.9957 (black arrow) likely took out a significant amount of offers within this zone, thus potentially opening up the path further north up to the almighty psychological resistance 1.0000 i.e. PARITY!
Therefore, given all of the above, today’s spotlight will be firmly focused on 0.9900 today for confirmed longs into this market, and we’ll be looking to take full profits around the 1.0000 figure.
Levels to watch/ live orders:
- Buys: 0.9900 [Tentative – confirmation required] (Stop loss: dependent on where one confirms this level).
- Sells:Flat (Stop loss: N/A).
DOW 30:
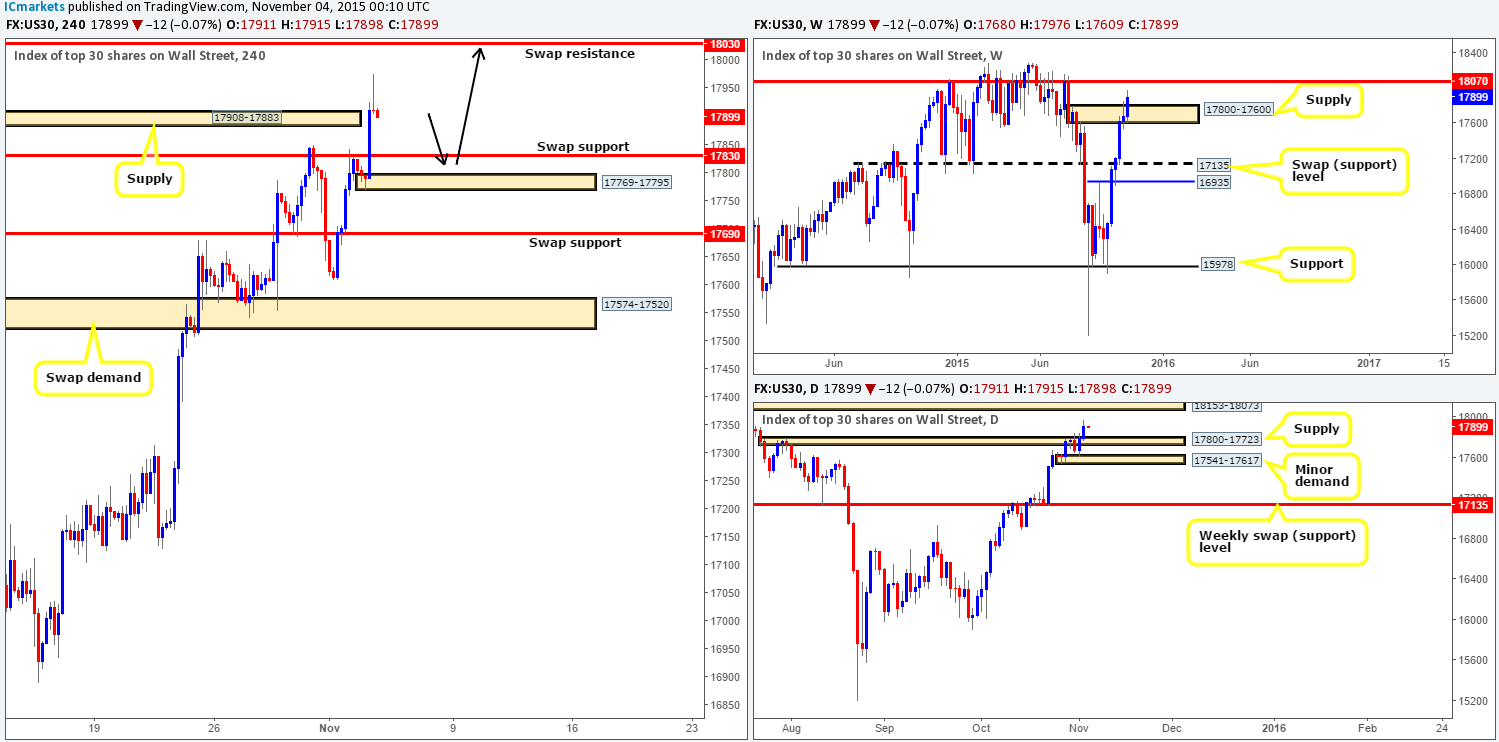
Based on recent price action, the DOW saw an increase in value amid trade yesterday, notably going into the U.S. open. Consequent to this move, price demolished both a swap resistance (now support) level at 17830, and a small supply zone drawn from 17908-17883 with a vicious-looking bearish pin.
This – coupled with both the weekly supply at 17800-17600 and its partner supply on the daily timeframe at 17800-17723 now consumed, we feel this market is headed higher today/this week. For now though, entering long in this market might not be the best path to take since risk/reward, at least for us, would not be in our favor.
What we’re looking for is a pullback to either swap support at 17830, or the demand area lurking just below it at 17769-17795 before we’d consider longs (black arrows). The risk/reward from either area is extremely good, since our take-profit target would be the swap resistance barrier at 18030 (sits just below the weekly resistance level 18070 and daily supply at 18153-18073).
Levels to watch/ live orders:
- Buys: 17830 [Tentative – confirmation required] (Stop loss: dependent on where one confirms this level) 17769-17795 [Tentative – confirmation required] (Stop loss: dependent on where one confirms this area).
- Sells:Flat (Stop loss: N/A).
XAU/USD: (Gold)
Kicking off this morning’s analysis with a quick look at the weekly timeframe reveals Gold continues to plummet south, and as a result has now crossed swords with demand drawn from 1098.6-1121.7. Moving down to the daily timeframe shows that this recent decent took out bids sitting around the Quasimodo support (now resistance) level at 1127.7, and is, at the time of writing, being retested as resistance.
Looking at the 4hr timeframe, one can see just how steep yesterday’s sell-off was! Both demand (now supply) at 1130.0-1133.6 and the swap support (now resistance) barrier at 1123.1 were taken out during this onslaught. This resulted in price hitting and rebounding from a Quasimodo support level taken from 1115.2. Economists believe that the recentlosses seen on Gold are due to renewed concerns surrounding the Fed rate hike.
So, technically, we have the weekly chart indicating that longs are favorable, daily action portending that a further decline could be on the cards (see above) and 4hr action now closing in on swap resistance level at 1123.1. It is a tricky one for sure! For us personally, we’re not going to make any decisions until we see how price behaves at the 1123.1 region. A close above could suggest strength from weekly demand and indicate a long trade (on a confirmed retest of this number as support) is possible back up to swap supply coming in at 1130.0-1133.6. Meanwhile, a rejection of this barrier may allow us to short (with confirmation), as Gold may drive back down to Quasimodo support at 1115.2, followed closely by another Quasimodo support at 1110.9 (sits just above daily demand at 1098.6-1108.6).

Levels to watch/live orders:
- Buys:watch for offers to be consumed around 1123.1 and then look to trade any retest seen at this level (confirmation required).
- Sells: 1123.1 [Tentative – confirmation required] (Stop loss: dependent on where one confirms this level).


