EUR/USD:
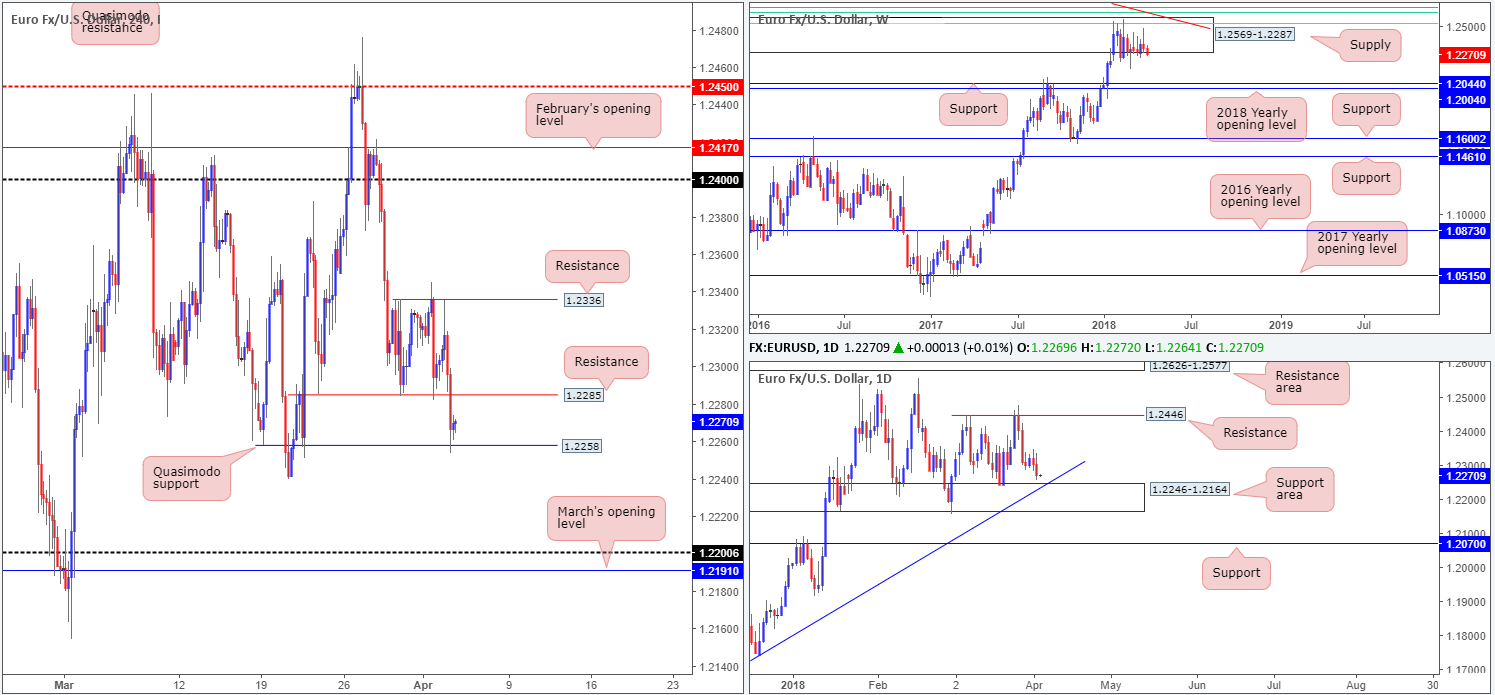
In early London hours, Tuesday’s action crossed swords with intraday resistance on the H4 timeframe at 1.2336 and staged a somewhat dominant selloff. Likely influenced by a mixture of softer Eurozone PMIs, lackluster German retail sales and a stronger greenback, the move cleared H4 support at 1.2285 and ended the day shaking hands with a H4 Quasimodo support plotted at 1.2258.
Over on the weekly timeframe, price recently exited beyond the lower edge of a major-league weekly supply at 1.2569-1.2287, which has held price captive since late January. Downside targets from this angle fall in around the weekly support band at 1.2044, shadowed closely by the 2018 yearly opening level at 1.2004. Daily flow, on the other hand, is seen trading within striking distance of a daily support area coming in at 1.2246-1.2164 that communicates beautifully with a long-term daily trend line support etched from the low 1.0569. This area, like the weekly supply zone, has also capped market action since late January.
Potential trading zones:
As highlighted in Tuesday’s report, we favor the H4 Quasimodo support mentioned above at 1.2258 for potential buying opportunities. Although it has printed a reaction, traders still need to be prepared for a possible fakeout of this line since it is positioned just ten or so pips north of the daily support area at 1.2246-1.2164 (think H4 bullish pin bar through the current H4 Quasimodo that taps the top edge of the daily support area).
The ultimate take-profit target from here can be set at 1.2446: a daily resistance. Short-term targets, however, can be found at 1.2285: a recently turned H4 resistance, followed by the H4 resistance at 1.2336 and then 1.24.
Data points to consider today: EUR CPI flash estimate y/y; US ADP non-farm employment change at 1.15pm; US ISM non-manufacturing PMI; FOMC member Mester speech.
Areas worthy of attention:
Supports: 1.2258; 1.2246-1.2164; daily trend line support; 1.2044; 1.2004.
Resistances: 1.2285; 1.2336; 1.2446; 1.24; 1.2569-1.2287.
GBP/USD:
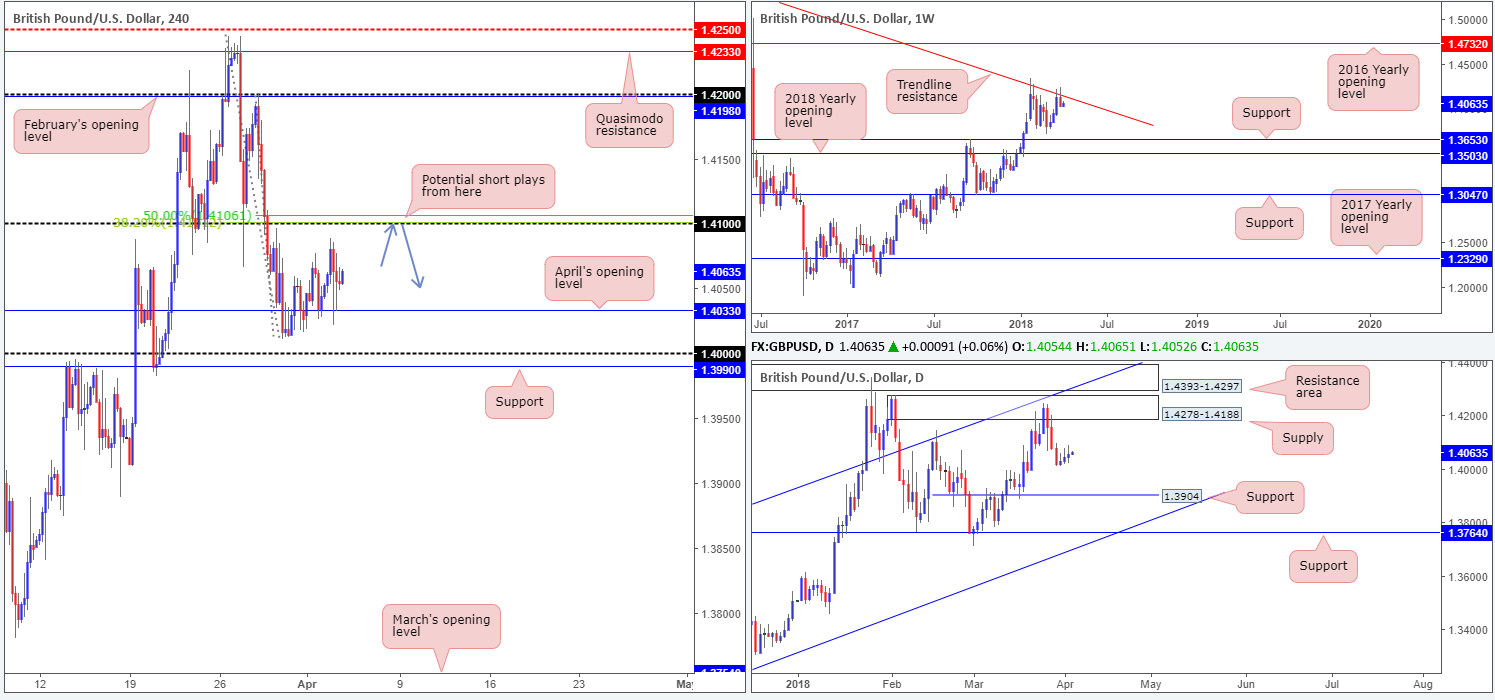
The British pound is marginally stronger against its US counterpart this morning, as H4 price established firm intraday support priced in at 1.4033: April’s monthly opening level. The next port of call, should the bulls continue to bid the market higher, can be seen at the 1.41 handle, shadowed closely by a H4 50.0% resistance value carved in at 1.4106 and a H4 38.2% Fib resistance at 1.4101.
While intraday traders hone in on a potential move north, weekly movement is seen trading blows with a weekly trend line resistance taken from the high 1.5930. Having seen this line force price in excess of 500 pips lower in early January, there’s a chance we may see history repeat itself here. On the other side of the spectrum, daily flows trade in no man’s land between a daily supply zone at 1.4278-1.4188 and a daily support at 1.3904.
Potential trading zones:
In light of the weekly trend line resistance, the team’s spotlight is firmly pressed on the 1.41 neighborhood today. Coupled with the highlighted converging Fibonacci ratios, a reaction from this region is likely. Ideally, the initial take-profit zone can be set at the aforementioned April’s opening level, followed then by the key figure 1.40. A break of this line could open up the path south to the daily support mentioned above at 1.3904. As you can see, there is potential for huge gains!
Data points to consider today: UK construction PMI; US ADP non-farm employment change at 1.15pm; US ISM non-manufacturing PMI; FOMC member Mester speech.
Areas worthy of attention:
Supports: 1.4033; 1.40; 1.3990; 1.3904.
Resistances: 1.41; 1.4278-1.4188; weekly trend line resistance.
AUD/USD:
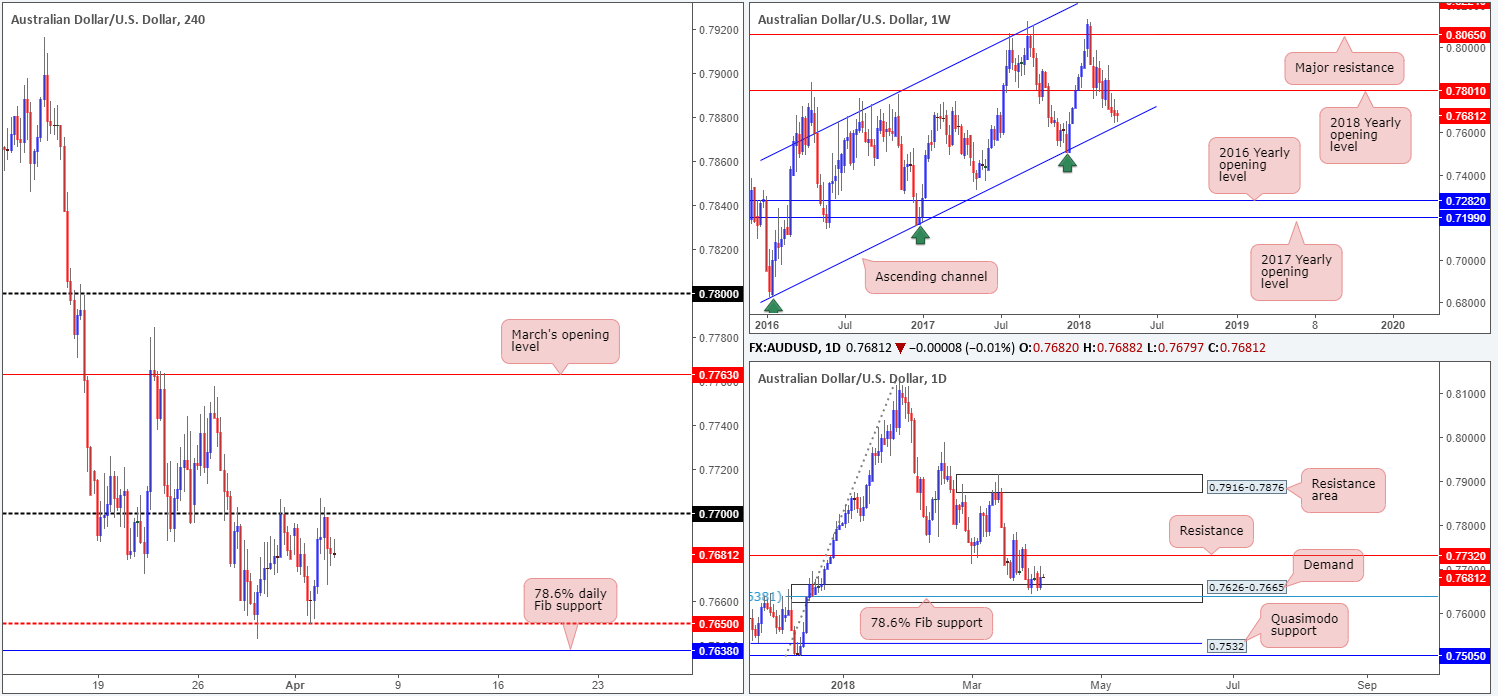
The Reserve Bank of Australia, as expected, left interest rates unchanged on Tuesday. Price action barely acknowledged the announcement, consequently printing a mild M5 indecision candle.
Overall movement throughout the sessions, though, did see the AUD/USD pare a large portion of Monday’s losses and touch base with the 0.77 handle. Since March 28, the H4 candles have been busy carving out a consolidation between 0.77 and a nearby H4 mid-level support at 0.7650. This range, as you can probably see, is bolstered by a daily demand based at 0.7626-0.7665. Of particular interest here is that this zone houses a 78.6% daily Fib support at 0.7638 and converges with a long-term weekly channel support taken from the low 0.6827.
Potential trading zones:
In a similar fashion to Tuesday’s report, the team has noted the 78.6% daily Fib support at 0.7638 (seen a touch beneath the current H4 mid-level support) as a potential buy zone, given it is positioned within the current daily demand and intersects beautifully with the weekly channel support mentioned above.
This could prove to be a reasonably big move seeing as we’re utilizing higher-timeframe areas. Therefore, stop-loss orders would be best placed 5-10 pips beyond the current daily demand with the initial upside target falling in at 0.77, followed by a daily resistance drawn from 0.7732.
Data points to consider today: Australian retail sales m/m and building approvals m/m; China’s Caixin services PMI; US ADP non-farm employment change at 1.15pm; US ISM non-manufacturing PMI; FOMC member Mester speech.
Areas worthy of attention:
Supports: 0.7650; 0.7638; 0.7626-0.7665; weekly channel support.
Resistances: 0.77; 0.7732.
USD/JPY:
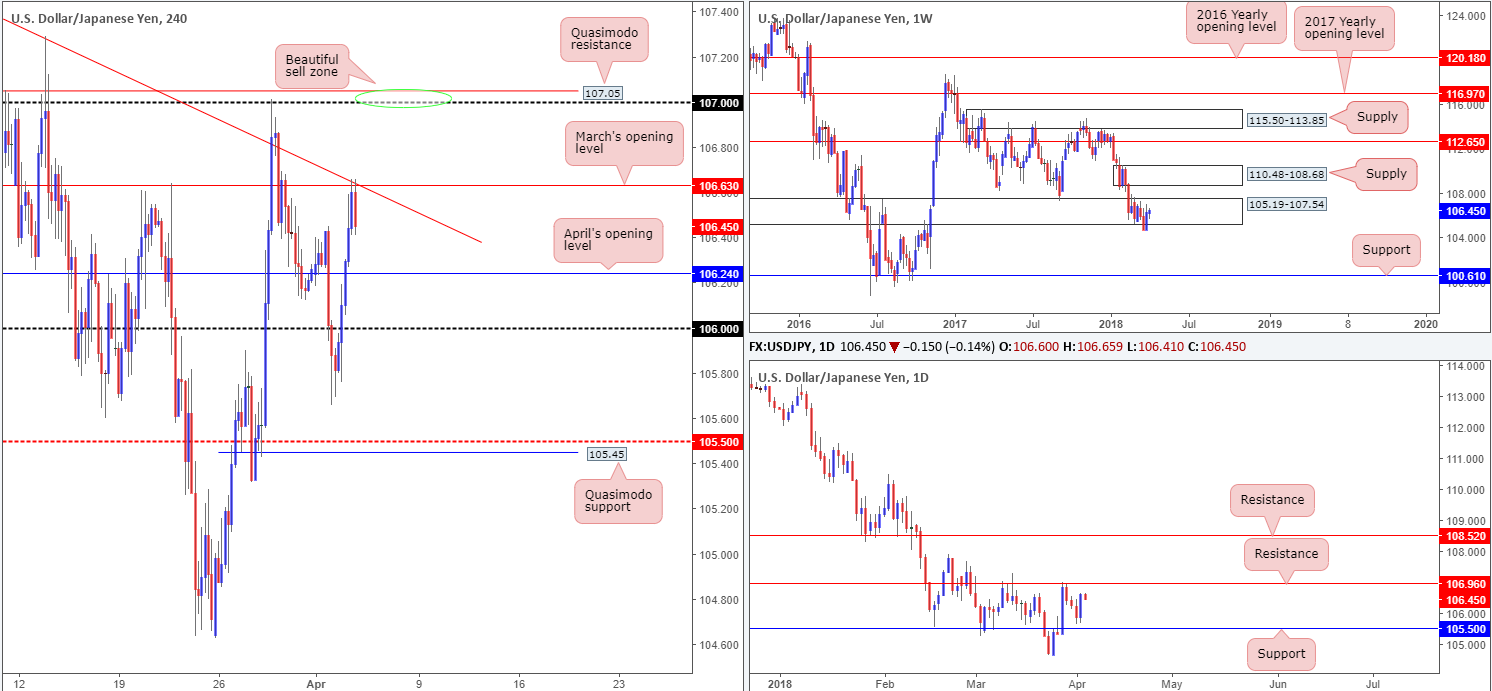
Firmly breaking a three-day bearish phase, the USD/JPY entered positive territory during Tuesday’s segment. Underpinned by strong US treasury yields and a risk-on tone emphasized in US equities, multiple H4 tech resistances were breached until we reached March’s opening level at 106.63/H4 trend line resistance extended from the high 107.67.
Daily price chalked up a near-full-bodied bullish candle in recent trade, bringing the unit up to within shouting distance of a daily resistance level pegged at 106.96. Weekly price, on the other hand, is a little trickier to read. Following a decisive close beneath 105.19-107.54, the USD/JPY rotated back to the upside last week in strong fashion. At this point in time, it is difficult to know what whether 105.19-107.54 is a support or resistance area!
Potential trading zones:
Although there is a chance H4 price could potentially target April’s opening level at 106.24 as its next support, selling this market is not something we would label high probability at this time. Instead, the focus is on the 107 handle seen overhead. Not only is it shadowed closely by a H4 Quasimodo resistance at 107.05, it is also positioned nearby the daily resistance at 106.96.
With stop-loss orders sited above the apex of the H4 Quasimodo formation, at 107.29, a move down to at least March’s opening level is likely on the cards – plenty of room for partial profit taking!
Data points to consider today: US ADP non-farm employment change at 1.15pm; US ISM non-manufacturing PMI; FOMC member Mester speech.
Areas worthy of attention:
Supports: 106.24.
Resistances: 106.63; H4 trend line resistance; 107; 107.05; 106.96.
USD/CAD:
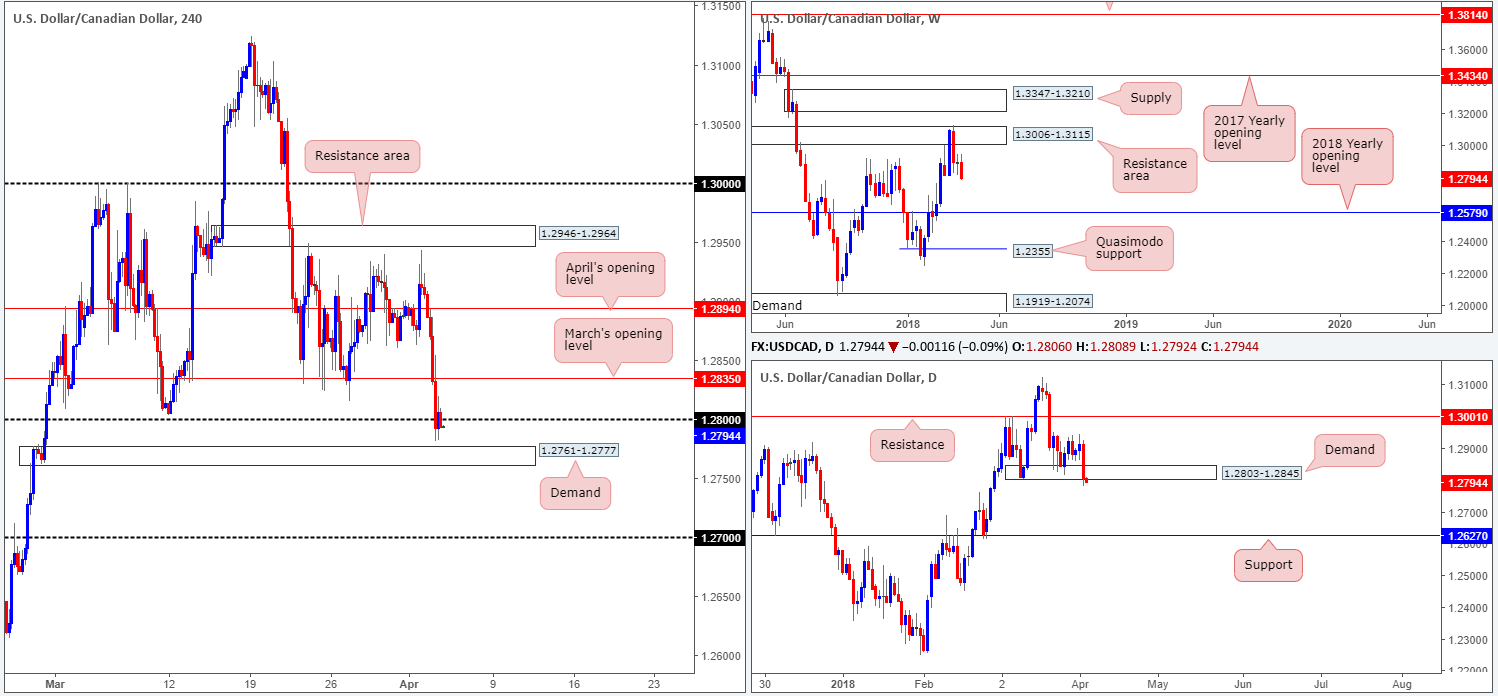
The USD/CAD weakened in aggressive fashion on Tuesday, influenced by a report out of Bloomberg stating that US President Trump was looking to reach a deal on NAFTA in two weeks. Clearly benefiting the Canadian dollar, the pair crunched its way through March’s opening level at 1.2835 on the H4 timeframe and shook hands with 1.28.
Yesterday’s move further confirmed the weekly timeframe’s bearish tone after it recently sold off from a weekly resistance area at 1.3006-1.3115. Continued selling from this point could eventually bring the unit down to as far south as the 2018 yearly opening level at 1.2579. Turning the focus over to the daily timeframe, we can see that recent movement has positioned the pair marginally beneath daily demand at 1.2803-1.2845. The next port of call beyond here can be seen in the shape of a daily support level at 1.2627.
Potential trading zones:
With 1.28 looking as though it is hanging on by a thread, the H4 demand area plotted nearby at 1.2761-1.2777 is likely going to be tested soon. Buying from here, given the position of price on the bigger picture, would be a chancy long, in our opinion. Instead, traders should consider waiting to see if H4 price can close beneath the noted H4 demand. This – coupled with a retest to the underside of the area that holds – would be enough evidence to suggest a short, targeting 1.27 as an initial take-profit zone.
Data points to consider today: US ADP non-farm employment change at 1.15pm; US ISM non-manufacturing PMI; FOMC member Mester speech; Crude oil inventories.
Areas worthy of attention:
Supports: 1.28/27; 1.2761-1.2777; 1.2803-1.2845; 1.2579.
Resistances: 1.2835; 1.3006-1.3115.
USD/CHF:
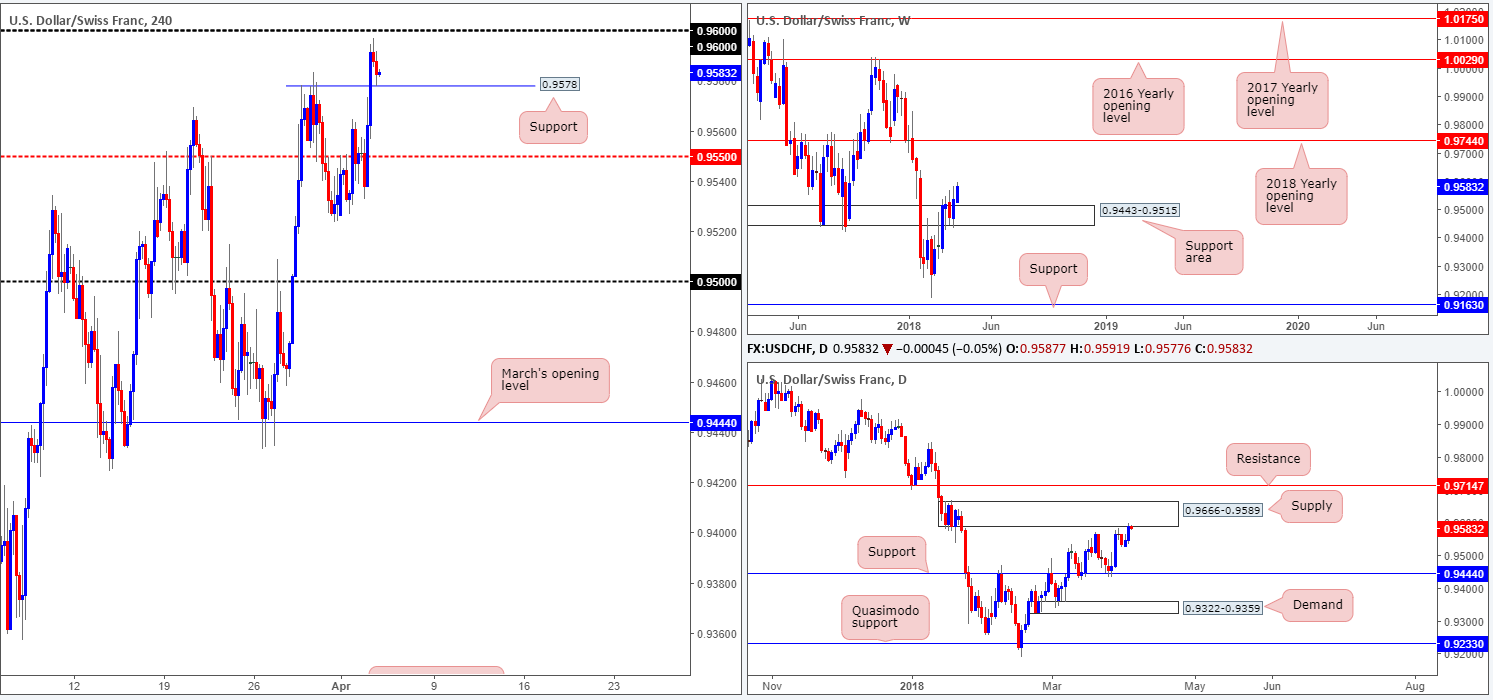
On the back of a robust US dollar on Tuesday, the USD/CHF extended Monday’s advance.
This, at least from a weekly perspective, should not really come as a surprise. Last week’s action established a base of support off of a weekly area marked at 0.9443-0.9515 in the shape of a strong-looking weekly bullish engulfing candle. Further buying from here could eventually lift things up to the 2018 yearly opening level positioned on the weekly timeframe at 0.9744. Although weekly price reflects a rather strong bullish tone, the picture currently painted on the daily timeframe echoes a slightly different environment. Daily price shows a solid daily supply base in play coming in at 0.9666-0.9589, which is sited just south of an interesting daily resistance level at 0.9714.
H4 action, on the other hand, is currently seen attempting to base a retest off of a recently broken H4 Quasimodo resistance level at 0.9578. Should price remain bid from here, the next area of concern on this scale can be seen at 0.96.
Potential trading zones:
Weekly traders looking to buy the recently formed weekly bullish engulfing candle may want to hold fire! Entering long into a substantial daily supply zone is not a trade we would label high probability, no matter what the weekly timeframe is indicating!
Intraday, however, longs could be a possibility at 0.9578, targeting a 20-pip move north to 0.96. Although this is a likely move, traders still need to bear in mind that by entering long from this angle you are effectively entering long into daily supply. Therefore, constant monitoring of the trade is recommended.
Data points to consider today: US ADP non-farm employment change at 1.15pm; US ISM non-manufacturing PMI; FOMC member Mester speech.
Areas worthy of attention:
Supports: 0.9578; 0.9443-0.9515.
Resistances: 0.96; 0.9666-0.9589; 0.9744; 0.9714.
DOW 30:
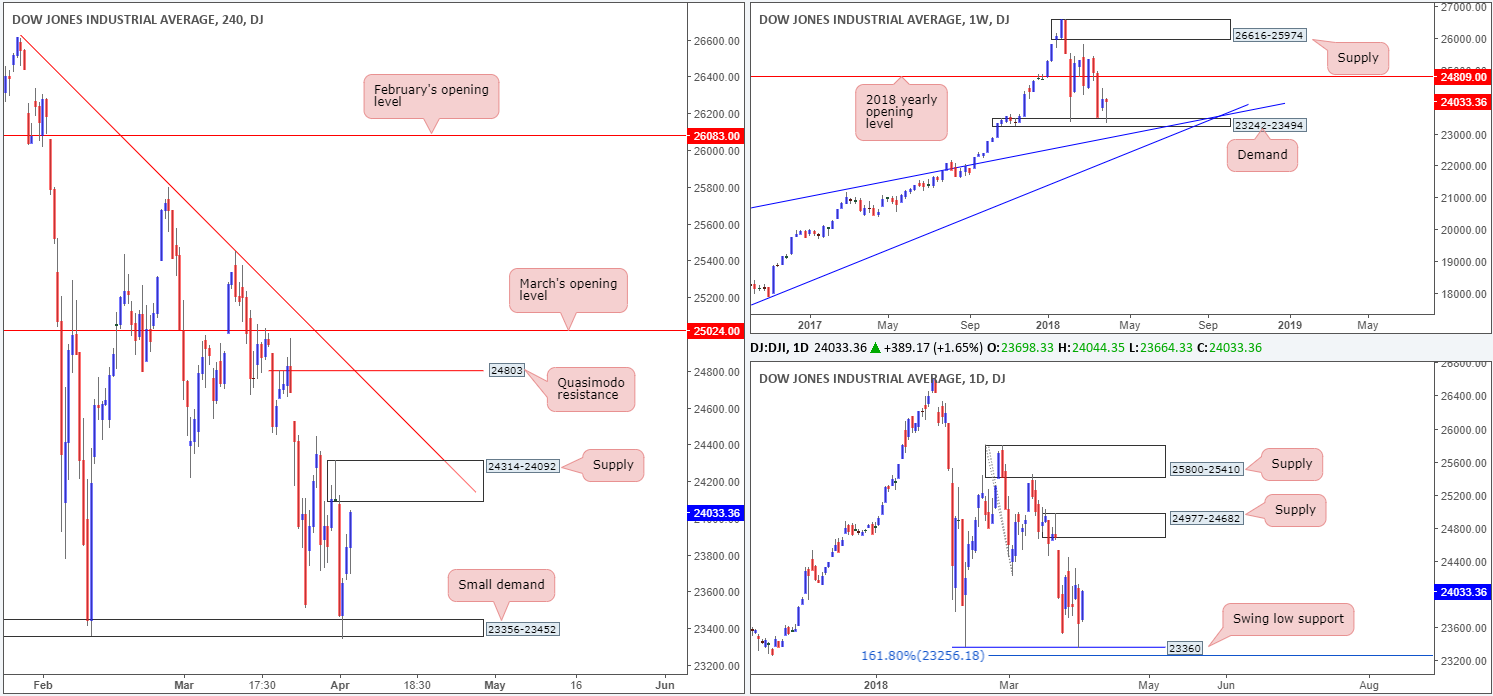
The Dow Jones Industrial Average opened on a strong footing on Tuesday, as investors attempted to shrug off trade fears. The move comes after a mild rejection off of a small H4 demand base at 23356-23452, and is now currently standing within striking distance of a H4 supply zone pegged at 24314-24092. This was a noted move to look out for in Tuesday’s analysis, so well done to any of our readers who managed to take advantage here.
Although the index now faces a possible rotation from the aforesaid H4 supply, there is potential for this market to stretch as far north as daily supply pegged at 24977-24682, which houses a 2018 yearly opening level printed on the weekly timeframe at 24809.
Potential trading zones:
Technically speaking, we feel price could potentially climb higher. However, traders likely remain fearful of any fresh trade actions US President Trump might announce, particularly following the announcement of retaliatory tariffs out of China.
Therefore, unless one is already long this market (stop-loss orders should be comfortably at breakeven at this point), we do not see much to hang our hat on at this time.
Data points to consider today: US ADP non-farm employment change at 1.15pm; US ISM non-manufacturing PMI; FOMC member Mester speech.
Areas worthy of attention:
Supports: 23356-23452; 23501; 23360; 23242-23494.
Resistances: 24314-24092; 24809; 24977-24682.
GOLD:
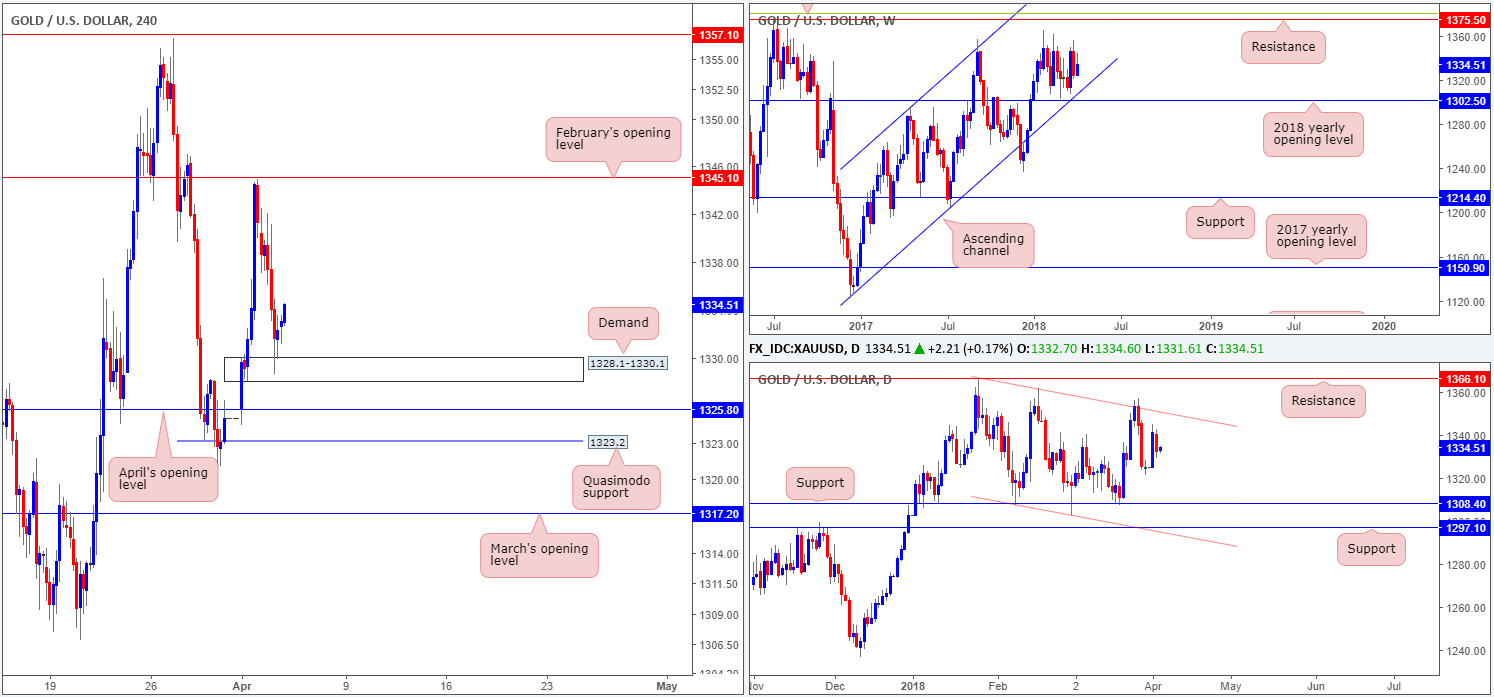
In recent sessions, the price of gold extended Monday’s bounce from the underside of February’s opening level on the H4 timeframe at 1345.1, and eventually crossed paths with a H4 demand at 1328.1-1330.1. This demand, formed on the break of the 29/03 high 1328.3, has rejected price beautifully and could, according to H4 structure, send the unit back up to February’s opening base line.
From another point of view, however, weekly price remains floating between the 2018 yearly opening level at 1302.5 (fuses closely with a long-term weekly channel support etched from the low 1122.8) and weekly resistance pegged at 1375.5/38.2% weekly Fib resistance at 1381.0. Meanwhile, daily action is seen basing just ahead of a daily channel resistance extended from the high 1366.0.
Potential trading zones:
Unless you’re comfortable entering long from current price, it appears we have missed the boat from the current H4 demand. The only alternative is to wait and see if H4 price pulls back and retests the said H4 demand, and prints a full or near-full-bodied H4 bull candle in response (the reason for the additional candle confirmation is to avoid a potential fakeout to April’s opening level seen nearby at 1325.8). This, in our technical view, would be sufficient enough to attempt a long, targeting 1345.1.
Areas worthy of attention:
Supports: 1328.1-1330.1; 1325.8; 1302.5; weekly channel support.
Resistances: 1345.1; 1375.5; daily channel resistance.
This site has been designed for informational and educational purposes only and does not constitute an offer to sell nor a solicitation of an offer to buy any products which may be referenced upon the site. The services and information provided through this site are for personal, non-commercial, educational use and display. IC Markets does not provide personal trading advice through this site and does not represent that the products or services discussed are suitable for any trader. Traders are advised not to rely on any information contained in the site in the process of making a fully informed decision.
This site may include market analysis. All ideas, opinions, and/or forecasts, expressed or implied herein, information, charts or examples contained in the lessons, are for informational and educational purposes only and should not be construed as a recommendation to invest, trade, and/or speculate in the markets. Any trades, and/or speculations made in light of the ideas, opinions, and/or forecasts, expressed or implied herein, are committed at your own risk, financial or otherwise.
The use of the site is agreement that the site is for informational and educational purposes only and does not constitute advice in any form in the furtherance of any trade or trading decisions.
The accuracy, completeness and timeliness of the information contained on this site cannot be guaranteed. IC Markets does not warranty, guarantee or make any representations, or assume any liability with regard to financial results based on the use of the information in the site.
News, views, opinions, recommendations and other information obtained from sources outside of www.icmarkets.com.au, used in this site are believed to be reliable, but we cannot guarantee their accuracy or completeness. All such information is subject to change at any time without notice. IC Markets assumes no responsibility for the content of any linked site. The fact that such links may exist does not indicate approval or endorsement of any material contained on any linked site.
IC Markets is not liable for any harm caused by the transmission, through accessing the services or information on this site, of a computer virus, or other computer code or programming device that might be used to access, delete, damage, disable, disrupt or otherwise impede in any manner, the operation of the site or of any user’s software, hardware, data or property.


