EUR/USD:
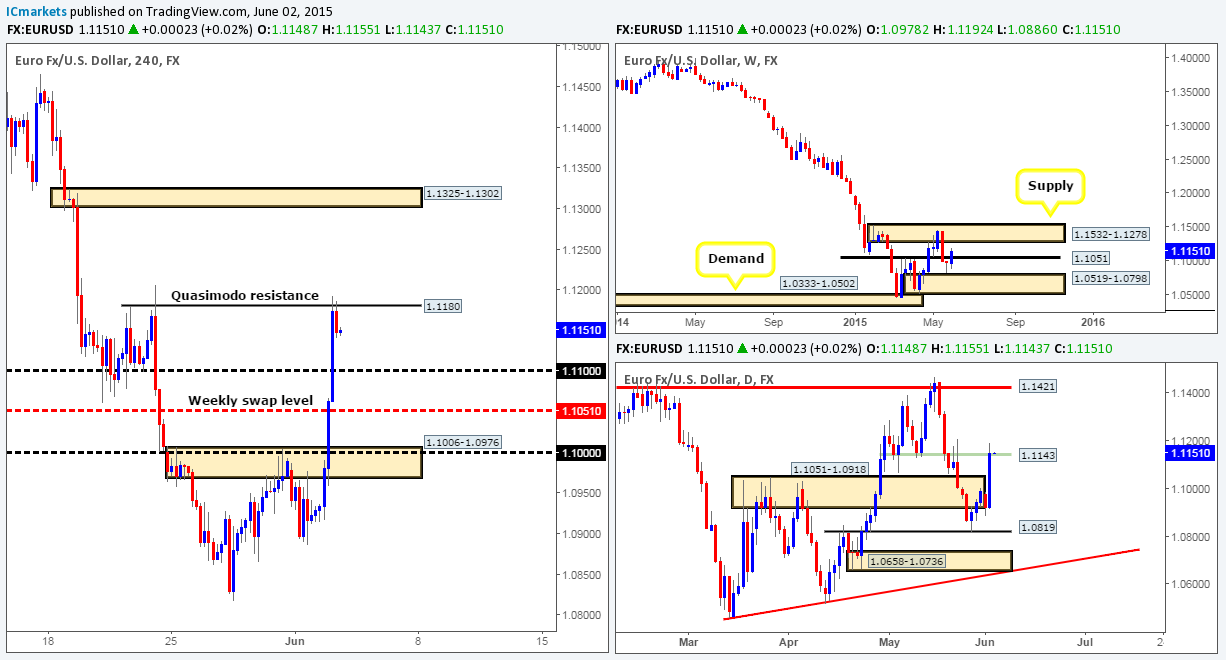
Weekly view – From a long-term standpoint, the trend on this pair is still southbound in our opinion, and will only change once price closes above the weekly supply area at 1.1532-1.1278.
Recent action, however, shows that the Euro broke above the weekly swap level 1.1051. This move has potentially set the stage for a continuation move towards the weekly supply area just mentioned above.
Daily view: The view from here reveals that price launched itself north yesterday, completely taking out the daily swap area at 1.1051-1.0918, and connecting with a daily swap level at 1.1143 going into the close.
4hr view: Yesterday’s fresh buying shows price surged above several 4hr technical levels, It was only once price shook hands with a 4hr Quasimodo resistance level at 1.1180 did we see any selling interest come into the market.
Given that price is trading around a daily swap level (1.1143) at the moment, it is quite possible that further selling could take place from the current 4hr Quasimodo resistance level down to the 1.1100 handle, or even to retest the weekly swap level 1.1051. So far though, we have yet to see any lower timeframe confirming price action around this 4hr Quasimodo barrier.
In the event that price continues marching north on the other hand, we may see a push above the 4hr Quasimodo resistance level, which could encourage an advance towards a fresh 4hr supply base sitting above at 1.1325-1.1302 (positioned within weekly supply at 1.1532-1.1278). Despite this, we’d only be interested in trading this move if price retested 1.1180 as support and showed lower timeframe strength entering the market such as, a trendline break, consumption of supply or simply a bullish candlestick pattern.
Levels to watch/live orders:
- Buys: Flat (Predicative stop-loss orders seen at: N/A).
- Sells: 1.1180 region [Tentative – confirmation required] (Predicative stop-loss orders seen at: dependent on where one confirms this area).
GBP/USD:
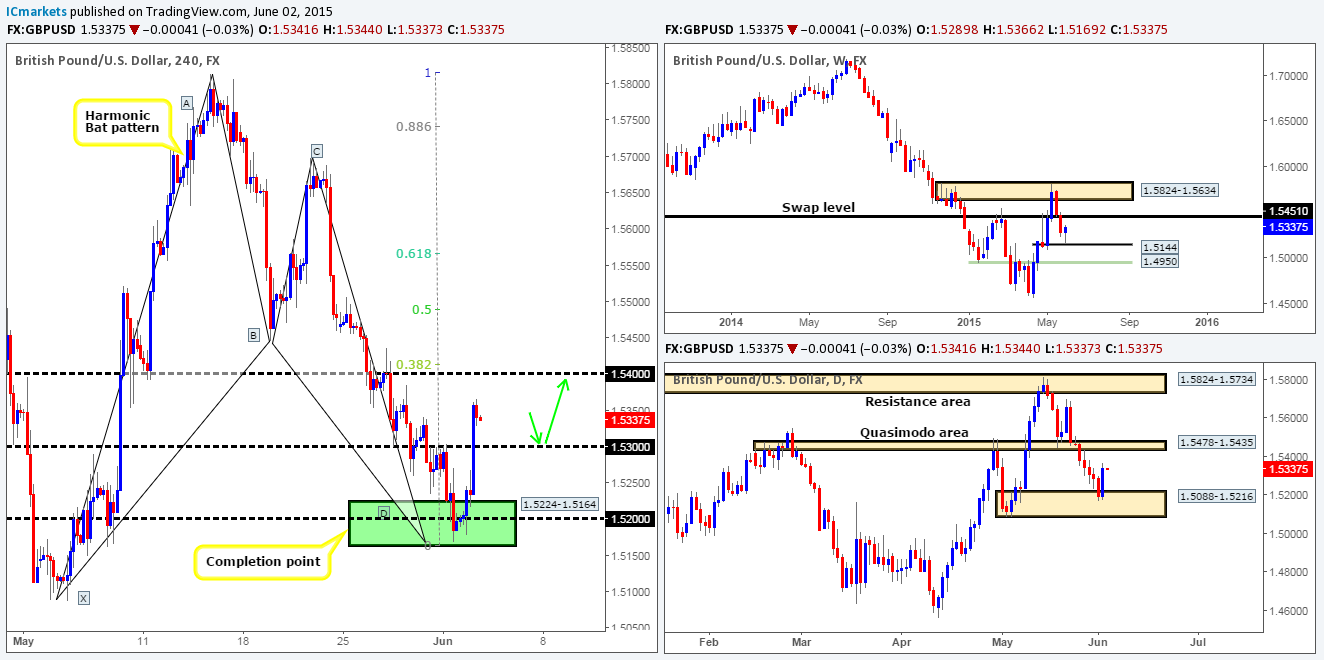
Weekly view – The weekly timeframe shows that active buying recently come into the market a few pips from above a weekly swap level positioned at 1.5144.Assuming that the buyers can continue with this tempo, it’s possible we may see price challenge the weekly swap level 1.5451, or given enough time, the weekly supply area seen just above it at 1.5824-1.5634.
Daily view: From this timeframe, we can see that price rebounded just beautifully from the daily demand area seen at 1.5088-1.5216 (surrounds the aforementioned weekly swap level), consequently taking back any losses incurred on Monday.
4hr view: For those who read our previous report on the GBP, you may recall that we placed a pending buy order at 1.5228, just above a 4hr Harmonic Bat completion area seen in green at 1.5224-1.5164 (located around the upper limits of the aforementioned daily demand area). As you can see, our order was filled on Monday, and is now in profit. We have already crossed the first barrier where we expected trouble – 1.5300, now we have our eye on the first take-profit area 1.5400 which converges with the Fibonacci retracement value 0.382 (A-D retracement), this will be where we will likely move our stop to breakeven. Following this, our final take-profit target will likely be set around the 1.5550 mark – the 0.618 Fibonacci retracement level.
Before price reaches our first take-profit area, however, it is possible we may see a retracement back down to retest 1.5300, which is something we have planned for. With that, 1.5300 will be a barrier we may consider adding to our current position should we see corresponding lower timeframe confirmation…
Levels to watch/ live orders:
- Buys: 1.5228 [Live] (Predicative stop-loss orders seen at: 1.5140) 1.5300 [Tentative – confirmation required] (Predicative stop-loss orders seen at: dependent on where one confirms this level).
- Sells: Flat (Predicative stop-loss orders seen at: N/A).
AUD/USD:
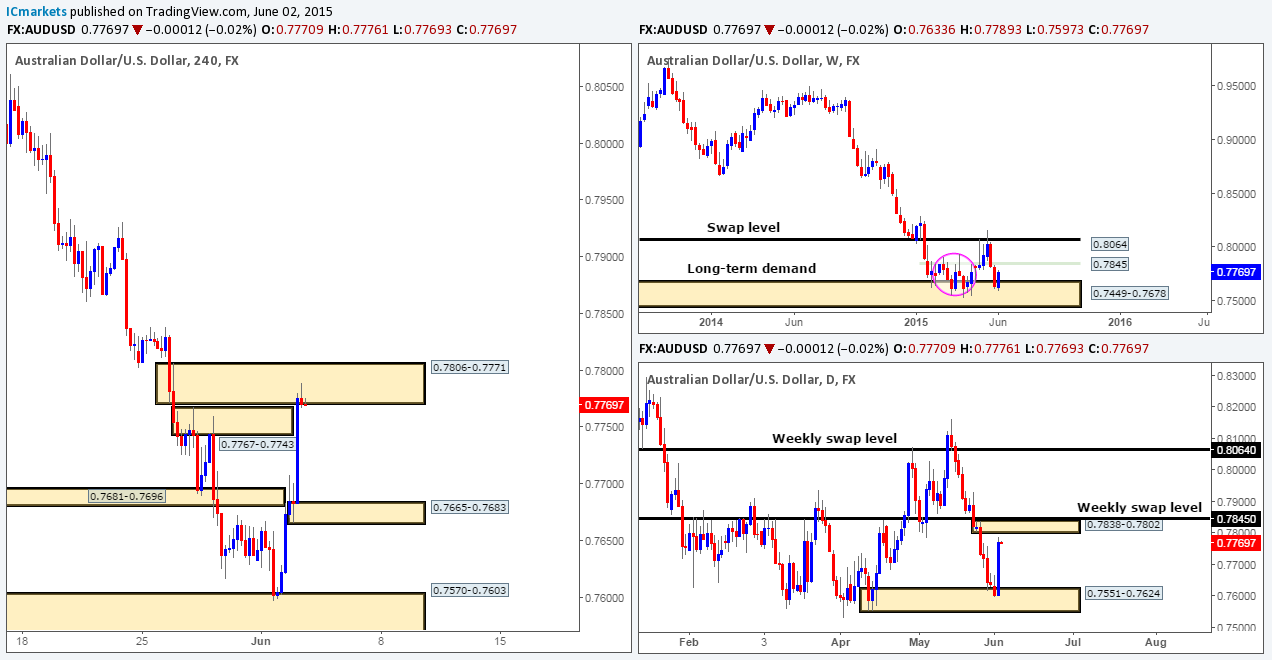
Weekly view – Long term, the trend on this pair is still southbound in our opinion, and will remain that way until we see a convincing push above 0.8064.
Current action on the other hand, shows that price is now trading from a long-term weekly demand area coming in at 0.7449-0.7678. Judging by the sloppy reaction seen (pink circle – 02/02/15-06/04/15) at this zone a few months earlier, however, things could potentially get messy here once again.
Daily view: The daily timeframe reveals that price launched itself north from a daily demand area at 0.7551-0.7624 during yesterday’s session. This, as you can see, forced the market to close (0.7770) just below a small daily supply zone coming in at 0.7838-0.7802.
4hr view: For those who read our previous report on this pair, you may recall that we had a live buy position in the market from 0.7605, set a few pips above the 4hr demand area 0.7570-0.7603. This trade was how we’d like all our trades to go! We took full profits at 0.7750 and netted a very cool 3.5 risk/reward.
Going forward, we see difficulty. Price has begun to stabilize within a 4hr supply area seen at 0.7806-0.7771, and does indeed look like a tasty place to short from. That said though, we may see price continue to rally from here to connect with the lower limit of the daily supply area at 0.7838-0.7802. Therefore, a fakeout above this 4hr supply area is quite possible, so be careful if you intend to short this zone. The best place, and really the only place we’d consider shorts right now is around 0.7845 – the weekly swap level (see weekly chart).
So, unless price connects with 0.7845 today (alert has been set), we have decided to place this pair on the back burner today, and see what price action offers us going into tomorrow’s sessions.
Levels to watch/ live orders:
- Buys: Flat (Predicative stop-loss orders seen at: N/A).
- Sells: Flat (Predicative stop-loss orders seen at: N/A).
USD/JPY:
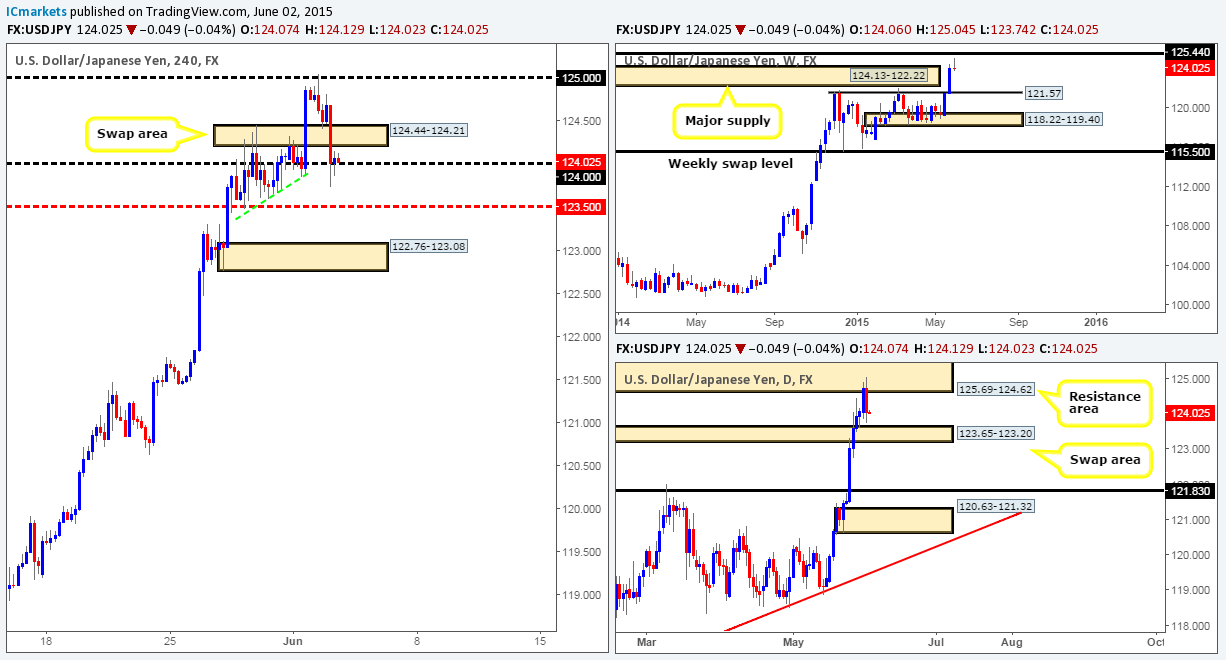
Weekly view – Essentially, the outlook on this pair remains positive. It is only once we see a close below the weekly swap level 115.50 will we be convinced the trend may be shifting.
Following the break above weekly supply at 124.13-122.22, active sellers seem to be entering the market forty pips from below a major weekly swap level coming in at 125.44. Should further selling be seen on this pair, we see very little supportive pressure coming into the market until 121.57 – a weekly swap level.
Daily view: The daily timeframe shows price is, as far as we can see, currently trading mid-range between a daily resistance area seen at 125.69-124.62 (surrounds the aforementioned weekly swap level) and a daily swap zone at 123.65-123.20.
4hr view: The USD/JPY pair, as you can see, sold off nicely from the 125.00 handle during yesterday’s sessions consequently taking out the 4hr swap area at 124.44-124.21, and aggressively testing the 124.00 handle.
Buying from 124.00 is not really something our team would be comfortable doing especially with potential 4hr resistance sitting just above at 124.44-124.21. With regards to selling, however, there may be a potential shorting opportunity setting up as we speak. The deep test of 124.00 has not really seen much strength so far, If price can retest the 4hr swap area 124.44-124.21 today, and we see lower timeframe confirmation, we would consider a short down to 123.50. Why 123.50? Well, take a look to the left at the green trendline. As price rallied we can see that spikes were sent south, this was likely pro money collecting unfilled buy orders to continue advancing north, thus once price returns to this area, which we believe it has, it will likely have little trouble slicing through whatever buy-side liquidity is left over in this compressed zone down to 123.50.
Levels to watch/ live orders:
- Buys: Flat (Predicative stop-loss orders seen at: N/A).
- Sells: 124.44-124.21 [Tentative – confirmation required] (Predicative stop-loss orders seen at: dependent on where one confirms this area).
USD/CAD:
Weekly view – Overall, the trend on this pair is still pointing north. A break below the weekly swap area 1.2034-1.1870 would be required to invalidate this bias. Current action, however, shows weakness forming around the weekly swap (resistance) level coming in at 1.2439.
Daily view: The rebound seen from the daily supply area at 1.2666-1.2565 extended lower during yesterday’s sessions, consequently attacking the lower limits of a daily swap (demand) area seen at 1.2464-1.2384.
4hr view: For those who read our previous report on this pair, you may recall we bailed at breakeven from a short (1.2509) at the 4hr supply at 1.2569-1.2513, only to find that if we held tight, our position would have been sitting nicely in the green now.
At the time of writing, price is trading around the 1.2400 handle. Should this barrier hold the market higher today, we could potentially see price take back much of yesterday’s loss and rally up to test 1.2500. On the flip side, should 1.2400 fail to hold the market, further downside will likely ensue towards the 4hr demand area seen at 1.2304-1.2326.
Given the mixed signals seen on the higher timeframe picture (see above in bold) at the moment, it’s difficult to even guess which way the market will turn today. That being the case, unless we see very convincing lower timeframe confirming price action to trade from 1.2400 (long or short), we’ll remain flat for the time being until further development is seen.
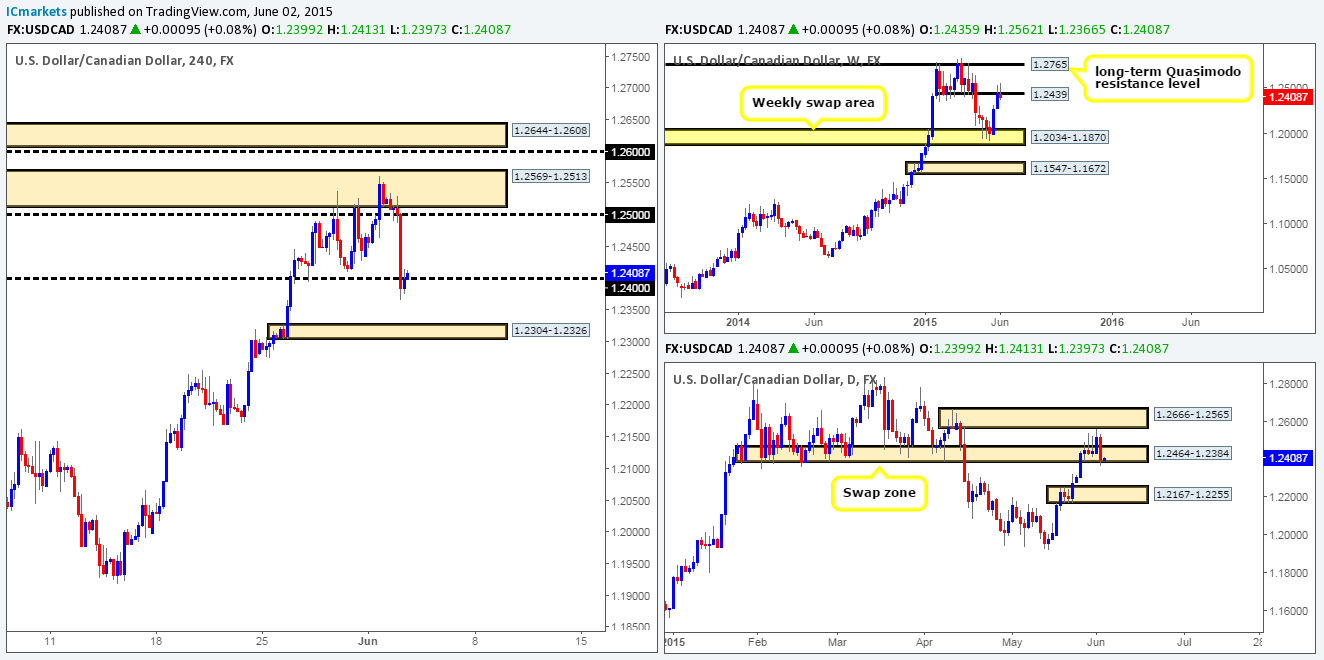
Levels to watch/ live orders:
- Buys: 1.2400 [Tentative – confirmation required] (Predicative stop-loss orders seen at: dependent on where one confirms this level).
- Sells: 1.2400 [Tentative – confirmation required] (Predicative stop-loss orders seen at: dependent on where one confirms this level).
USD/CHF:
Weekly view – Following last week’s rebound from the weekly swap level 0.9512, follow-through selling is being seen. Provided the sellers can maintain this position, it is possible we may see price attack the weekly swap area seen at 0.9074-0.9000 again.
Daily view: The daily timeframe on the other hand, shows that in order for the weekly timeframe to continue selling off, daily demand at 0.9285-0.9365 will need to be consumed.
4hr view: Yesterday’s bearish momentum saw price aggressively take out the 0.9400 handle and slam dunk itself into a 4hr Quasimodo support level at 0.9305 (located deep within the aforementioned daily demand area).
Buying from this number today is most certainly tempting. However, before we consider a long here, we’d need to see 0.9353 taken out; this is seen clearer on the 30 minute timeframe. A break of this level (as you’ll see by looking at the 30 minute timeframe) will likely open up the gates for price to challenge the 0.9400 region. The reason we need confirmation at this 4hr Quasimodo support level is simply because – even though price sitting within daily demand at the moment, we do not want to be caught going up against weekly selling opposition without confirming price action (see above for levels).
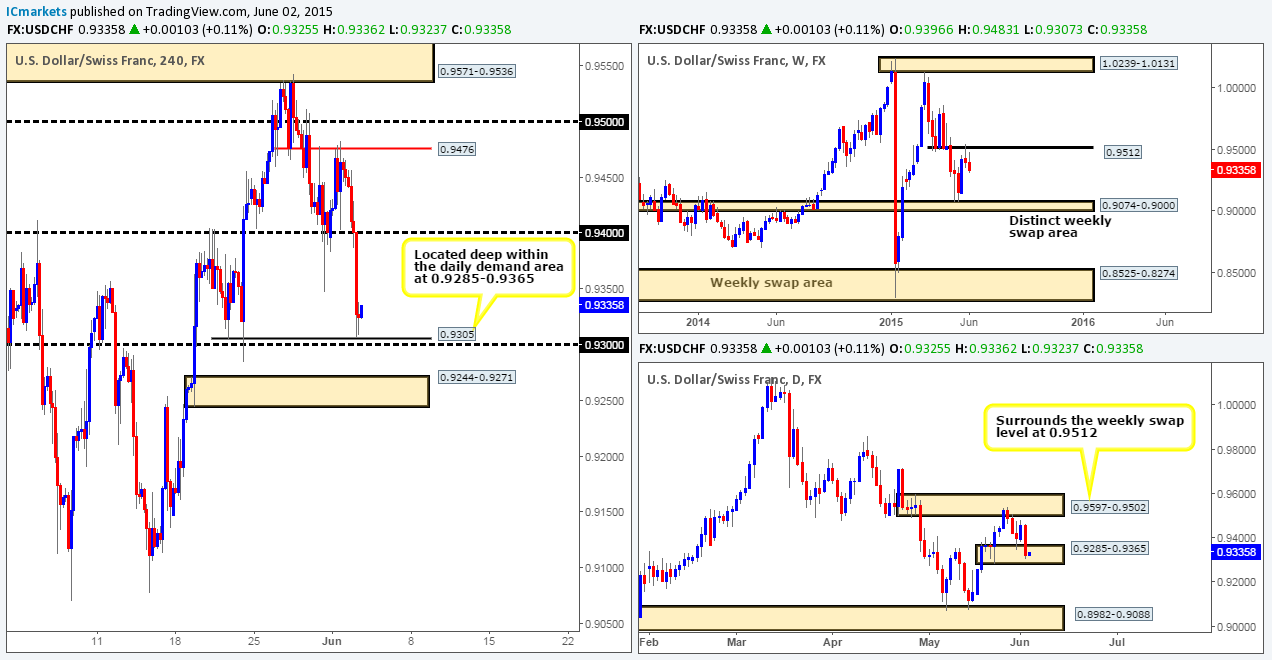
Levels to watch/ live orders:
- Buys: 0.9305 [Tentative – confirmation required] (Predicative stop-loss orders seen at: dependent on where one confirms this level).
- Sells: Flat (Predicative stop-loss orders seen at: N/A).
US 30:
Weekly view – Overall, this index is still in a very strong uptrend. A push below the weekly support level 16051 would be required to invalidate this bias.
The weekly timeframe shows that relatively strong resistance came into the market recently from the 18279 region. In the event that further selling is seen from here, we may see price challenge the weekly swing low 17556.
Daily view: Things are not looking good for anyone currently long this index. Yesterday’s action saw price close below the daily trendline taken from the low 17033. Albeit it was not a strong close, but a close it was. In the event that the sellers can hold the market below this line, we may see this market continue to decline in value down towards daily support at 17850.
4hr view: Volatility was clearly present in this market going into the European/London sessions, but overall, at least from a technical standpoint, there has been very little change since our previous analysis.
From the 4hr scale, we can see that price still remains trading between the 4hr demand at 17917-17989 and a small 4hr supply area sitting just above at 18118-18096. Our team has no interest in trying to trade in between these two zones today. What we are interested in though is trading the break of either the aforementioned 4hr demand area, or the 4hr supply area seen at 18208-18171 (zones marked in yellow).
A push below the 4hr demand area would likely pave the way south towards the 4hr swap level at 17856 (positioned a few points above the aforementioned daily support level), or given enough time, the 4hr Quasimodo support level at 17765 (see red arrows). Conversely, a violation of the 4hr supply zone at 18208-18171 could potentially suggest further upside towards at least 18340. The reason we believe price could stretch that far is simply because above this 4hr supply area we see nothing but consumed sellers. The wicks you see poking above the red trendline was likely the work of pro money spiking north to fill any unfilled sell orders to continue shorting this market, thus once/if price reaches this area, the market should slice through this congested zone like a hot knife through butter (see blue arrows).
Entering on the break of either of the above 4hr zones will (for us) require a retest along with corresponding support from the lower timeframes to execute a position.
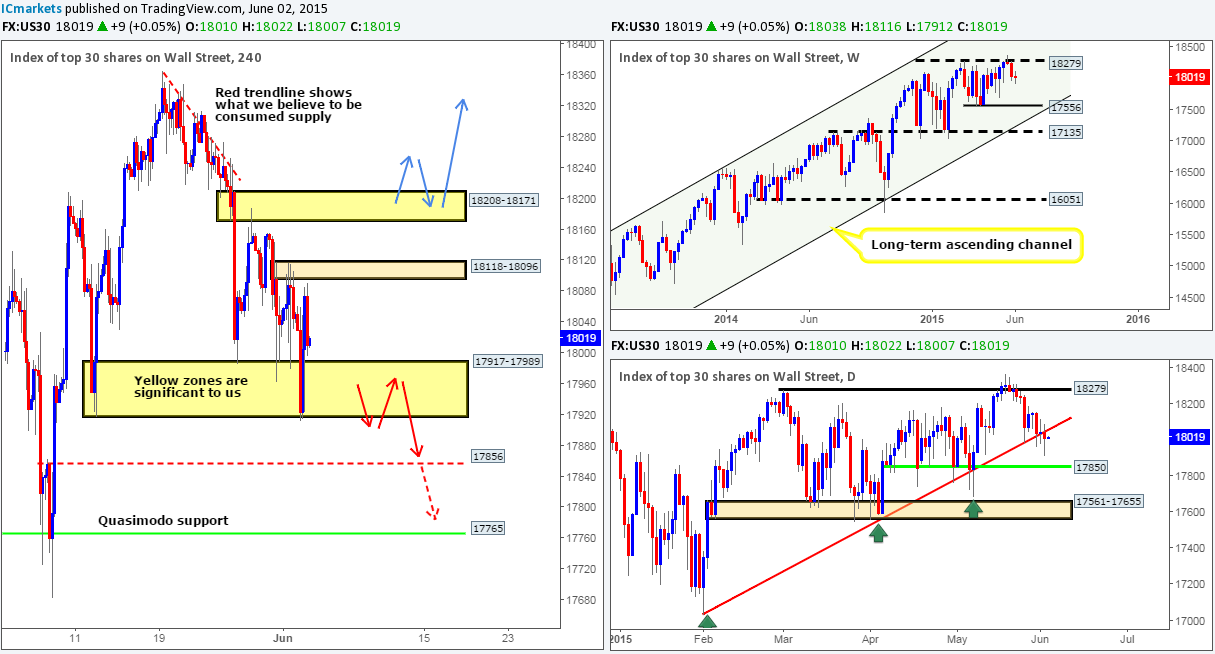
Levels to watch/ live orders:
- Buys: Flat (Predicative stop-loss orders seen at: N/A).
- Sells: Flat (Predicative stop-loss orders seen at: N/A).
XAU/USD (Gold)
Weekly view – From a long-term perspective, the gold market is still trending south in our opinion. For this bias to be invalidated, a push above the weekly trendline extended from the high 1488.0 would need to be seen.
Recently, however, the buyers and sellers have been seen battling for position around the top of a small weekly demand area at 1170.3-1188.4. Assuming that this zone holds and a rally ensues, we could potentially witness price attack the aforementioned weekly trendline sometime in the next few weeks.
Daily view: Following the rebound from daily demand at 1170.3-1184.0, the buyers appear to be climbing higher, literally using the daily trendline extended from the low 1142.5 as a rope to pull themselves higher. If price continues to appreciate here, we may, in the next few days, see the market connect with a daily supply area seen at 1214.7-1205.5.
4hr view: From this angle, we can see that price is currently chewing on the upper limits of a 4hr swap area at 1191.1-1194.4, which as you can see, forms the upper limit of a 4hr consolidation zone (lower limit is seen below – 4hr demand at 1178.7-1184.6).
Taking into consideration the location of price on the higher timeframe picture (see above), we believe that gold is poised for a breakout north today. In the case that the current 4hr swap area is engulfed, the river north should be somewhat ‘ripple free’ up to at least 1203.2/1205.8. However, for us to be given the ‘green light’ to enter long following a close higher, we’d need to see not only a strong retest of this swap area as demand, but also supporting lower timeframe strength.

Levels to watch/ live orders:
- Buys: Flat (Predicative stop-loss orders seen at: N/A).
- Sells: Flat (Predicative stop-loss orders seen at: N/A).


