EUR/USD:
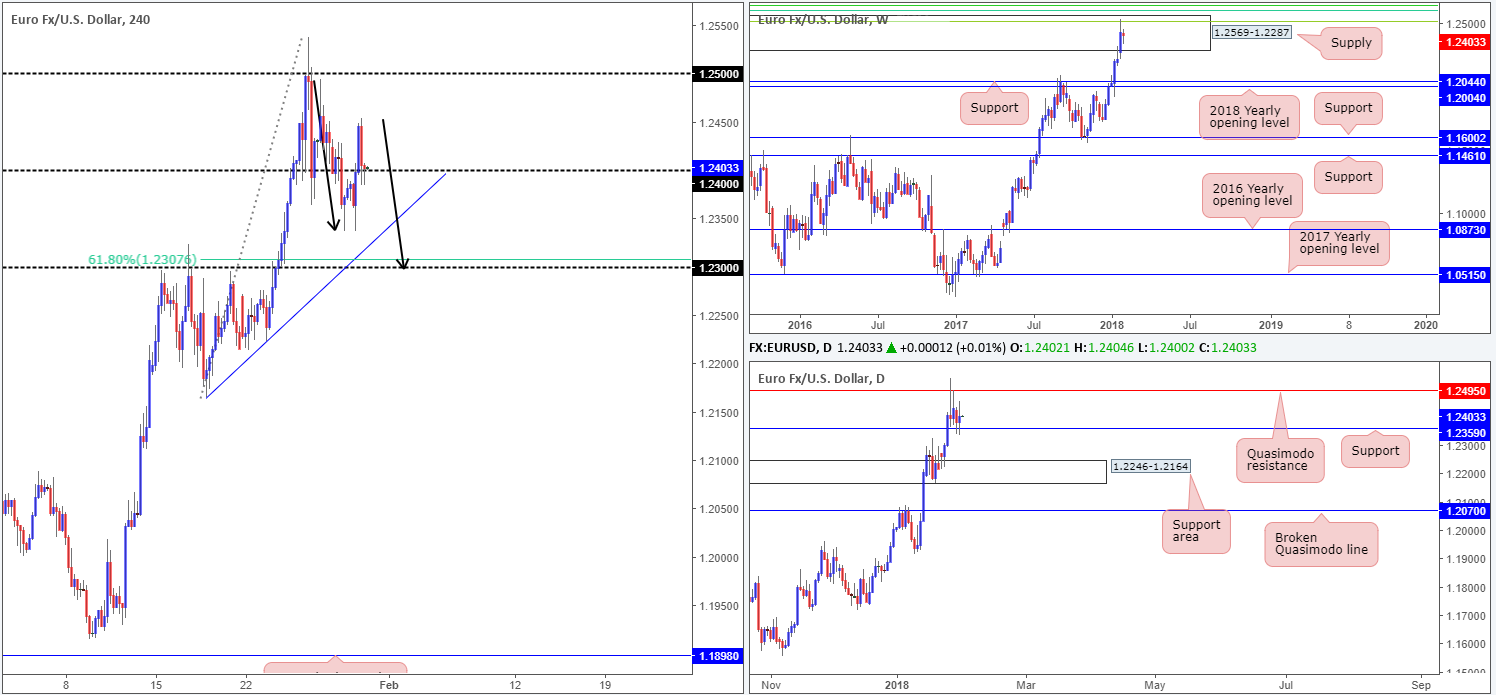
In recent sessions, the single currency chalked up a H4 double-bottom formation around the daily support level positioned at 1.2359, and gravitated beyond the 1.24 handle to a session high of 1.2453. Belter-than-expected US consumer confidence then pulled the H4 candles back down to the 1.24 region, where price formed support going into the close. Buying from this angle could lead to an approach back up to the 1.2450s, or quite possibly up to a daily Quasimodo resistance at 1.2495/1.25 handle. A breach to the downside, nevertheless, has the noted daily support to target (appears to now merge with a H4 trendline support etched from the low 1.2165), followed by the 1.23 handle/ H4 61.8% Fib support at 1.2307. Also worthy of note is the potential H4 AB=CD formation (see black arrows) which terminates around the 1.23 neighborhood.
Market direction:
While we’re seeing support form on the daily timeframe and possible H4 buying from 1.24, we have to take into account that weekly price continues to battle for position within the walls of a weekly supply zone coming in at 1.2569-1.2287. Therefore, this is a somewhat difficult market to trade at the moment, since irrespective of which direction one selects you’ll be faced with higher-timeframe structure!
Data points to consider: German retail sales m/m at 7am; Spanish flash CPI y/y; EUR CPI flash estimate y/y; US ADP non-farm employment change at 1.15pm; Employment cost index q/q at 1.30pm; US pending home sales at 3pm; US FOMC and Federal funds rate decision at 7pm GMT.
Areas worthy of attention:
Supports: 1.24 handle; 1.2307; H4 trendline support; 1.2359.
Resistances: 1.2569-1.2287; 1.2495; 1.25 handle.
GBP/USD:
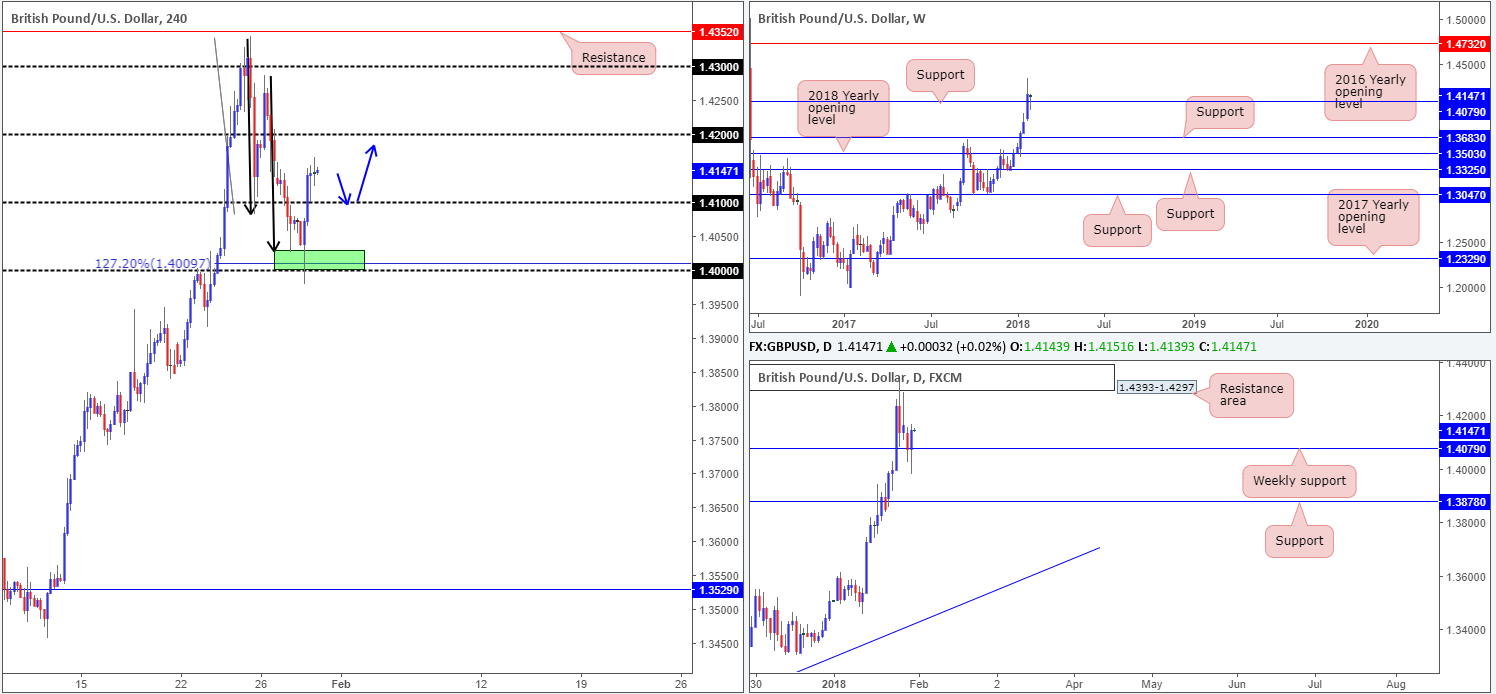
As London buyers entered the fray on Tuesday, cable rocketed north from the 1.40 psychological level. As noted in Tuesday’s report, we believed 1.40 to be a worthy buy zone, due to the number merging beautifully with a H4 AB=CD formation (black arrows) that terminated around the 127.2% Fib ext. point at 1.4009. Well done to any of our readers who managed to jump aboard this move.
With H4 price easily seen clearing the 1.41 handle yesterday, the unit ended the day topping around the 1.4150s area. What’s also interesting is this move formed a nice-looking daily bullish engulfing candle from weekly support at 1.4079. Should this encourage further buying, the next upside target on the bigger picture can be seen at 1.4393-1.4297: a daily resistance area.
Market direction: According to the three timeframes we watch, further upside is a real possibility today/this week. In the event that H4 price retests 1.41 and HOLDS as support, this could be considered a platform worthy of a buy, targeting the 1.42 handle and, will a little bit of oomph, quite possibly the underside of the daily resistance area at 1.4297/1.23 handle.
Data points to consider: US ADP non-farm employment change at 1.15pm; Employment cost index q/q at 1.30pm; US pending home sales at 3pm; US FOMC and Federal funds rate decision at 7pm GMT.
Areas worthy of attention:
Supports: 1.4079; 1.41 handle.
Resistances: 1.4393-1.4297; 1.42/3 handle.
AUD/USD:
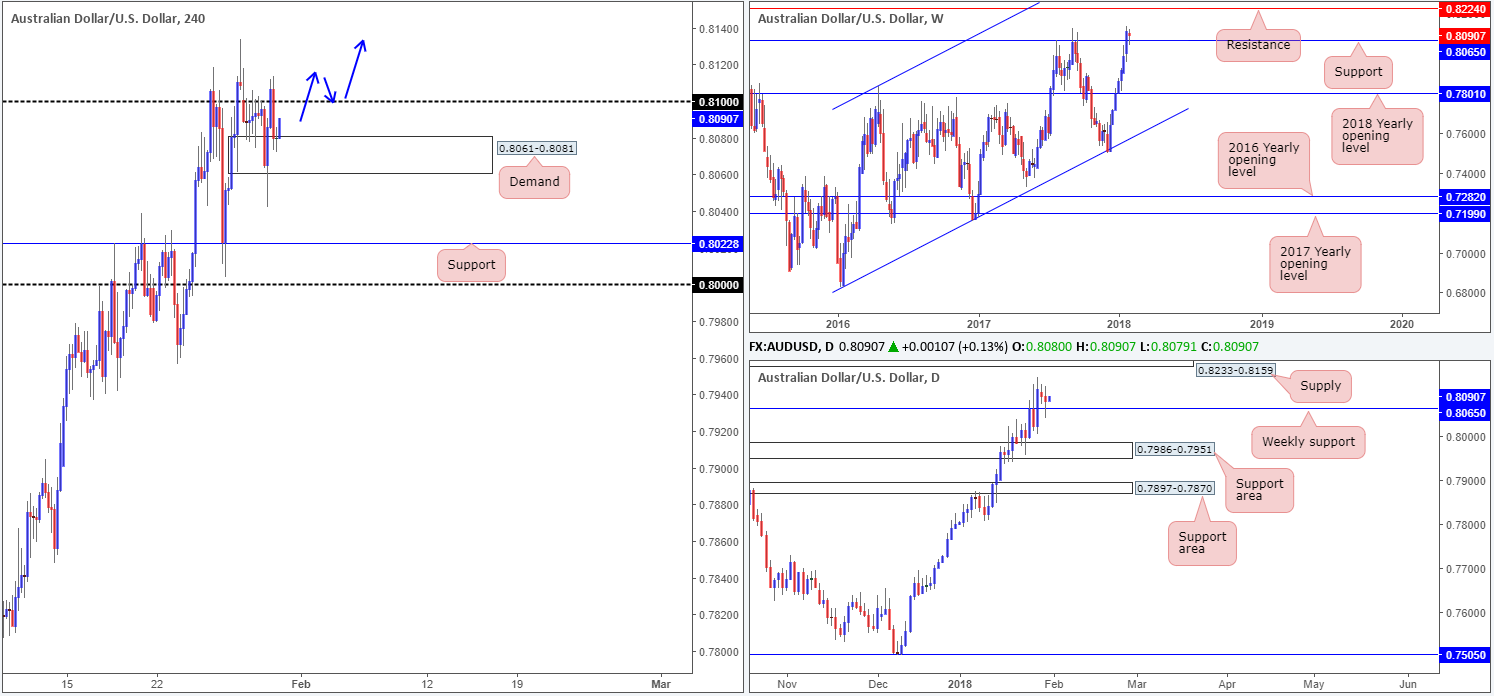
Despite the commodity-linked currency ranging over 70 pips on Tuesday, the unit was unable to muster enough strength to push out of its current H4 range. Since Monday, the AUD/USD has been trading between a H4 demand area at 0.8061-0.8081 and the 0.81 handle.
Taking into account that this market is entrenched within a steep uptrend at the moment, and is also seen retesting a weekly support at 0.8065, additional buying is likely in store. The next upside objective on the bigger picture can be seen at 0.8233-0.8159: a daily supply base which happens to house a weekly resistance within at 0.8224.
Market direction:
Ultimately, this market is likely headed above the 0.81 mark in the near term. A decisive H4 close above this number, followed up with a successful retest would, in our book, be enough to drag this market up to the aforementioned daily supply. Personally, we would not target much higher than this since over on the US dollar index, large monthly support is seen around the 88.50 region.
Data points to consider: AUD inflation figures q/q at 12.30am; Chinese manufacturing PMI at 1am; US ADP non-farm employment change at 1.15pm; Employment cost index q/q at 1.30pm; US pending home sales at 3pm; US FOMC and Federal funds rate decision at 7pm GMT.
Areas worthy of attention:
Supports: 0.8061-0.8081; 0.8065.
Resistances: 0.8224; 0.8233-0.8159; 0.81 handle.
USD/JPY:
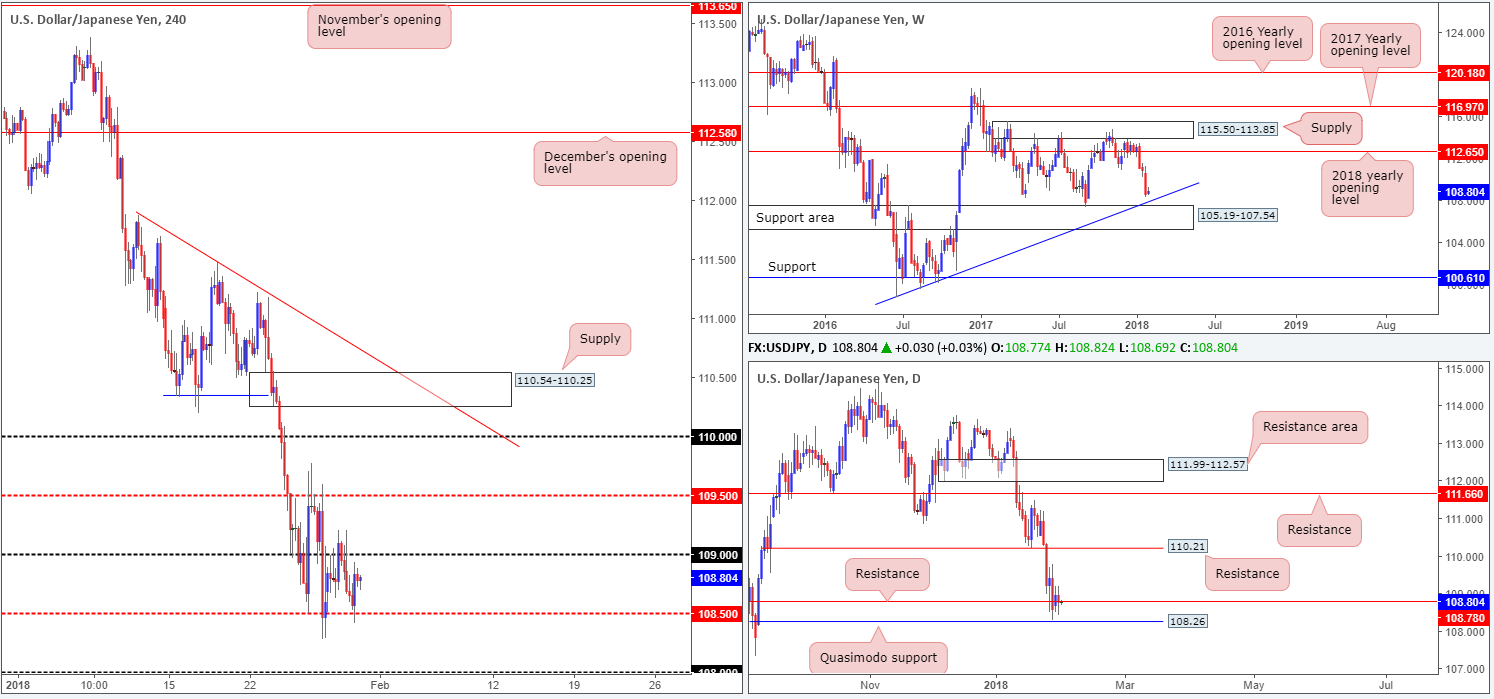
Coming in from the top this morning, weekly movement shows us that the USD/JPY has room to probe as low as a weekly trendline support taken from the low 98.78, followed closely by a weekly support area at 105.19-107.54. Meanwhile, down on the daily timeframe, price is struggling to trade above daily resistance at 108.78, after finding support just ahead of a daily Quasimodo formation at 108.26 on Friday.
Looking over to the H4 candles, we can see that the H4 mid-level support at 108.50 held firm on Tuesday, reaching a high of 108.93. Given the current state of higher-timeframe structure, however, a breach of 108.50 is likely going to take shape. Beyond here, we have the daily Quasimodo support at 108.26 and 108 handle to target.
Market direction:
As highlighted above. 108.50 appears weak and could potentially give way during today’s session. Selling the breakout is a chancy trade, though, since there are still likely willing buyers around the daily Quasimodo mentioned above at 108.26, so trade carefully!
Data points to consider: US ADP non-farm employment change at 1.15pm; Employment cost index q/q at 1.30pm; US pending home sales at 3pm; US FOMC and Federal funds rate decision at 7pm GMT.
Areas worthy of attention:
Supports: 108.50; 108 handle; 108.26; Weekly trendline support; 105.19-107.54.
Resistances: 109 handle; 108.78.
USD/CAD:
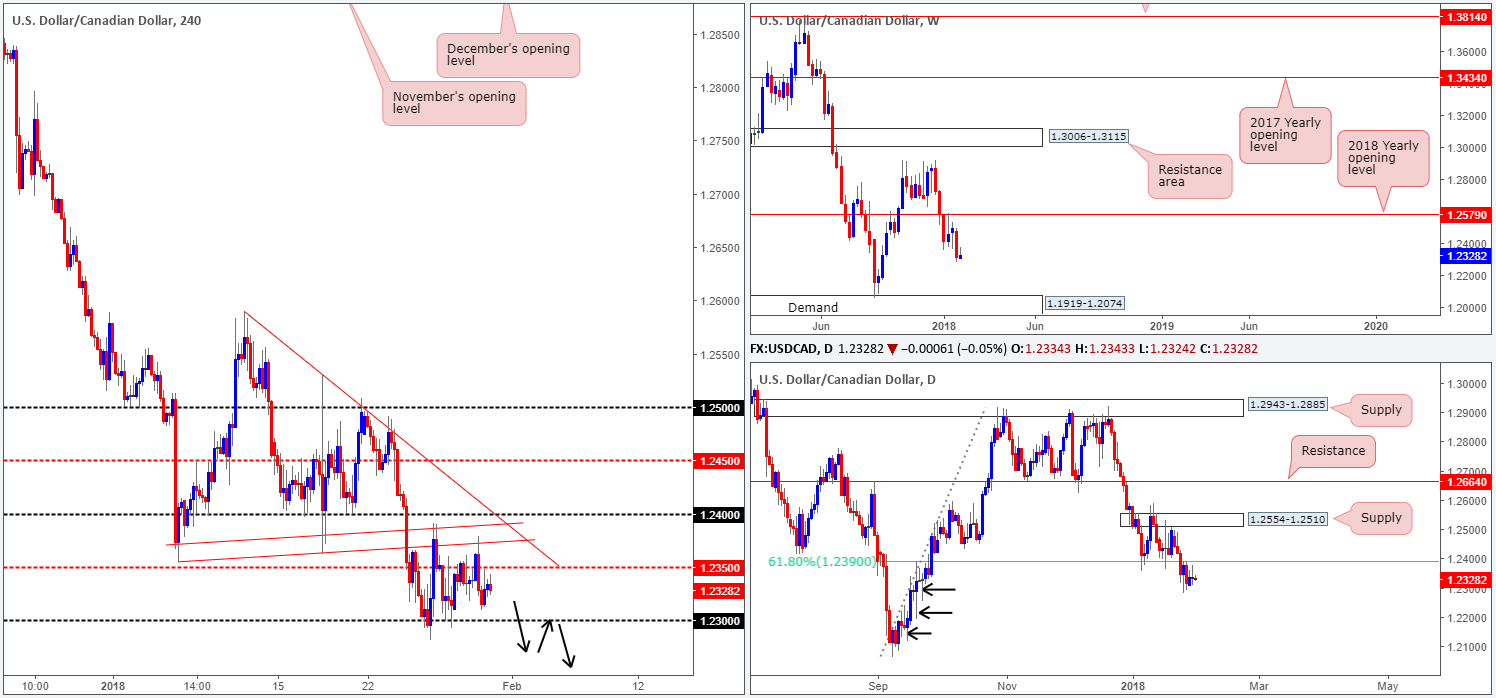
Although H4 price edged higher on Tuesday and shook hands with a H4 trendline resistance extended from the low 1.2355, the unit ended the day closing back below the H4 mid-level resistance at 1.2350. This, in effect, shows little change to the overall structure of this market. Therefore, much of the following report will echo thoughts put forward in yesterday’s analysis…
After spending two weeks consolidating below the 2018 yearly opening level on the weekly timeframe at 1.2579, the sellers finally cranked it up a gear and moved lower last week. With little weekly support in sight until we reach the weekly demand base at 1.1919-1.2074, further selling in the coming weeks is a real possibility.
Daily price, as you can see, remains below 1.2390: a daily 61.8% Fib support-turned resistance. Below 1.2390 there’s little support worthy of mention, in our opinion. Note the clear daily buying tails marked with black arrows at 1.2253, 1.2194 and 1.2118. These, to us, resemble consumption of unfilled buy orders.
Market direction:
To the upside, above 1.2350, movement is, as we’ve already seen, somewhat restricted, given the noted H4 trendline resistance and the 1.24 handle. Should 1.2350 hold ground today, on the other hand, we may see the 1.23 handle brought into the fray. The next downside objective beyond this number can be seen at 1.2236: a H4 Quasimodo support.
Our bias, at least medium/long term, remains short. This is largely because of where price is located on the bigger picture. A H4 close beneath 1.23 would, in our view, further confirm this bearish bias and open up the possibility for a short trade. However, we would not label a breakout as a high-probability setup as they have a tendency to recoil. Instead, consider waiting for a H4 close to form below 1.23 and look to then trade any (successful) retest of this number thereafter (as per the black arrows), targeting the noted H4 Quasimodo support at 1.2236 as an initial take-profit zone.
Data points to consider: US ADP non-farm employment change at 1.15pm; Employment cost index q/q at 1.30pm; US pending home sales at 3pm; US FOMC and Federal funds rate decision at 7pm; CAD GDP m/m; Crude oil inventories at 3.30pm GMT.
Areas worthy of attention:
Supports: 1.23 handle; 1.2236; 1.1919-1.2074.
Resistances: 1.2350; 1.24 handle; H4 trendline resistance; 1.2390.
USD/CHF:
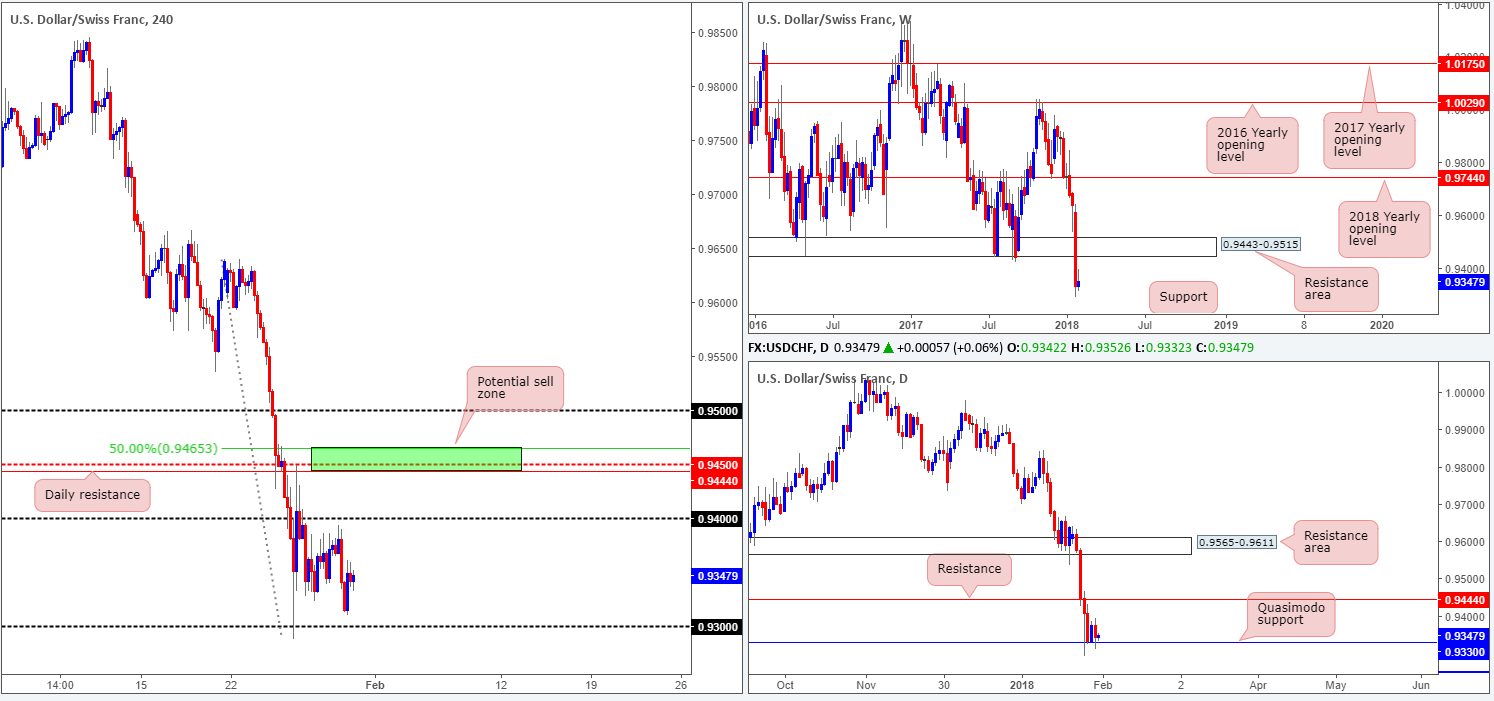
Leaving the 0.94 handle unchallenged, the USD/CHF edged lower on Tuesday, bottoming a few pips ahead of the 0.93 handle. Although the daily Quasimodo support at 0.9330 remains in the fray, buyers are struggling to register anything of note here. This could have something to do with the fact that weekly price shows that the market could potentially drop as far south as a weekly support coming in at 0.9163 (not seen on the screen).
Market direction:
We still have our eye on the 0.9450 region for potential shorts, since this area (shown in green) is surrounded by the underside of a weekly resistance base at 0.9443, a daily resistance at 0.9444, a H4 mid-level resistance at 0.9450 and a H4 50.0% resistance value at 0.9465 taken from the high 0.9640. However, this may not come into view today.
Other than 0.9450, we’re also watching for a break of the 0.93 handle since this likely opens the path south down to a daily Quasimodo support at 0.9233. A H4 close beneath 0.93 alongside a solid retest would, in our view, be enough to encourage sellers into the market and bring the unit lower.
Data points to consider: US ADP non-farm employment change at 1.15pm; Employment cost index q/q at 1.30pm; US pending home sales at 3pm; US FOMC and Federal funds rate decision at 7pm GMT.
Areas worthy of attention:
Supports: 0.93 handle; 0.9330; 0.9233; 0.9163.
Resistances: 0.94 handle; 0.9444; 0.9450; 0.9465; 0.9443-0.9515.
DOW 30:
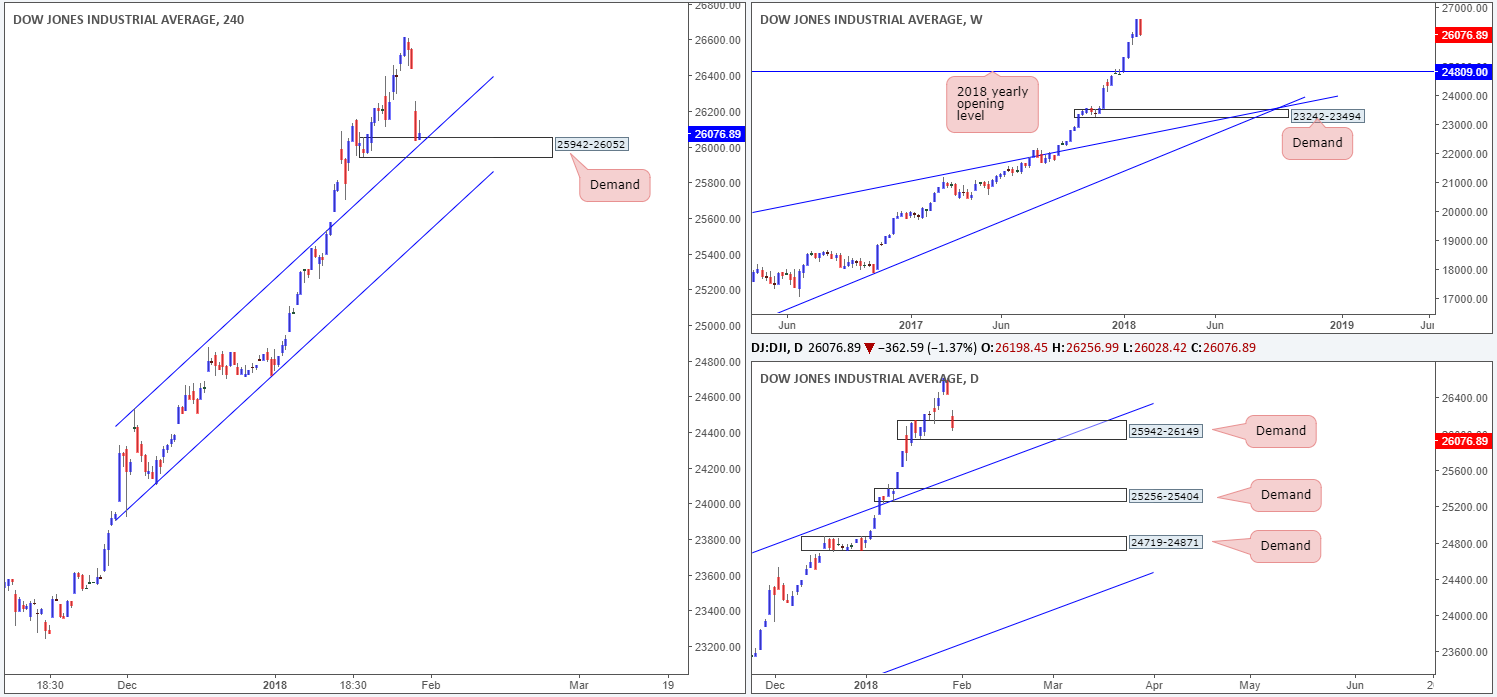
The Dow Jones Industrial Average plummeted a whopping 363 points on Tuesday, consequently dragging H4 price down to a H4 demand base at 25942-26052/ H4 channel resistance-turned support taken from the high 24535 (seen positioned within the lower limits of daily demand at 25942-26149. A broad-based selloff in healthcare stocks weighed on the index after large corporations such as JPMorgan Chase and Amazon announced they would partner in an effort to reduce healthcare costs.
Market direction:
Given the current position of price, and the fact that H4 action closed forming an inverted pin-bar formation (typically considered a bullish signal), a rotation to the upside could very well take place today. Stop-loss orders would be best positioned beneath the current H4 demand area. Ultimately, a healthy bid from current price would fill Tuesday’s gap and possibly push on to fresh record highs.
Data points to consider: US ADP non-farm employment change at 1.15pm; Employment cost index q/q at 1.30pm; US pending home sales at 3pm; US FOMC and Federal funds rate decision at 7pm GMT.
Areas worthy of attention:
Supports: 25942-26052; H4 channel support; 25942-26149.
Resistances: …
GOLD:
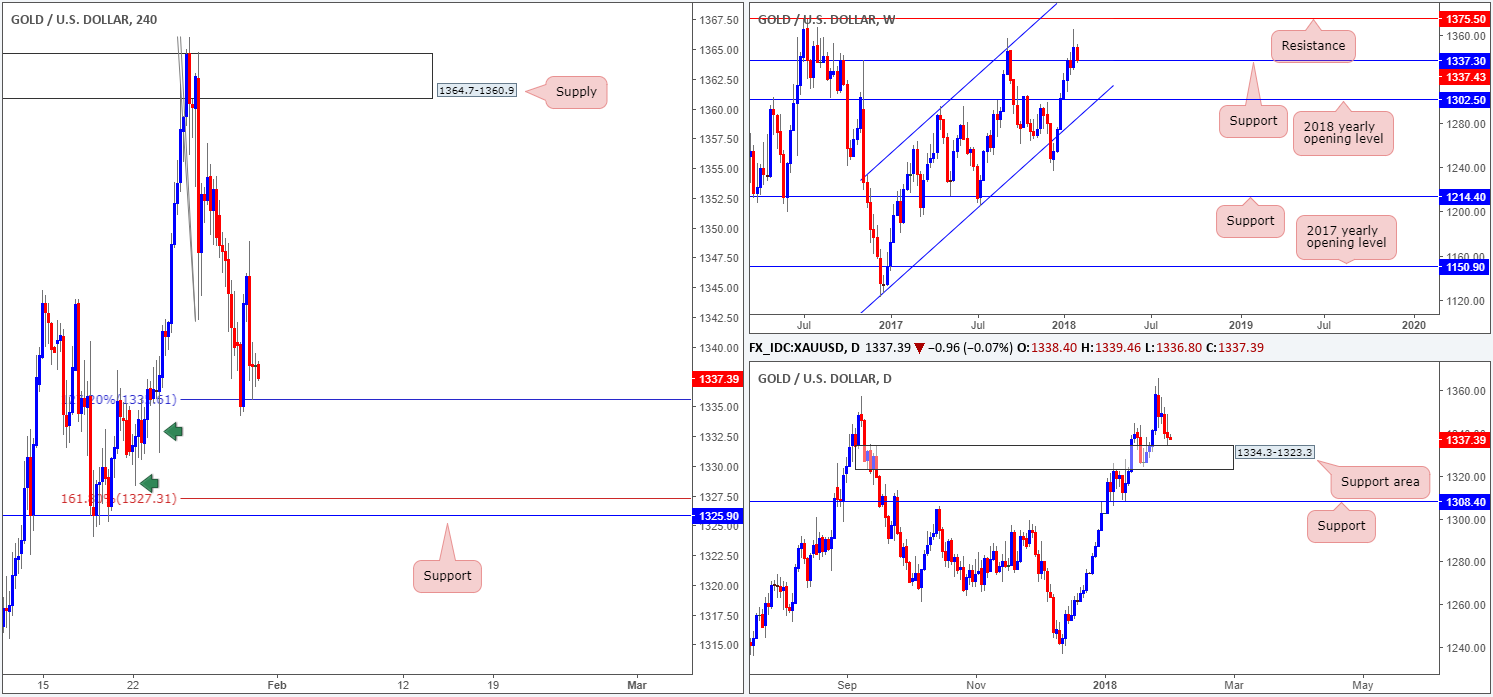
During the course of recent trading, we saw H4 price bounce beautifully from a 127.2% H4 Fib ext. point at 1335.6 and reach a high of 1348.9, before collapsing back to 1335.6. This move was likely bolstered by the fact that a daily support area at 1334.3-1323.3 is seen a few pips below 1335.6, and also considering that weekly price is re-engaging with weekly support at 1337.3.
Should the H4 127.2% Fib ext. fail to hold ground today, the next downside target on the H4 scale can be seen at 1327.3/1325.9: a 161.8% Fib ext. point/H4 support. The green arrows denote consumption tails, which we believe has likely cleared downside.
Market direction:
Buying from current price is certainly a possibility today, given yesterday’s reaction. However, a better area to buy from, in our view, would be the H4 161.8% Fib ext. point at 1327.3, since it is located just ahead of H4 support at 1325.9 and positioned within the lower limits of the current daily demand. Therefore, traders are able to place stops beyond this daily zone!
Areas worthy of attention:
Supports: 1335.6; 1327.3; 1325.9; 1337.3; 1334.3-1323.3.
Resistances: …
This site has been designed for informational and educational purposes only and does not constitute an offer to sell nor a solicitation of an offer to buy any products which may be referenced upon the site. The services and information provided through this site are for personal, non-commercial, educational use and display. IC Markets does not provide personal trading advice through this site and does not represent that the products or services discussed are suitable for any trader. Traders are advised not to rely on any information contained in the site in the process of making a fully informed decision.
This site may include market analysis. All ideas, opinions, and/or forecasts, expressed or implied herein, information, charts or examples contained in the lessons, are for informational and educational purposes only and should not be construed as a recommendation to invest, trade, and/or speculate in the markets. Any trades, and/or speculations made in light of the ideas, opinions, and/or forecasts, expressed or implied herein, are committed at your own risk, financial or otherwise.
The use of the site is agreement that the site is for informational and educational purposes only and does not constitute advice in any form in the furtherance of any trade or trading decisions.
The accuracy, completeness and timeliness of the information contained on this site cannot be guaranteed. IC Markets does not warranty, guarantee or make any representations, or assume any liability with regard to financial results based on the use of the information in the site.
News, views, opinions, recommendations and other information obtained from sources outside of www.icmarkets.com.au, used in this site are believed to be reliable, but we cannot guarantee their accuracy or completeness. All such information is subject to change at any time without notice. IC Markets assumes no responsibility for the content of any linked site. The fact that such links may exist does not indicate approval or endorsement of any material contained on any linked site.
IC Markets is not liable for any harm caused by the transmission, through accessing the services or information on this site, of a computer virus, or other computer code or programming device that might be used to access, delete, damage, disable, disrupt or otherwise impede in any manner, the operation of the site or of any user’s software, hardware, data or property.


