A note on lower timeframe confirming price action…
Waiting for lower timeframe confirmation is our main tool to confirm strength within higher timeframe zones, and has really been the key to our trading success. It takes a little time to understand the subtle nuances, however, as each trade is never the same, but once you master the rhythm so to speak, you will be saved from countless unnecessary losing trades. The following is a list of what we look for:
- A break/retest of supply or demand dependent on which way you’re trading.
- A trendline break/retest.
- Buying/selling tails/wicks – essentially we look for a cluster of very obvious spikes off of lower timeframe support and resistance levels within the higher timeframe zone.
- Candlestick patterns. We tend to stick with pin bars and engulfing bars as these have proven to be the most effective.
We search for lower timeframe confirmation between the M15 and H1 timeframes, since most of our higher-timeframe areas begin with the H4. Stops are usually placed 5-10 pips beyond confirming structures.
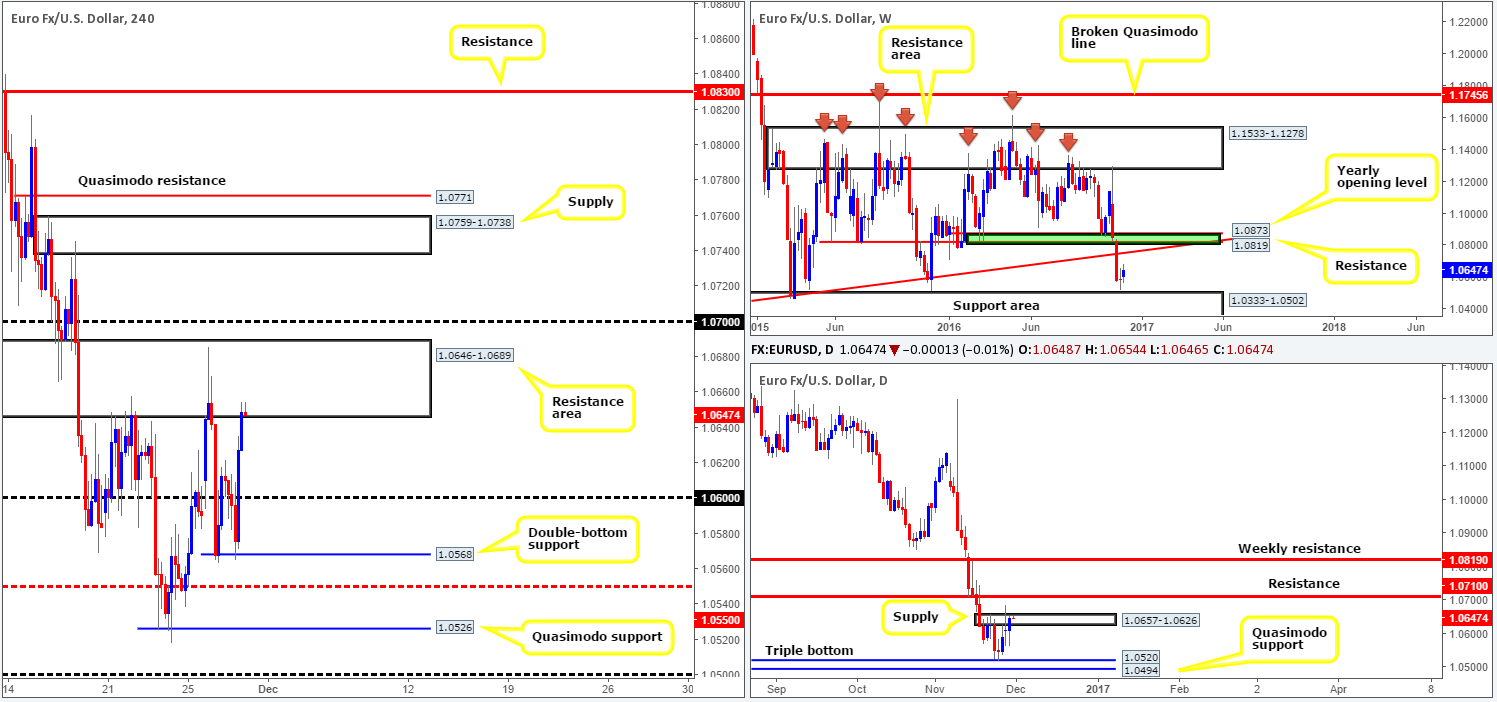
EUR/USD:
The EUR, as you can see, settled/bottomed around the 1.0568 neighborhood yesterday, despite hotter-than-expected US Prelim GDP data. Shortly after this, the unit climbed higher and broke through the 1.06 handle in the face of a strong US consumer confidence report, ending the day shaking hands with a H4 resistance area at 1.0646-1.0689.
With yesterday’s close marking the pair’s third consecutive daily gain, and daily supply at 1.0657-1.0626 looking vulnerable, as well as there being room on the weekly chart to advance up to a long-term trendline resistance extended from the low 0.8231, our team has their eye on the 1.07 handle this morning. Granted, price will have to tackle the current H4 resistance area before reaching this level, but think of all those buy stops sitting just above this zone, and the fact that 1.07 sits just 10 pips below a daily resistance at 1.0710 (the next upside target on the daily timeframe).
Our suggestions: Although 1.07 is attractive, psychological boundaries are generally prone to fakeouts. Therefore, we would recommend waiting for lower timeframe confirming action before taking a trade around 1.07 (see the top of this report). Should 1.07 fail to hold price, nevertheless, the next upside objective on hand is a H4 supply at 1.0759-1.0738, followed closely by a H4 Quasimodo resistance at 1.0771. Both areas are attractive, in our book, given their relationship with the above noted long-term weekly trendline resistance.
Data points to consider: ECB President Draghi speaks at 12.30pm. US ADP nonfarm employment change at 1.15pm, FOMC member Powell speaks at 4.45pm GMT.
Levels to watch/live orders:
- Buys: Flat (stop loss: N/A).
- Sells: 1.07 region ([waiting for lower timeframe confirming action is preferred] stop loss: dependent on where one confirms the area).
GBP/USD:
In recent trading, the pair caught a fresh bid from the H4 support area drawn in at 1.24-1.2377, despite upbeat US growth and consumer confidence data. The H4 candles, however, failed to sustain gains beyond the 1.25 wall (managed to cap upside since mid-Nov), aided by a H4 resistance area planted just above at 1.2525-1.2557.
In light of yesterday’s rally, the above noted H4 resistance boundary is now, once again, in our sights. As was discussed during Monday’s weekly report, this H4 resistance zone is especially striking. The area boasts a H4 61.8% Fib resistance at 1.2531, a H4 mid-way resistance at 1.2550, a H4 AB=CD bearish completion point at 1.2553 taken form the low 1.2360 and the top edge of the H4 zone represents a daily Quasimodo resistance at 1.2557. Now, in view of the last point, this does mean there’s a chance that price could fake through our H4 resistance zone, so traders need to be prepared for that.
Our suggestions: While a fakeout above the aforementioned H4 resistance barrier is a possibility, we can still trade from here. Instead of placing a pending sell order and positioning stops just above the zone (not a good idea when a fakeout is likely), waiting for a reasonably sized H4 bearish candle to form within the walls of this region is by far, the safer, more conservative route to take here. This will, of course, not guarantee a winning trade, but will show that sellers have taken an interest here before we pull the trigger!
Data points to consider: UK bank stress test results. US ADP nonfarm employment change at 1.15pm, FOMC member Powell speaks at 4.45pm GMT.

Levels to watch/live orders:
- Buys: Flat (stop loss: N/A).
- Sells: 1.2557-1.2525 ([reasonably sized H4 bearish close required prior to pulling the trigger] stop loss: ideally beyond the trigger candle).
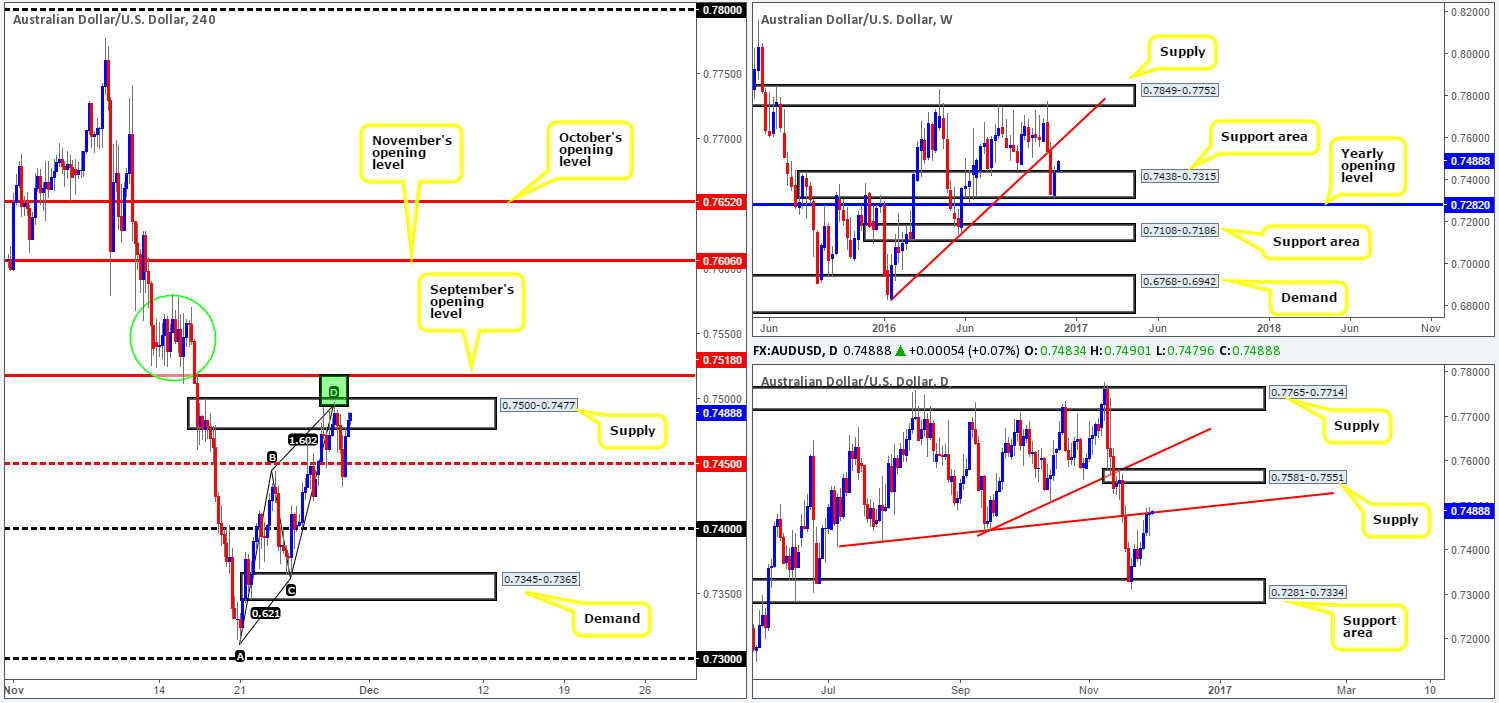
AUD/USD:
For traders who read our previous post on the AUD/USD you may recall our desk highlighting the 0.7518/0.7494 region as a high-probability reversal zone (green rectangle). The area boasted a H4 AB=CD bearish completion point at 0.7494, a daily trendline resistance extended from the low 0.7407, along with the top edge of the current H4 supply also representing the 0.75 handle as well as 18 pips above we have September’s opening barrier at 0.7518. As you can see, price responded to-the-pip here, so well done to any of our readers who managed to take advantage of this move!
As can be seen from the H4 chart, nonetheless, price clawed back most of yesterday morning’s losses during the US session, bringing the unit back up to within striking distance of our aforementioned H4 sell zone. Would we recommend trading this area for a second time? Probably not, since weekly action displays bullish strength from the support area at 0.7438-0.7315 and shows room to the upside towards a trendline resistance drawn from the low 0.6827.
Our suggestions: Although we’re not too keen on shorts right now, a H4 close above September’s opening barrier is also not something our team would stamp bullish. The reason as to why is there’s a lot of wood to chop through seen within the green circle (0.7581/0.7524), which is followed closely by November’s opening level at 0.7606. As such, remaining flat until more conducive price action presents itself is the route we’ve chosen to take.
Data points to consider: US ADP nonfarm employment change at 1.15pm, FOMC member Powell speaks at 4.45pm GMT.
Levels to watch/live orders:
- Buys: Flat (stop loss: N/A).
- Sells: Flat (stop loss: N/A).
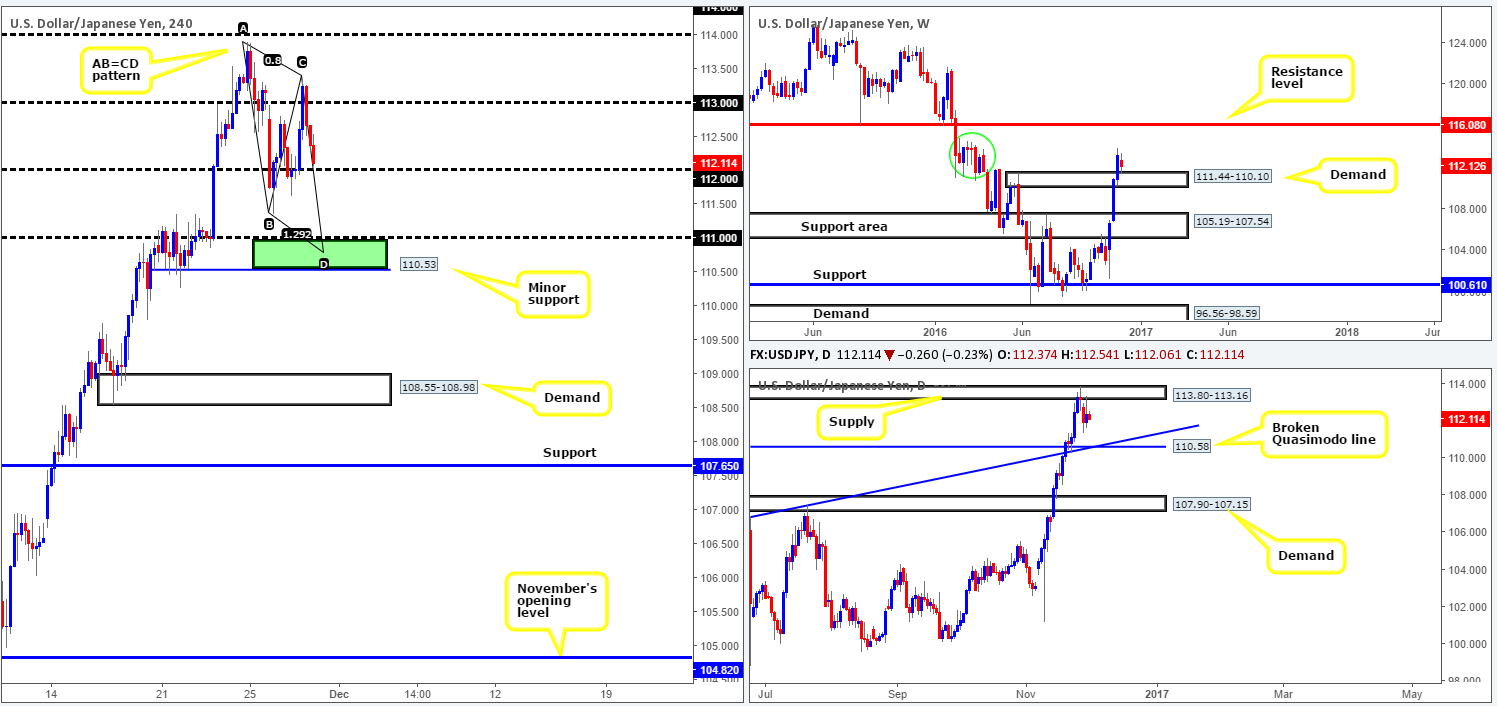
USD/JPY:
The daily candles, once again, struck the underside of supply coming in at 113.80-113.16 during yesterday’s session. This was likely aided by the 114.87/111.44 weekly area (green circle), which, as you can see, has forced weekly price to retest a recently broken weekly supply as demand at 111.44-110.10.
The 112 handle on the H4 chart is critical for our desk this morning. Our reasoning lies within the higher-timeframe structure. A H4 close below 112 could spark a selloff down to the 111 barrier, followed closely by a minor H4 support level at 110.53, and, by extension, the daily broken Quasimodo line at 110.58 (intersects nicely with a daily trendline support taken from the low 105.54).
Our suggestions: There’s no immediate trade at hand right now. Although our team is looking for a move below 112, we would not trade it due to the current weekly demand in play! However, we would be interested in buying from the 110.53/111 H4 region (green rectangle). This area not only sits within the above said weekly demand, it also houses the aforementioned daily broken daily Quasimodo line and a H4 AB=CD bullish completion point at 110.76! Still, before our team is permitted to buy from this region, we’ll need to see evidence of bullish interest before as it’s practically impossible to calculate how much or little price will fake through the current daily broken Quasimodo!
Data points to consider today: US ADP nonfarm employment change at 1.15pm, FOMC member Powell speaks at 4.45pm GMT.
Levels to watch/live orders:
- Buys: 110.53/111 ([reasonably sized H4 bullish close required prior to pulling the trigger] stop loss: ideally beyond the trigger candle).
- Sells: Flat (stop loss: N/A).
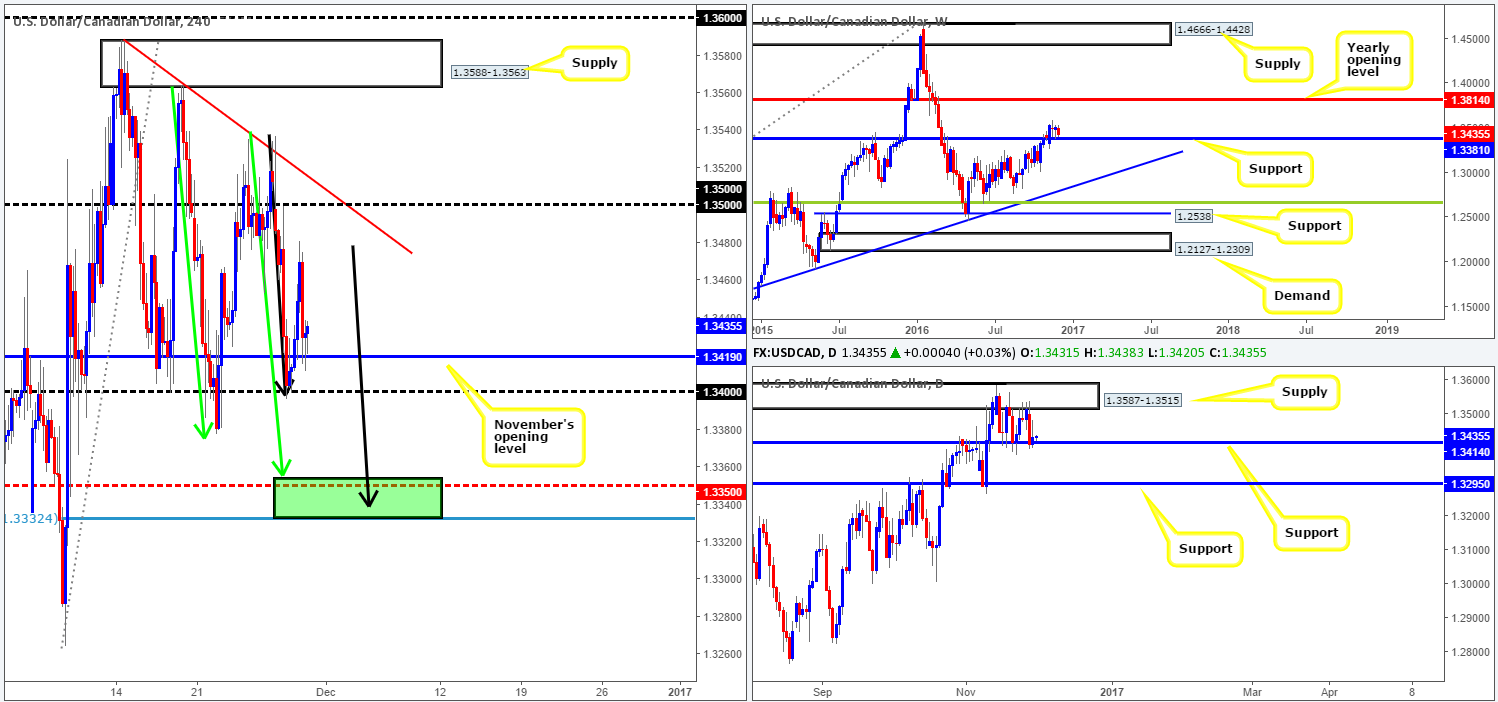
USD/CAD:
Throughout the course of yesterday’s sessions, we saw the pair extend Monday’s rebound off 1.34 and reach highs of 1.3480, before collapsing back down to November’s opening level at 1.3419, consequently wiping out most of the gains accrued during the London morning segment.
With the above points in mind, let’s see how the land lies on the higher-timeframe picture. Weekly action is currently seen trading within touching distance of a support level coming in at 1.3381. This hurdle has a significant amount of history to it, so ignore it not! Looking down to the daily candles, price has remained locked between supply seen at 1.3587-1.3515 and a support drawn from 1.3414 since early November.
Our suggestions: While a long from the November opening level is tempting given its connection with daily support at 1.3414, our team has their eye on something a little lower on the H4 curve. The 1.3332/1.3354 area comprises of two H4 AB=CD bullish completion points (green arrows – 1.3354, black arrows – 1.3337), a H4 mid-way support at 1.3350 and a H4 78.6% Fib support at 1.3332 (green rectangle). This area also sits just 27 pips below the weekly support level at 1.3381.
Should price action manage to reach our buy zone today, we would still recommend waiting for at least a reasonably sized H4 bull candle to form before pulling the trigger. The reason being is by that point, the current daily support would have suffered a breach which could encourage further selling down to daily support seen at 1.3295. As they say: ‘it’s better to be safe than sorry’.
Data points to consider today: CAD GDP at 1.30pm. US ADP nonfarm employment change at 1.15pm, FOMC member Powell speaks at 4.45pm GMT.
Levels to watch/live orders:
- Buys: 1.3332/1.3354 ([reasonably sized H4 bullish close required prior to pulling the trigger] stop loss: ideally beyond the trigger candle).
- Sells: Flat (stop loss: N/A).
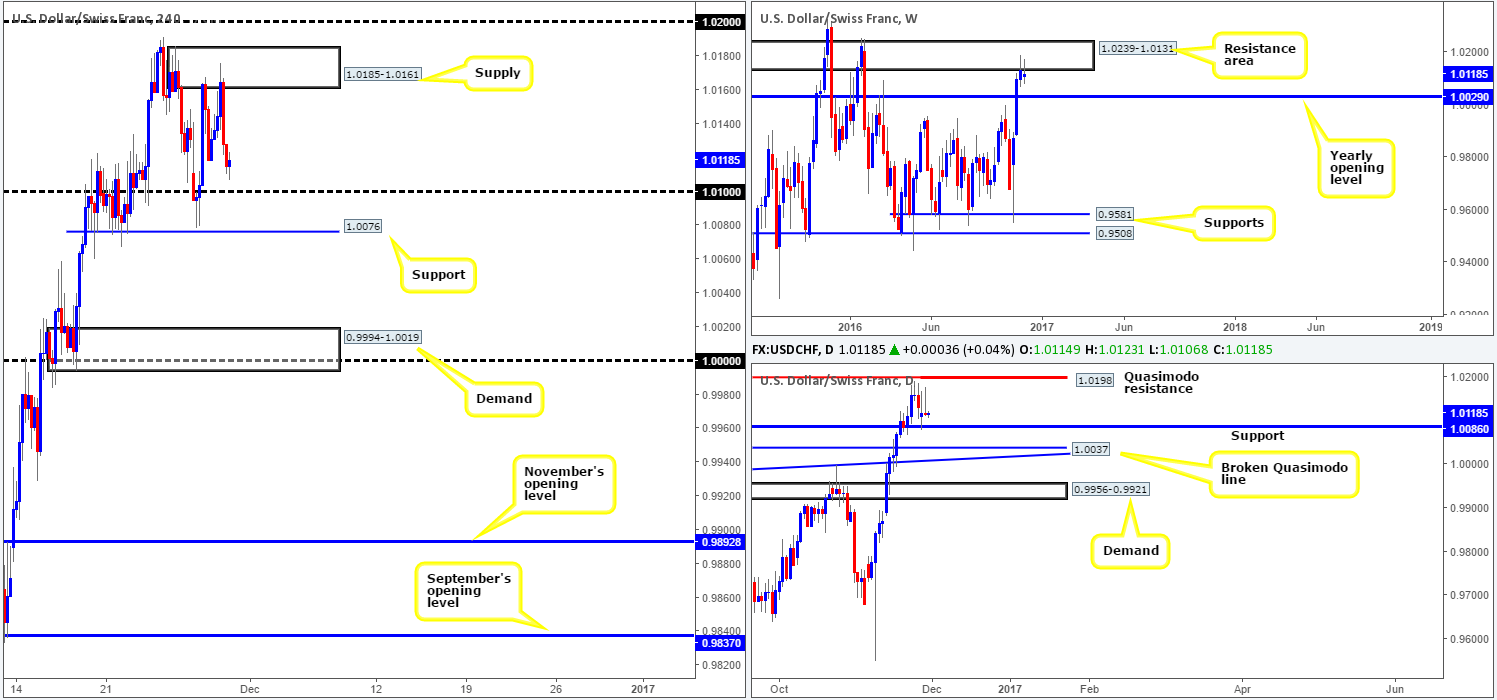
USD/CHF:
As can be seen from the H4 chart, the pair was recently met by strong selling pressure from supply at 1.0185-1.0161 for the second time, closing the day just ahead of the 1.01 handle. Now, buying from 1.01 and its partner H4 support seen just below it at 1.0076 is feasible according to the daily chart, as there’s support lodged in between the two H4 barriers at 1.0086. On the flipside, weekly flow recently linked with a resistance area at 1.0239-1.0131. This is likely to force weekly sellers down to the 2016 yearly opening level at 1.0029.
As we mentioned in Tuesday’s report, in view of the weekly candles recently nudging into a resistance area along with daily price trading off a support, medium-term direction is somewhat limited. However, do keep a tab on the daily Quasimodo resistance level at 1.0198, as this barrier sits comfortably within the aforementioned weekly resistance area.
Our suggestions: Given the above factors, here is what our desk has noted so far:
For longs, we would personally avoid the H4 support 1.0076/1.01 handle. Although it boasts a daily support, we believe weekly sellers will likely overpower this area and drag prices down to the yearly opening level. This level – coupled with the daily broken Quasimodo line at 1.0037 (intersects with a trendline support taken from the high 0.9956) points the spotlight on a nearby H4 demand base at 0.9994-1.0019 (holds parity) for longs. Dependent on the time of day, this area sports enough confluence, in our opinion, to permit a trade without the need to wait for confirming price action.
For shorts – while the current H4 supply has done a reasonably good job of holding the market lower, our focus remains above this barrier at 1.02. This psychological boundary converges beautifully with the above noted daily Quasimodo resistance, which itself, as we already know, is positioned within the aforementioned weekly resistance area! Although 1.02 sports attractive confluence, a fakeout is still likely around this fixed level. As such, we would advise waiting for the lower timeframes to confirm seller interest before considering a trade here (see the top of this report) as there’s nothing worse than having your trade stopped by a few pips only to later see your target hit!
Data points to consider today: US ADP nonfarm employment change at 1.15pm, FOMC member Powell speaks at 4.45pm GMT.
Levels to watch/live orders:
- Buys: 0.9994-1.0019 ([dependent on the time of day, a long at market is possible from this zone] stop loss: 0.9988).
- Sells: 1.02 region ([waiting for lower timeframe confirming action is preferred] stop loss: dependent on where one confirms the area).
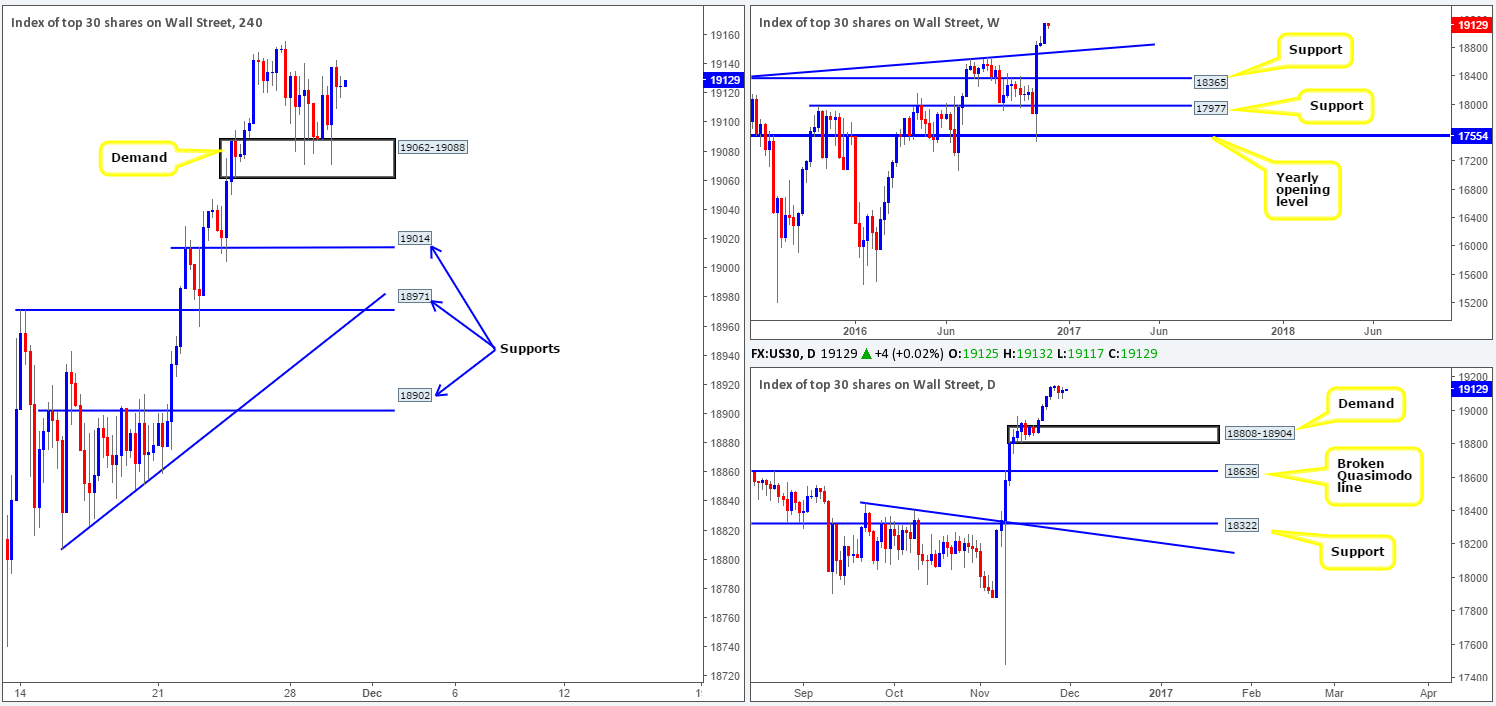
DOW 30:
H4 demand at 19062-19088 continued to provide this market support amid yesterday’s sessions. While we cannot rule out the possibility of a break below this zone, H4 price looks poised to break to fresh highs, given yesterday’s bullish response from the current H4 demand going into US trading.
Apart from this H4 demand base, there are three other H4 supports in view:
- The H4 support at 19014, which held beautifully last Wednesday.
- The H4 support at 18971 that converges with a H4 trendline support carved from the low 18808 and also held steady last week on Tuesday.
- The only H4 area that has any connection to the higher timeframes is the lowest of the three supports at 18902, which forms the top edge of the daily demand base at 18904.
Our suggestions: Our desk has already confirmed that they have no intention of trading at current prices. Either a break to fresh highs followed by a dip/retest, or a selloff down to either one of the above said supports is required before we consider a buy. However, as we pointed out in our previous report, we prefer to trade H4 zones when they have some connection to the higher timeframes, and right now, the only area that satisfies that requirement is the lowest of the three above noted areas at 18902, which is quite a way from current price! Therefore, at least for the time being, our team is on the sidelines here.
Data points to consider today: US ADP nonfarm employment change at 1.15pm, FOMC member Powell speaks at 4.45pm GMT.
Levels to watch/live orders:
- Buys: 18902 ([in light of its connection with the daily timeframe, one could, dependent on the time of day, consider entering here at market] stop loss: below the H4 candle tail of 18859).
- Sells: Flat (stop loss: N/A).
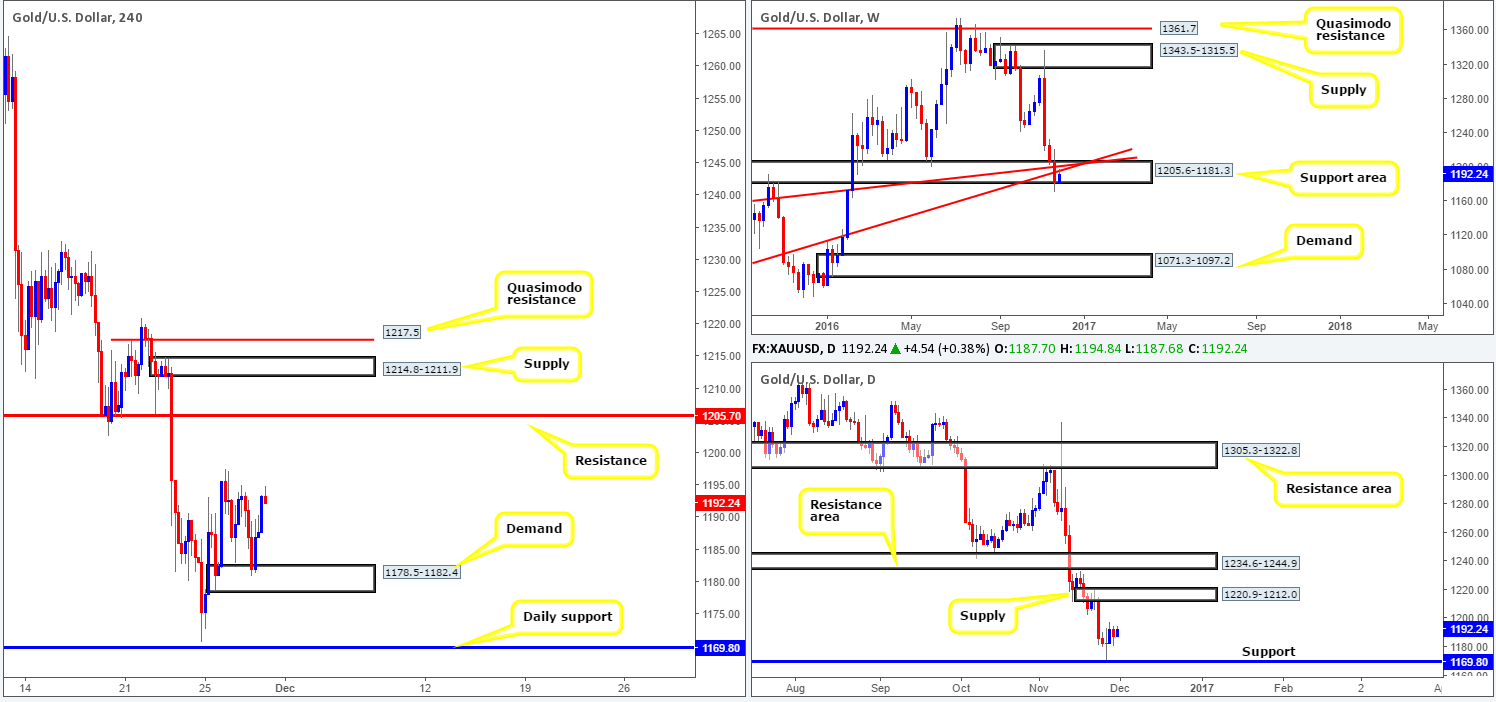
GOLD:
In Tuesday’s report, our desk noted that longs in this market were a possibility from the H4 demand at 1178.5-1182.4, given the space seen north on the H4 up to resistance at 1205.7 and also room on the daily chart to extend to supply coming in at 1220.9-1212.0. H4 price even chalked up a H4 bullish close off the area as confirmation. Well done to any of our readers who managed to lock in a position here!
Going forward, we’re now looking for price to break through Monday’s high 1197.4 and head toward the above said H4 resistance barrier. Now, to sell, we have three options:
- The above noted H4 resistance, which if you look to the weekly chart, you’ll see it converges nicely with the top edge of the support area at 1205.6-1181.3, which can, of course, be considered resistance (did not see this yesterday unfortunately).
- The H4 supply above at 1214.8-1211.9. Although this base is positioned above the weekly resistance mentioned in point 1, the area is housed within the current daily supply base.
- The H4 Quasimodo resistance at 1217.5. Similar to the H4 supply, this line is also located within the confines of daily supply.
Our suggestions: Shorts from 1205.7 would only be valid should a H4 bearish closing candle form, since price could head to the underside of the aforementioned daily supply. Sells from the above noted H4 supply and H4 Quasimodo resistance would, at least for our team, also require confirming price action as they are placed above the weekly resistance highlighted in point 1. Though, since both areas are packed reasonably close to each other, we would opt to wait for lower timeframe confirming action rather than a H4 bearish candle here (see the top of this report).
However, traders also have to be prepared for the possibility that price may not reach these sell zones, simply because weekly action is currently testing two trendline resistances (1130.1/1071.2).
Levels to watch/live orders:
- Buys: Flat (stop loss: N/A).
- Sells: 1205.7 ([reasonably sized H4 bearish close required prior to pulling the trigger] stop loss: ideally beyond the trigger candle).1217.5/1214.8-1211.9 ([waiting for lower timeframe confirming action is preferred] stop loss: dependent on where one confirms the area).


