Waiting for lower timeframe confirmation is our main tool to confirm strength within higher timeframe zones, and has really been the key to our trading success. It takes a little time to understand the subtle nuances, however, as each trade is never the same, but once you master the rhythm so to speak, you will be saved from countless unnecessary losing trades. The following is a list of what we look for:
- A break/retest of supply or demand dependent on which way you’re trading.
- A trendline break/retest.
- Buying/selling tails/wicks – essentially we look for a cluster of very obvious spikes off of lower timeframe support and resistance levels within the higher timeframe zone.
We typically search for lower-timeframe confirmation between the M15 and H1 timeframes, since most of our higher-timeframe areas begin with the H4. Stops are usually placed 1-3 pips beyond confirming structures.
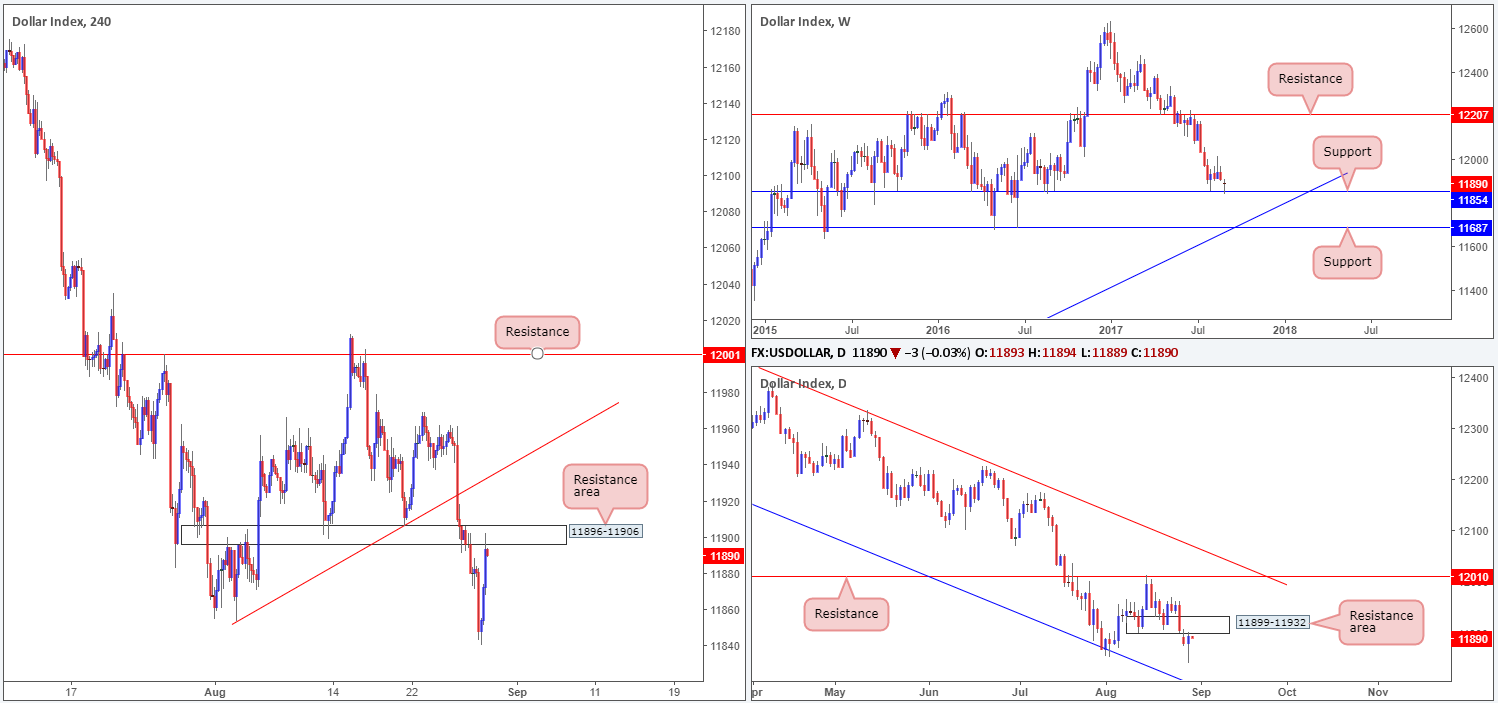
US dollar index (USDX):
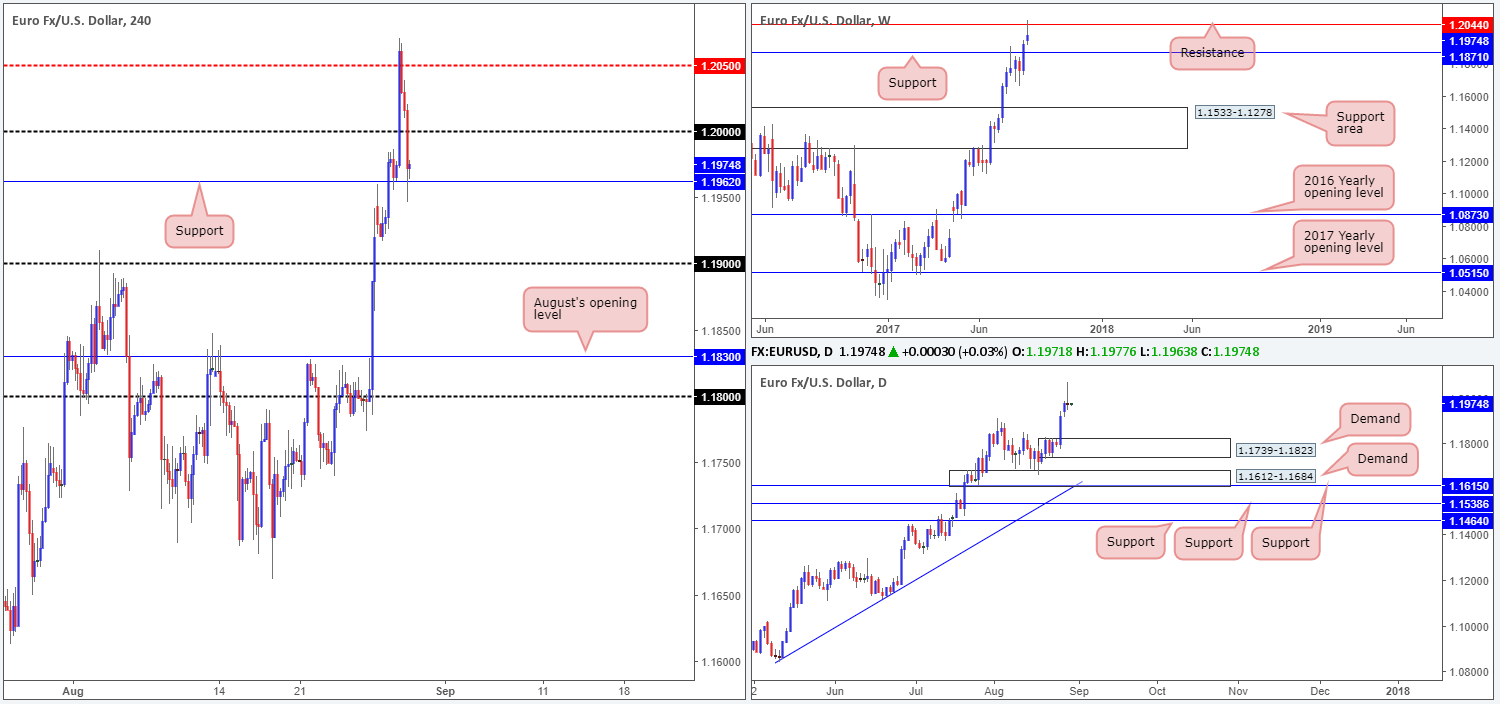
EUR/USD:
As tensions between North Korea and Japan ease, safe-haven assets reversed on Tuesday.
Going into the early hours of yesterday’s London session the single currency struck the H4 mid-level region 1.2050, which resulted in a heavy bout of selling being seen. The psychological band 1.20 was later taken out, permitting H4 price to challenge support at 1.1962 into the closing bell.
The latest downside move may also have something to do with the fact that weekly action recently crossed swords with a resistance line at 1.2044. The next downside target from here can be seen at 1.1871, a support that stretches as far back as 1993! Also of interest, daily flow printed a rather strong-looking selling wick and shows little support until we reach demand printed at 1.1739-1.1823.
Suggestions: With a weekly resistance level in play right now, coupled with a daily selling wick, a sell on any retest seen at 1.20 boundary is attractive. However, waiting for a lower-timeframe sell signal (see the top of this report) to form from this number before pulling the trigger is advised. This is largely due to psychological levels being prone to fakeouts and also because of the strong uptrend the EUR is entrenched within at the moment.
Should this trade come to fruition, we’ll be looking for H4 price to close below 1.1962. This will be our cue to reduce risk to breakeven and take partial profits.
Data points to consider: German Prelim CPI figures m/m (all day). US ADP non-farm employment change at 1.15pm, US Prelim GDP q/q at 1.30pm, followed closely by a speech from FOMC member Powell at 2.15pm GMT+1.
Levels to watch/live orders:
- Buys: Flat (stop loss: N/A).
- Sells: 1.20 region ([waiting for a lower-timeframe sell signal to form is advised] stop loss: dependent on where one confirms this number).
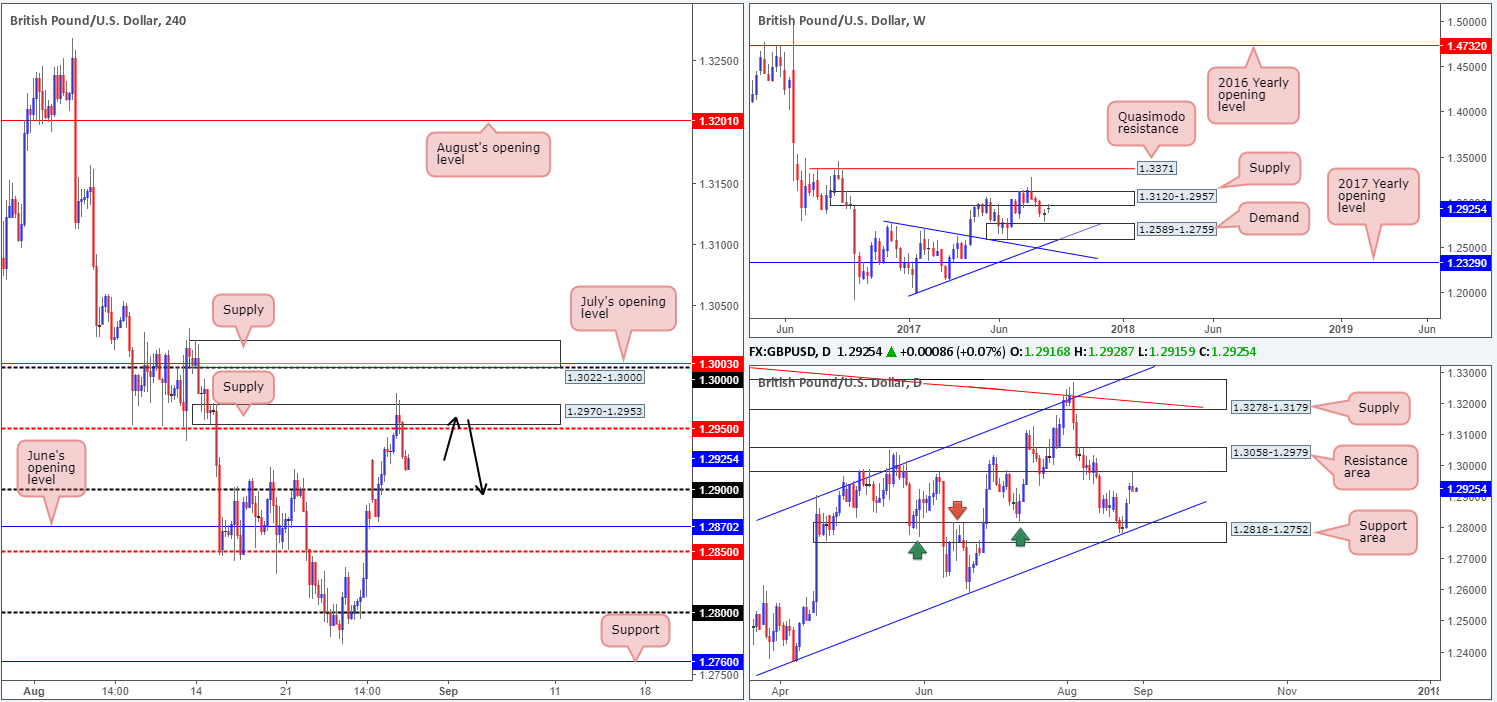
GBP/USD:
Following a brief spell above H4 supply at 1.2970-1.2953 during the early hours of London yesterday, the pair underwent a downside correction. A stronger dollar, coupled with price recently shaking hands with both a daily resistance area at 1.3058-1.2979 and a weekly supply at 1.3120-1.2957, also, we believe, heavily contributed to the latest downside move.
With H4 price now seen loitering between 1.2950 and the 1.29 handle, where does one go from here? Well, given the higher-timeframe structures, our desk is only interested in shorts for the time being. So with that being said, we’re going to be looking for the H4 candles to retest the recently challenged supply and hold firm. A reasonably sized H4 bearish candle formed at this zone (preferably a full, or near-full-bodied candle) would, for us, be an ideal entry trigger. As for take-profit zones, we’d be looking for the 1.29 handle and June’s opening level at 1.2870 as initial targets.
Suggestions: Should H4 price chalk up a bearish candle (preferably a full, or near-full-bodied candle) at 1.2970-1.2953 as per the black arrows, a short trade could be an option.
Data points to consider: US ADP non-farm employment change at 1.15pm, US Prelim GDP q/q at 1.30pm, followed closely by a speech from FOMC member Powell at 2.15pm GMT+1.
Levels to watch/live orders:
- Buys: Flat (stop loss: N/A).
- Sells: 1.2970-1.2953 ([waiting for a reasonably sized H4 bearish candle to form – preferably a full, or near-full-bodied candle – is advised] stop loss: ideally beyond the candle’s wick).
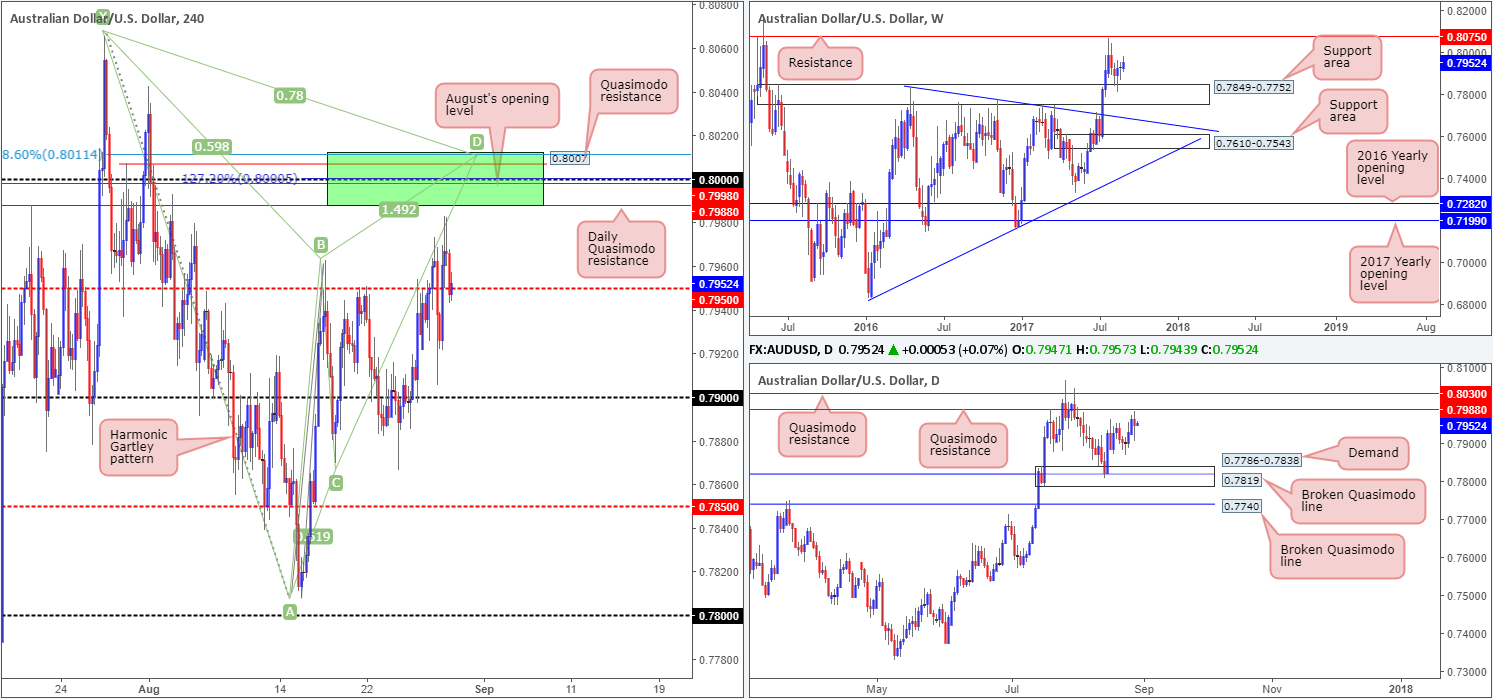
AUD/USD:
In recent trading, the commodity currency punched its way back above the H4 mid-level resistance at 0.7950 and clocked a high of 0.7982. As of current price, however, 0.7950 is being retested as a support, which we’re hoping will hold firm and lift the unit higher.
For those who have been following previous reports you will likely recall that our desk is eyeing the 0.80 boundary for shorting opportunities. Our reasoning behind liking 0.80, apart from 0.80 being a watched round number, is the several nearby structures:
- The daily Quasimodo resistance level at 0.7988.
- A H4 Quasimodo resistance level at 0.8007.
- A H4 127.2% Fib ext. point at 0.80 taken from the low 0.7807.
- August’s opening level at 0.7998.
- A H4 Harmonic Gartley reversal point at the 78.6% Fib resistance line drawn from 0.8011.
Suggestions: While the above structures (H4 green sell zone) boast attractive confluence, one must take into account the possibility that a fakeout may be seen up to the daily Quasimodo resistance level at 0.8030 sited just above the green zone. Traditionally, when trading the Gartley Harmonic pattern the stop-loss order should go beyond the X point (0.8065). If you were to follow this, a fakeout up to the daily Quasimodo resistance is not a concern. It is more for the aggressive traders who will likely look to position stops just beyond the green zone. Should you be one of those traders, you may want to consider waiting for the H4 candles to prove seller intent from the sell zone (in the form of either a full, or near-full-bodied bearish candle), before pulling the trigger. This will help avoid a fakeout should it occur.
Data points to consider: Australian building approvals m/m at 2.30am. US ADP non-farm employment change at 1.15pm, US Prelim GDP q/q at 1.30pm, followed closely by a speech from FOMC member Powell at 2.15pm GMT+1.
Levels to watch/live orders:
- Buys: Flat (stop loss: N/A).
- Sells: 0.8011/0.7988 (stop loss: either wait for a H4 bearish candle to form in the shape of a full, or near-full-bodied candle, and place stops above the candle’s wick. Another option is to simply enter at 0.80 and place stops above the H4 Harmonic X point at 0.8067).
USD/JPY:
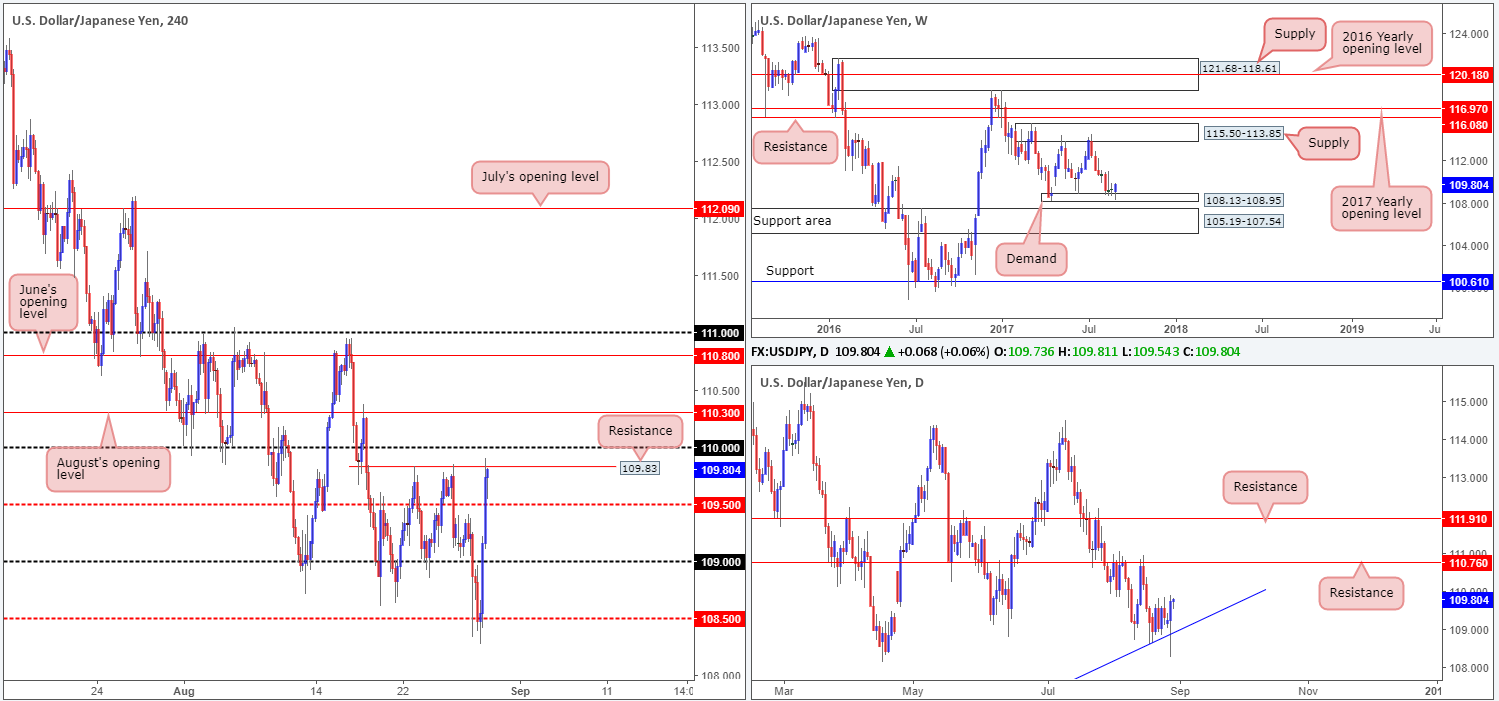
As tensions between North Korea and Japan subside, a strong recovery in US equities and the USD/JPY market was seen on Tuesday. The advance took H4 price beyond both the 109 handle and the mid-level resistance at 109.50, and ended the day colliding into a resistance level at 109.83.
For traders who are considering selling the noted resistance level, it might be worth noting what you’re selling into on the bigger picture. Weekly price remains trading around the demand at 108.13-108.95, alongside daily price seen respecting a trendline support extended from the low 100.08. With the next upside target not being seen until we reach the daily resistance at 110.76, we feel higher prices could be on the cards.
Suggestions: While the higher timeframes suggest further buying could be seen, H4 structure is unfortunately somewhat cramped at the moment. Not only do we have the current resistance in play, we also have the 110 handle seen directly above, which is followed closely by August’s opening level at 110.30. In light of this, our team will be remaining on the sidelines today.
Data points to consider: US ADP non-farm employment change at 1.15pm, US Prelim GDP q/q at 1.30pm, followed closely by a speech from FOMC member Powell at 2.15pm GMT+1.
Levels to watch/live orders:
- Buys: Flat (stop loss: N/A).
- Sells: Flat (stop loss: N/A).
USD/CAD:
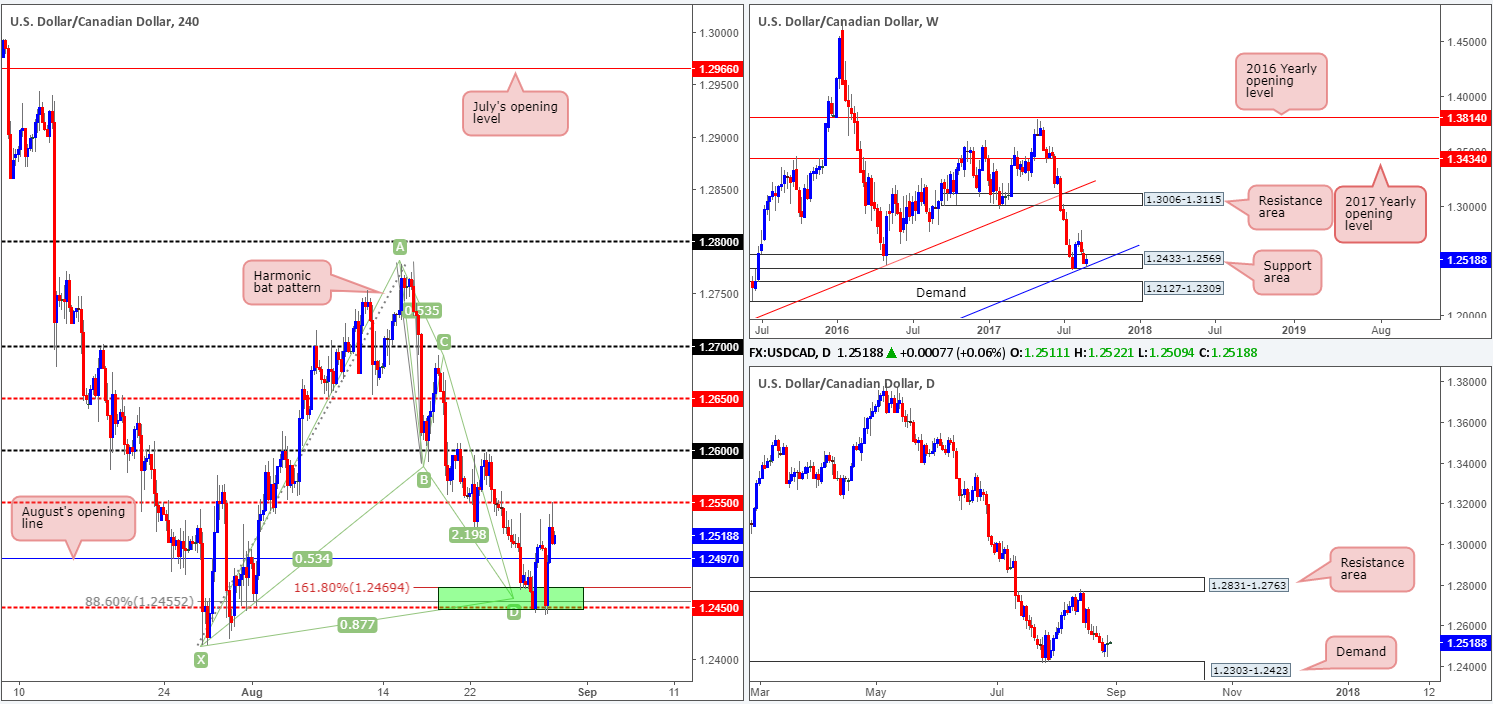
Trade update: long trade taken from 1.2455 was taken out at breakeven.
Kicking this morning’s report off with a look at the weekly timeframe, we can see that price remains bolstered by a support area coming in at 1.2433-1.2569 that unites with a trendline support etched from the low 0.9633. The story on the daily chart, nonetheless, shows price hovering just ahead of a demand base logged at 1.2303-1.2423, which happens to be positioned just beneath the current weekly support area.
Over on the H4 candles, price retested the 1.2450 neighborhood and rallied 100 pips to the 1.2550 region during the course of yesterday’s segment. As mentioned in previous reports, 1.2450 is reinforced by not only the weekly structures noted above, but also a H4 Harmonic bat pattern that completes at 1.2455 and a 161.8% H4 Fib ext. point at 1.2469.
Suggestions: In view of the weekly structures in play, August’s opening level at 1.2497 may hold firm as support today. Should the line hold ground and print a lower-timeframe buy signal (see the top of this report), we would be interested buyers here, with an initial target objective set at 1.2550.
Data points to consider: US ADP non-farm employment change at 1.15pm, US Prelim GDP q/q at 1.30pm, followed closely by a speech from FOMC member Powell at 2.15pm. Crude oil inventories at 3.30pm GMT+1.
Levels to watch/live orders:
- Buys: 1.2497 region ([waiting for a lower-timeframe buy signal to form is advised] stop loss: dependent on where one confirms this number).
- Sells: Flat (stop loss: N/A).
USD/CHF:
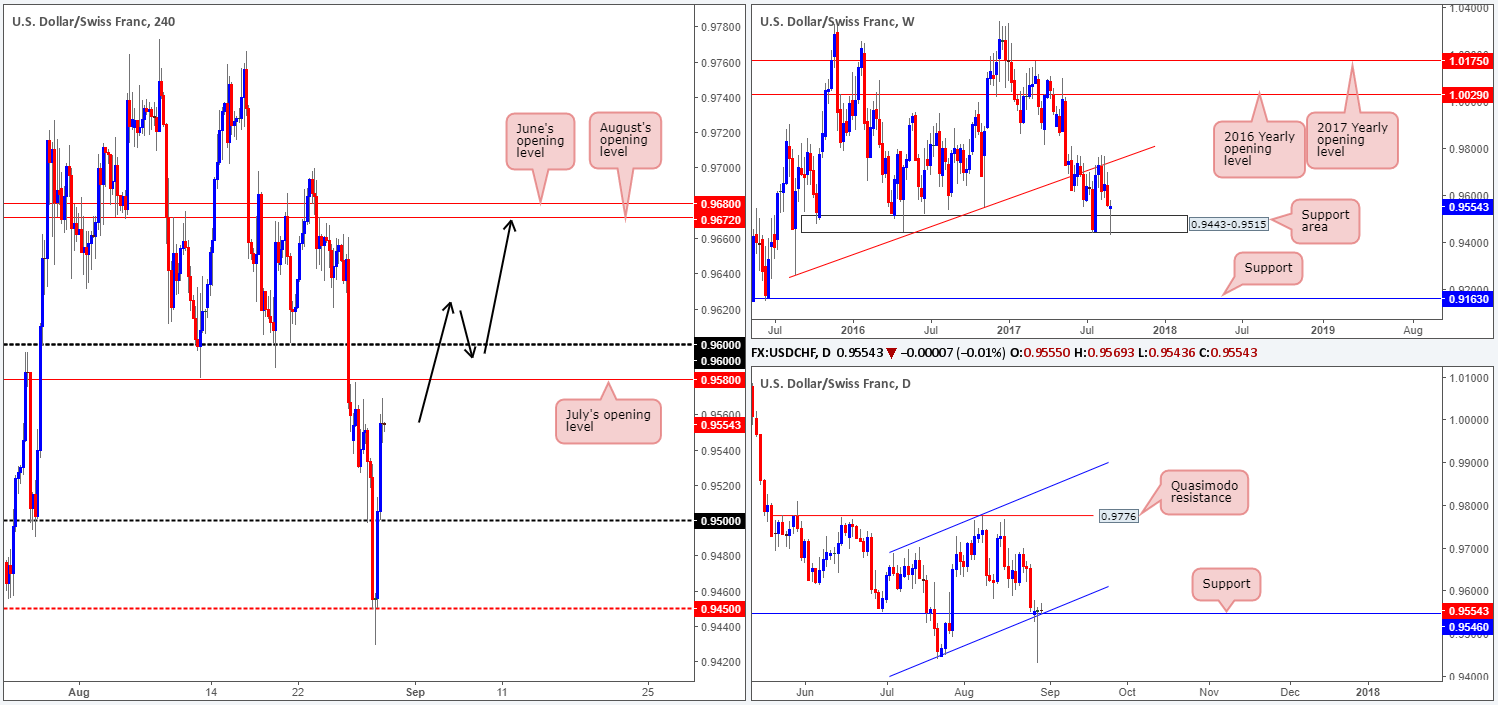
Fresh trading shows daily price whipsawed through support at 0.9546, which happens to unite with a channel support etched from the low 0.9438. The candle ended with price forming a beautiful-looking buying tail, which to candlestick traders, may be considered a buy signal. A little higher up on the curve, weekly price also bounced strongly from a support area coming in at 0.9443-0.9515. This zone has held price higher multiple times in the past, so we may see history repeat itself here. Over on the H4 timeframe, price stormed back above the 0.95 neighborhood amid yesterday’s US segment, and closed the day just ahead of July’s opening level at 0.9580.
Suggestions: Technically speaking, a sell at either 0.9580 or 0.96 is out of the question for us. Selling into potential weekly and daily buyers (see above) is not really our cup of tea! Therefore, we’re going to wait patiently and see if H4 price can close above 0.96. This – coupled with a retest and a reasonably sized H4 bullish candle in the shape of a full, or near-full-bodied candle would, in our opinion, be enough to validate a buy, targeting June/August’s opening levels at 0.9680/0.9672.
Data points to consider: US ADP non-farm employment change at 1.15pm, US Prelim GDP q/q at 1.30pm, followed closely by a speech from FOMC member Powell at 2.15pm GMT+1.
Levels to watch/live orders:
- Buys: Watch for H4 price to engulf beyond 0.96 and then look to trade any retest seen thereafter ([waiting for a H4 bullish candle to form following the retest is advised] stop loss: ideally beyond the candle’s tail).
- Sells: Flat (stop loss: N/A).
DOW 30:
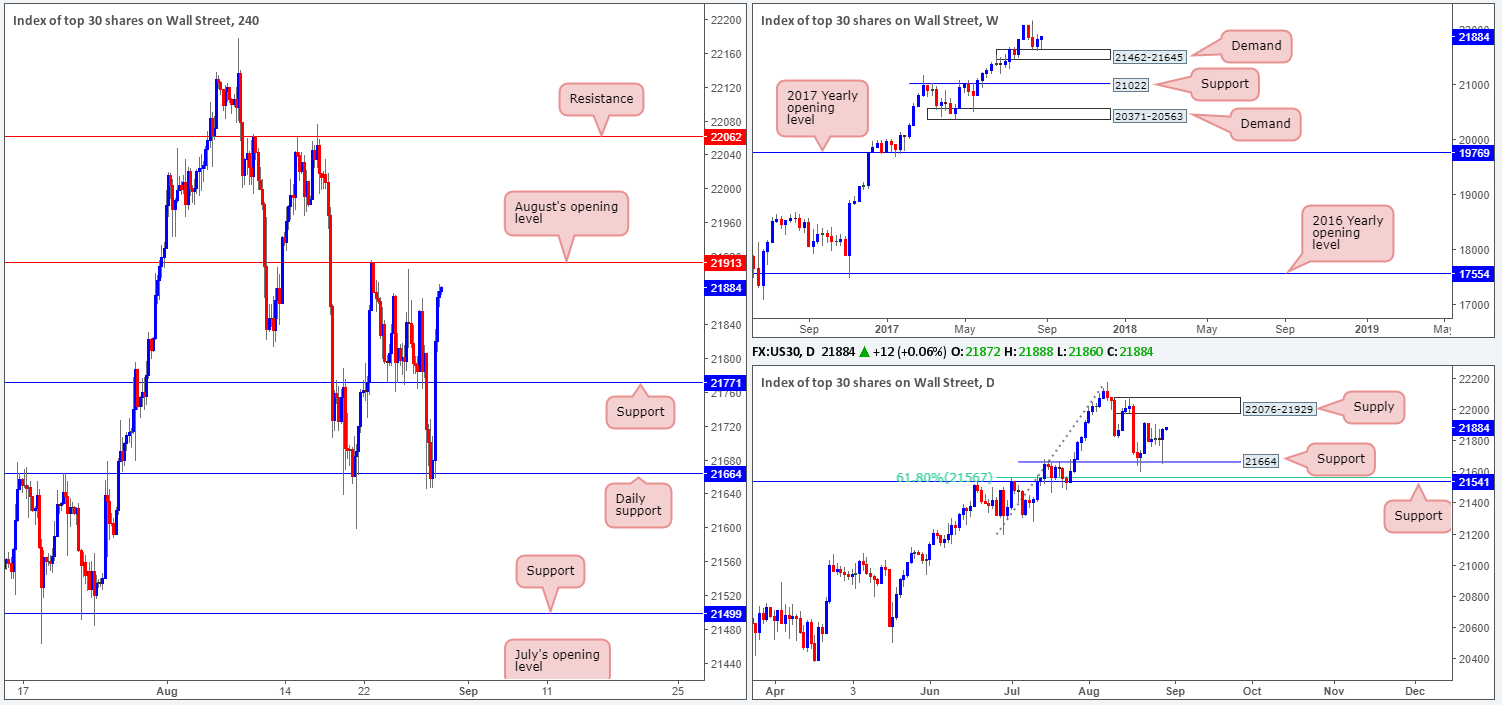
Risk-off momentum reversed on Tuesday as tensions between North Korea and Japan eased. H4 price recovered beautifully from daily support at 21664, which led to the unit engulfing resistance at 21771 and closing the day just ahead of August’s opening level at 21913. Now, considering how well this monthly band held on the 22nd August, would this be a line worthy of shorting? The short answer, at least in our opinion, is no. Our reasoning stems from the higher-timeframe structures. Weekly price remains afloat above demand at 21462-21645, and daily price recently tagged support at 21664 beautifully and formed a strong-looking buying tail.
Our suggestions: The strong underlying trend present in this market, coupled with the supports noted on the bigger picture, promotes a buyers’ market. Unfortunately, a H4 close above 21913 would land you a few points away from the underside of a daily supply zone at 22076-21929, thus making it a difficult market to buy at the moment. Although our bias is directed to the upside, we’re going to remain flat as buying into a daily supply would, despite where weekly price is trading from, not likely do our account any favors.
Data points to consider: US ADP non-farm employment change at 1.15pm, US Prelim GDP q/q at 1.30pm, followed closely by a speech from FOMC member Powell at 2.15pm GMT+1.
Levels to watch/live orders:
- Buys: Flat (stop loss: N/A).
- Sells: Flat (stop loss: N/A).
GOLD:
Gold prices pulled back on Tuesday as the dollar recovered from lows of 11840. This, as can be seen on the H4 chart, forced price to cross swords with the daily support at 1308.4. At the same time, however, we can also see the USDX H4 candles retesting the underside of a resistance area at 11896-11906, as well as a daily resistance area drawn from 11899-11932.
Given the points above, and the fact that weekly price on gold shows room to extend up to resistance at 1337.3, we have taken a long on the recently closed H4 bullish candle at 1311.9, with a stop planted at 1304.4. The risk/reward is quite substantial should the trade reach the noted weekly resistance level, which will be our ultimate take-profit target.
Our suggestions: Buy the market at current price and look to trail the metal up as far as the weekly resistance level at 1337.3.
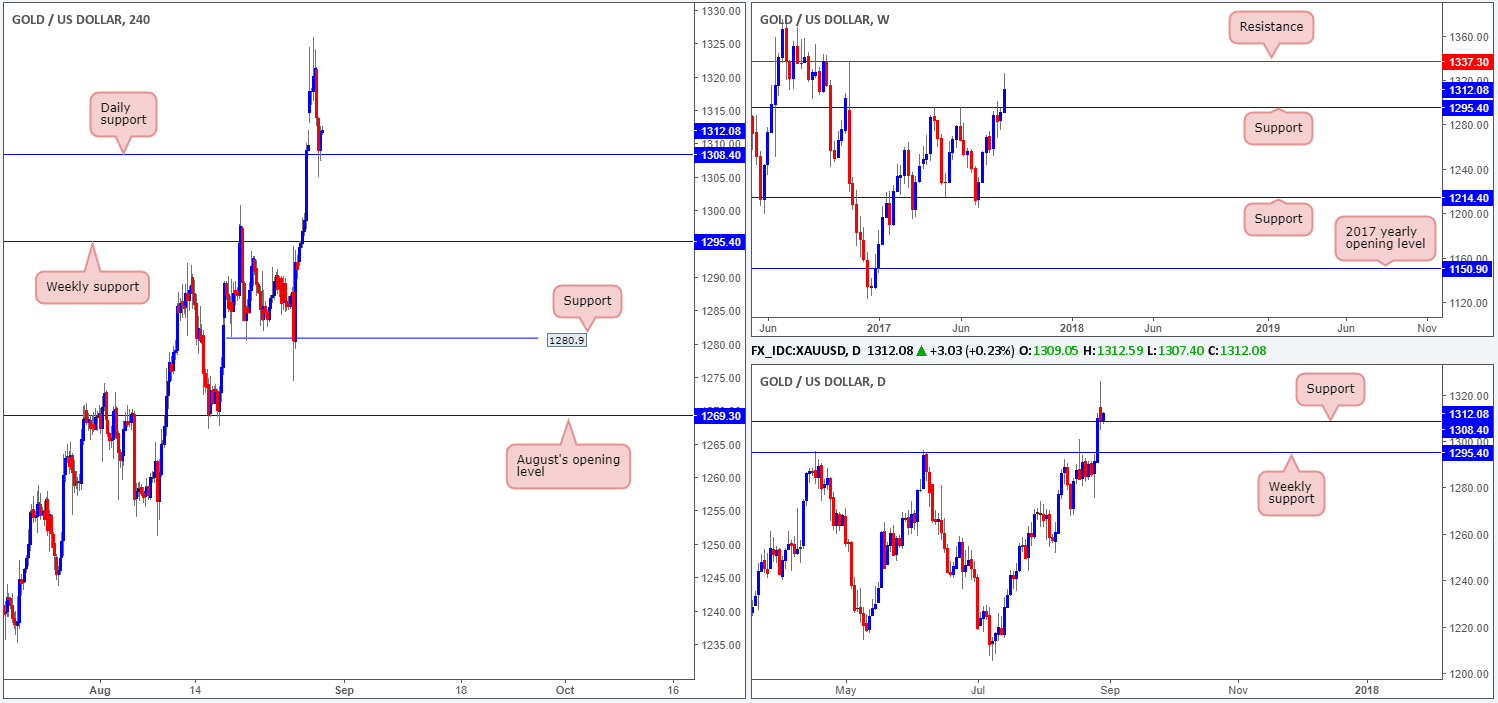
Levels to watch/live orders:
- Buys: 1311.9 ([live] stop loss: 1304.4).
- Sells: Flat (stop loss: N/A).


