EUR/USD:
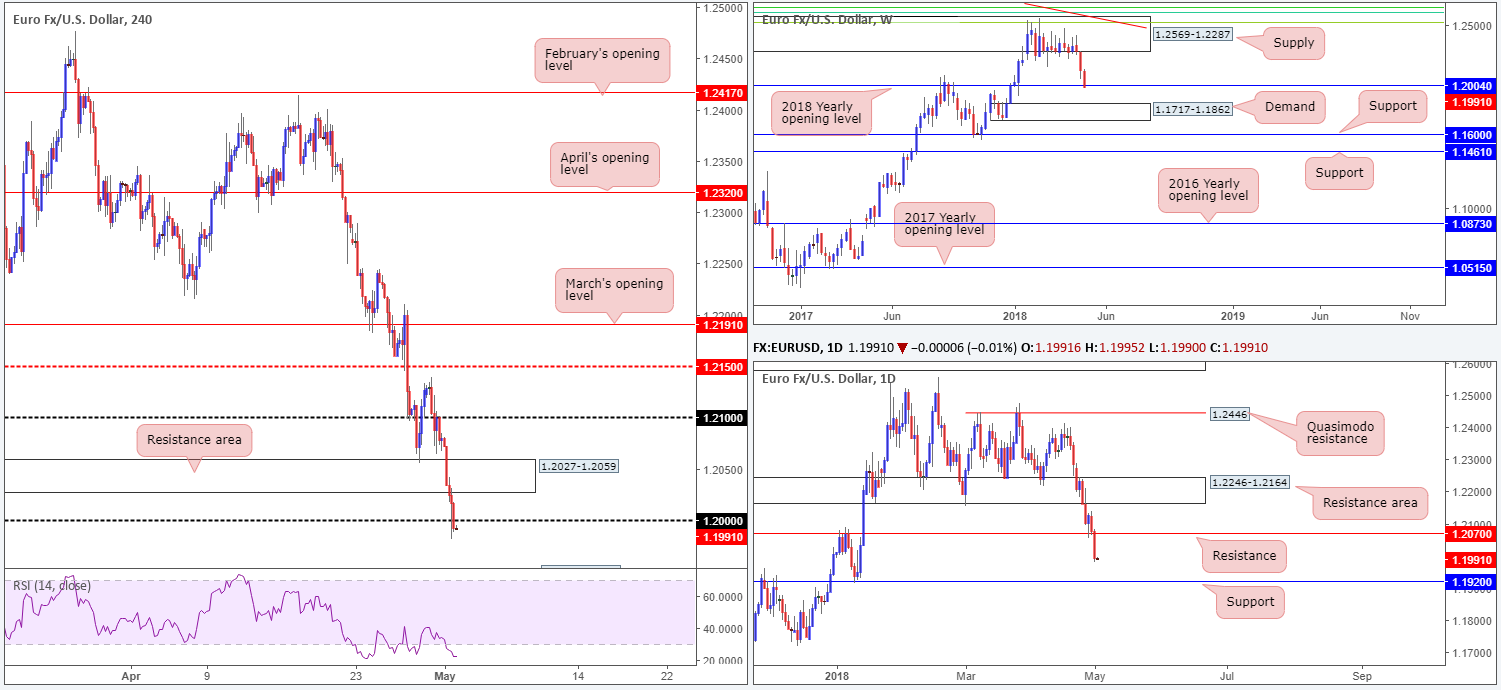
The value of the euro weakened in aggressive fashion on Tuesday, despite US ISM manufacturing data recording a less-than-stellar number. Largely influenced by USD movement, which firmly closed higher against the majority of its G10 peers, the EUR/USD concluded the day closing marginally beneath the key figure 1.20. Assuming this number remains in the clouds, the next port of call on the H4 scale falls in at 1.1929-1.1952: a H4 demand that boasts strong momentum from its base (not seen on the screen).
The story on the bigger picture shows weekly price has slightly dipped beneath the 2018 yearly opening level at 1.2004, and placed weekly demand at 1.1717-1.1862 in the spotlight. A little lower down on the daily timeframe, we can also see that daily support at 1.2070 was wiped out (now acting resistance), potentially clearing the path south down to daily support plotted at 1.1920.
Potential trading zones:
Technically speaking, further downside could be in store. A retest to the underside of 1.20 that produces a full or near-full-bodied H4 bearish rotation candle would, in our view, be enough to validate a short play, targeting the aforementioned H4 demand, followed closely by daily support positioned just beneath it at 1.1920. The ultimate target from here, nevertheless, would be the top edge of weekly demand at 1.1862.
Data points to consider today: EUR prelim flash GDP q/q; German Buba President Weidmann speaks; US ADP non-farm employment change; FOMC statement and Federal funds rate decision.
GBP/USD:
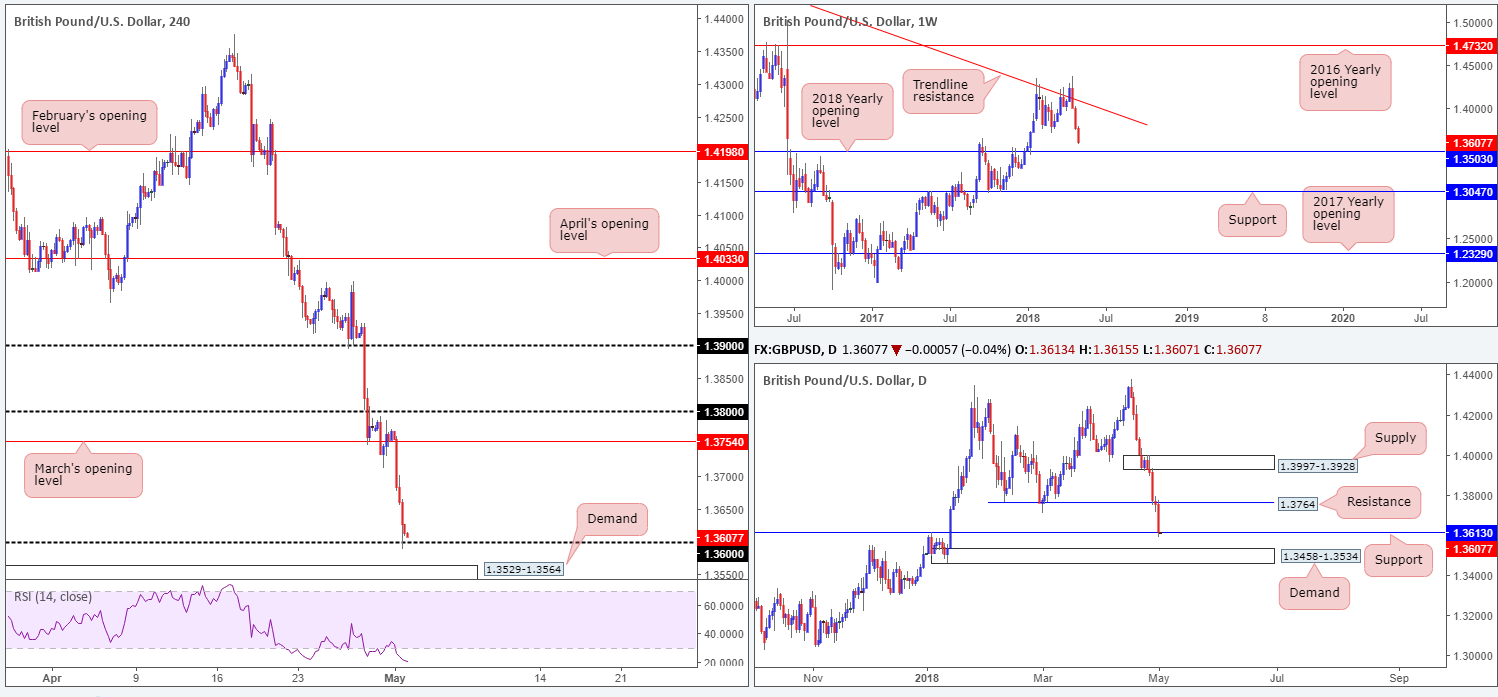
Sterling suffered further losses in wake of another raft of UK survey and data misses, further denting chances of a rate hike in May. The UK’s manufacturing sector reported a less-than-stellar number on Tuesday, with the PMI printing 53.9 vs. a previous reading of 54.9, downwardly revised from 55.1.
As is evident from the H4 timeframe, the candles ended the session shaking hands with the 1.36 handle, which held firm into the close. Traders may have also noticed that daily support at 1.3613 was brought into the fray following yesterday’s descent. Should we see additional selling beyond 1.36, the H4 demand area based at 1.3529-1.3564 is the next target on the hit list. On the other side of the spectrum, however, weekly price appears poised to dig lower and challenge the 2018 yearly opening level seen at 1.3503.
Potential trading zones:
Given weekly structure continuing to reflect a strong bearish posture, the 1.36 handle on the H4 timeframe is likely to give way today. This will almost immediately bring the current H4 demand into the fight at 1.3529-1.3564, which happens to be glued to the top edge of the daily demand area at 1.3458-1.3534 that also houses the 2018 yearly opening level at 1.3503 on the weekly chart.
On account of this information, selling could be a challenge at the moment. Traders who are looking to trade this market countertrend, however, buying around the top edge of the daily demand seems reasonable in view of its surrounding confluence. Just remember though, you ARE buying against sentiment here so aggressive trade management is advised!
Data points to consider today: UK construction PMI; US ADP non-farm employment change; FOMC statement and Federal funds rate decision.
AUD/USD:
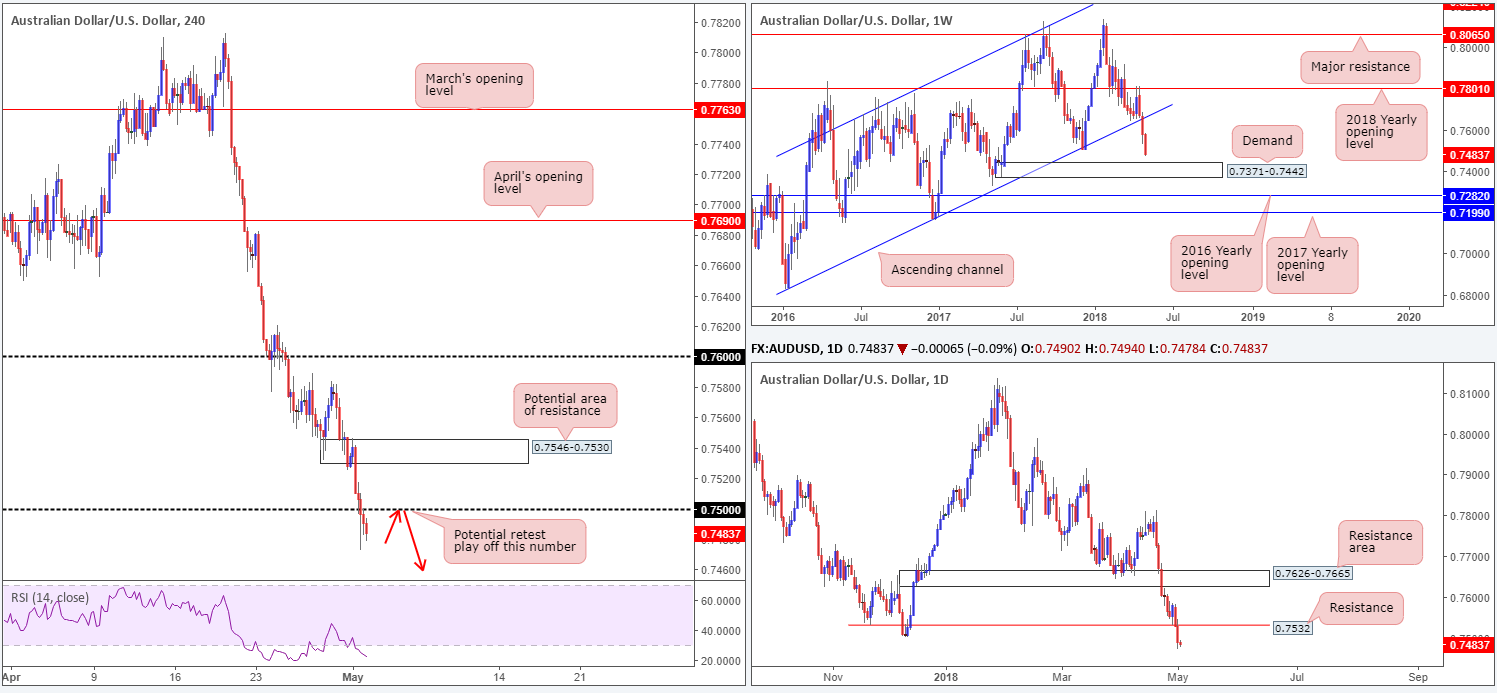
The Australian dollar sunk lower on Tuesday as the US dollar continues to recover in strong fashion.
Weekly price cleared a major swing low at 0.7501 (04/12/17) in recent movement, potentially opening up the path south to weekly demand positioned at 0.7371-0.7442. In similar fashion, daily price took out support at 0.7532 and is now cleared to approach a daily demand base located within the lower limit of the noted weekly demand at 0.7371-0.7429 (not seen on the screen). In addition, we can also see room for H4 action to extend lower after breaching the 0.75 handle. The next downside target on this scale falls in at a fresh H4 demand placed at 0.7422-0.7439 (positioned within the top edge of the current weekly demand and glued to the top edge of the aforementioned daily demand).
Potential trading zones:
Put simply, the underside of 0.75 on the H4 timeframe appears reasonable for a retest play today. A retest of this number in the shape of a full or near-full-bodied H4 bearish rotation candle would, in our view, be enough to validate a short, targeting the aforementioned H4 demand area, which as we already know, has strong connections to higher-timeframe demands, thus making it a firm take-profit zone.
Data points to consider today: China Caixin manufacturing PMI; US ADP non-farm employment change; FOMC statement and Federal funds rate decision.
USD/JPY:
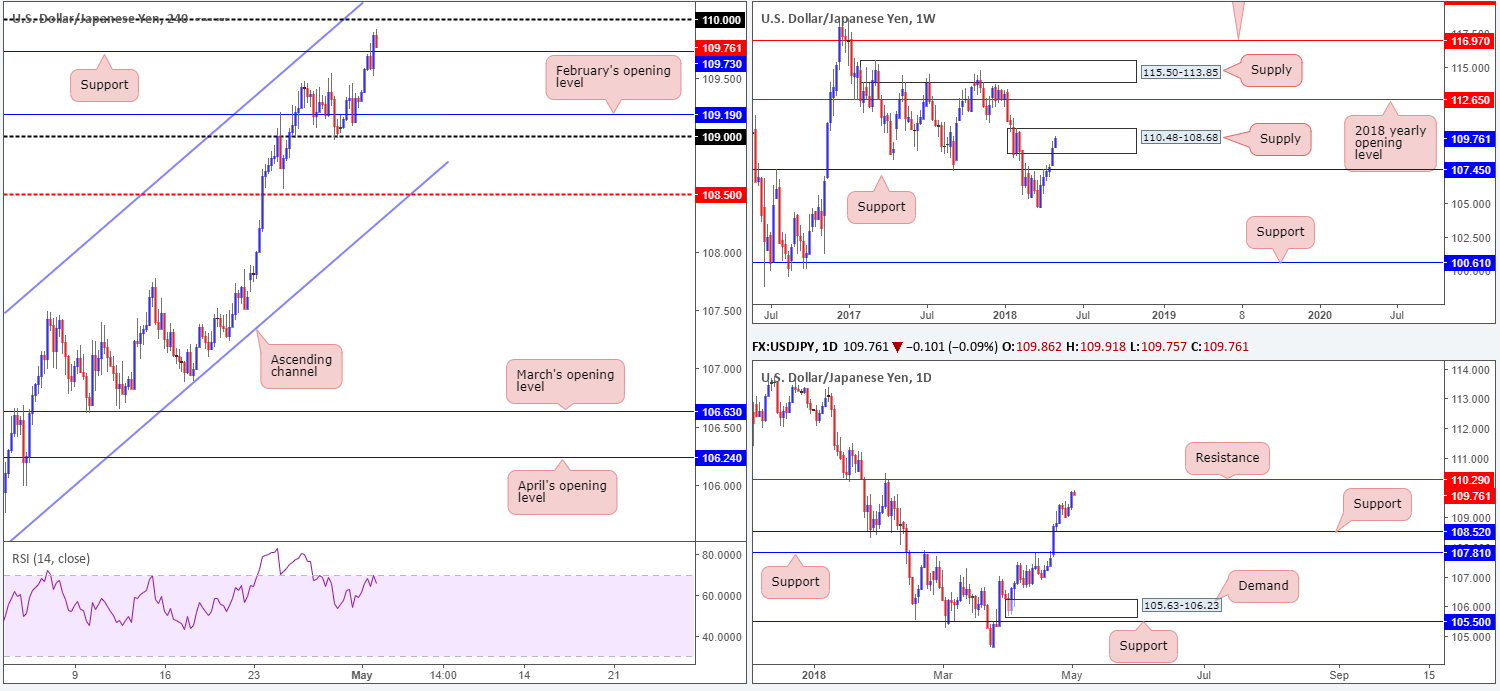
Disappointing US economic data was clearly not enough to deter USD/JPY bulls on Tuesday. Helping the pair was a robust USD across the board and the 10-year Treasury yield seen bouncing from daily support at 2.94%.
Weekly supply at 110.48-108.68 remains intact, despite recent buying. A breach of this area could attract further upside towards the 2018 yearly opening level at 112.65. Meanwhile, down on the daily timeframe we do not see much stopping the unit from climbing higher in the near term until we collide with daily resistance plotted at 110.29. In recent hours, however, the H4 candles broke through resistance at 109.73 (now acting support). This has, as you can see, placed the crosshairs on the nearby 110 handle.
Potential trading zones:
The momentum behind this market at the moment is strong. Therefore, selling into this directional flow is chancy despite all three of the above noted timeframes highlighting resistance either in play or positioned nearby.
With that in mind, traders have a choice: either pass on this market, or attempt to trade in-line with sentiment.
Intraday, longs from H4 support could be an option at 109.73. Yes, there is potential for resistance to form from 110 here! We see this. The idea is that momentum will break 110 and lead us to daily resistance at 110.29, which is an ideal location to think about taking partial profits. Ideally, though, we’d recommend reducing risk to breakeven upon closing above 110 (H4).
Data points to consider today: US ADP non-farm employment change; FOMC statement and Federal funds rate decision.
USD/CAD:
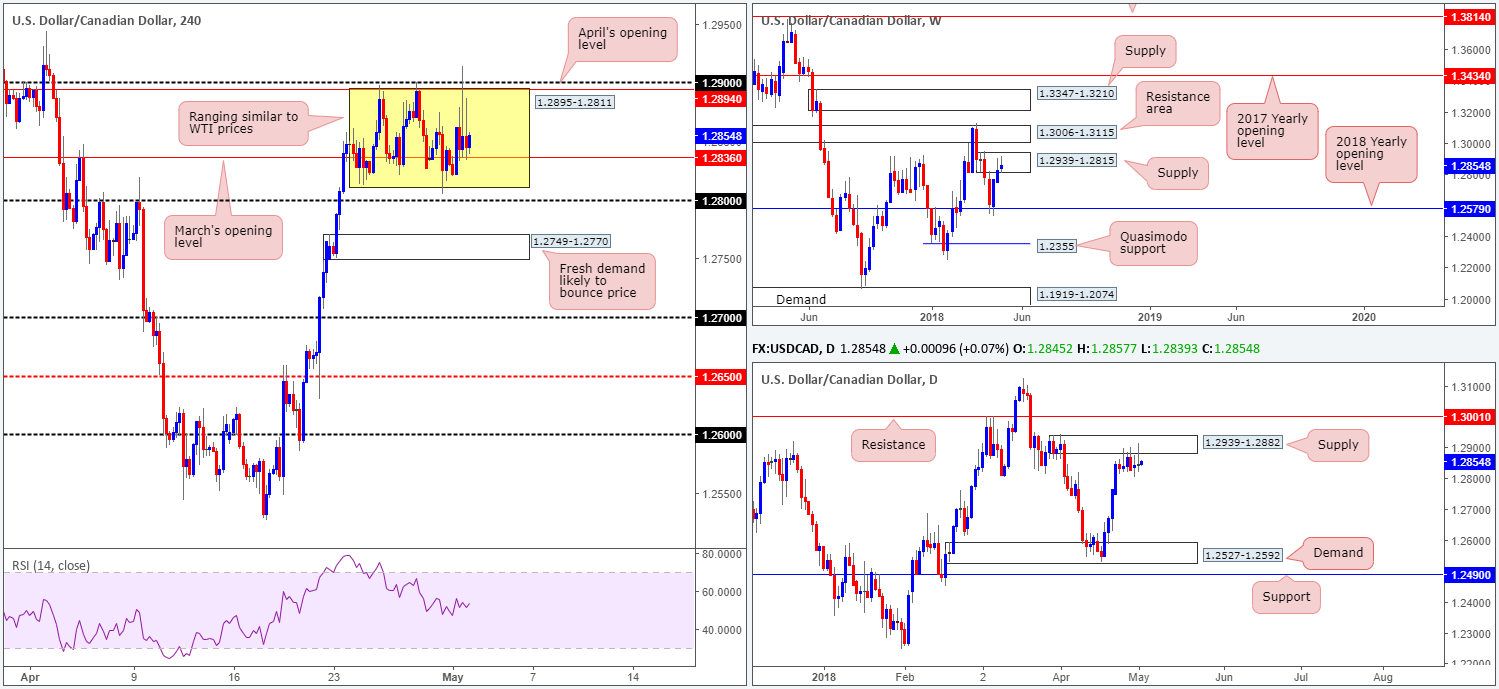
Despite a round of US and Canadian economic releases on Tuesday, as well as BoC governor Poloz taking to the stage, the H4 candles remain fluctuating between 1.2895/1.2811 (within the area is March’s opening level seen at 1.2836). In spite of this, though, the team, as highlighted in Tuesday’s report, remains biased to the downside.
Weekly action is seen trading from within the boundaries of a weekly supply at 1.2939-1.2815, following a stronger-than-expected rebound off the 2018 yearly opening level at 1.2579 two weeks ago. In conjunction with weekly flow, daily price recently crossed swords with a daily supply zone at 1.2939-1.2882 and has held ground since March 25. Also worthy of note is the strong daily selling wick printed off the back of this zone yesterday.
Potential trading zones:
A break of 1.28 would likely spark a round of selling. However, the fresh H4 demand based at 1.2749-1.2770 is highly likely to bounce price. With that in mind, we would recommend waiting for the current H4 demand area to be engulfed (and preferably retested as resistance) before considering short positions. Yes, the next downside target is relatively close from an intraday perspective: 1.27, but given that the next support target on the bigger picture does not come into view until daily demand at 1.2527-1.2592, it’s possible that the unit could drop as far south as 1.26s!
Data points to consider today: US ADP non-farm employment change; FOMC statement and Federal funds rate decision.
USD/CHF:
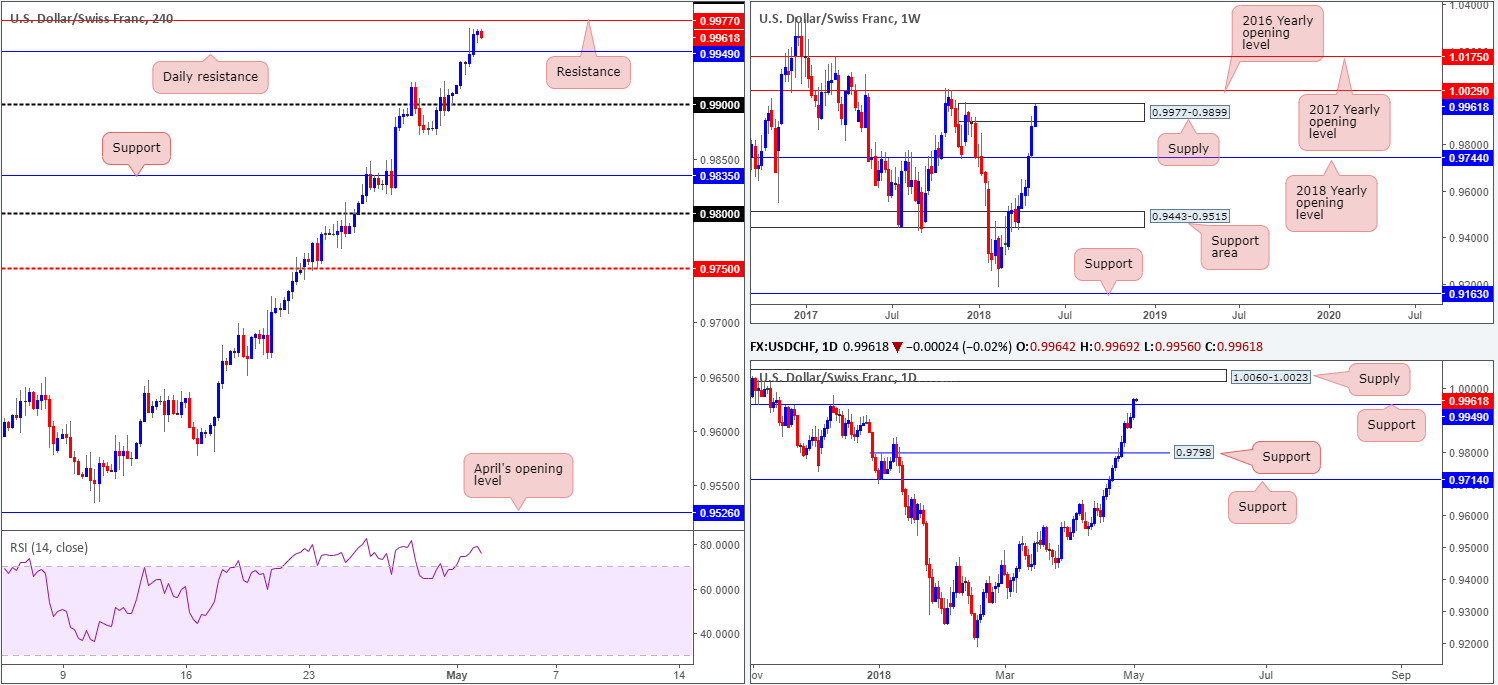
The US dollar continued to gain ground against its Swiss counterpart over the course of Tuesday’s sessions. After taking care of orders sited around 0.99, the H4 candles have since gravitated north and printed a mild top just south of a H4 resistance level priced in at 0.9977. As parity (1.0000) is positioned just north of this level, we feel this will likely act as a magnet to short-term movement today.
From another point of view, daily price recently violated a daily resistance level plotted at 0.9949 (now acting support), with the next upside hurdle now in sight at 1.0060-1.0023: a daily supply zone. Weekly price, on the other hand, is currently seen trading within the upper boundaries of a weekly supply zone at 0.9977-0.9899. As of yet we have seen little in terms of bearish intent produced from this zone. A breach, therefore, will possibly highlight further buying till we shake hands with the 2016 yearly opening level at 1.0029.
Potential trading zones:
Longer term we are expecting to see the USD enter into a corrective phase soon. This is not only due to the 2016 yearly opening level at 1.0029, which is housed within daily supply at 1.0060-1.0023, it is also due to a monthly supply zone seen on the DXY at 95.13-92.75.
Short term, however, buying could still be an option. A retest of daily support at 0.9949 (before H4 price connects with H4 resistance overhead at 0.9977 is preferred) could be an ideal platform to hunt for short-term buying opportunities today. Apart from the H4 resistance mentioned, upside targets fall in at 1.0000, followed by the underside of daily supply at 1.0023.
Data points to consider today: US ADP non-farm employment change; FOMC statement and Federal funds rate decision.
Dow Jones Industrial Average:
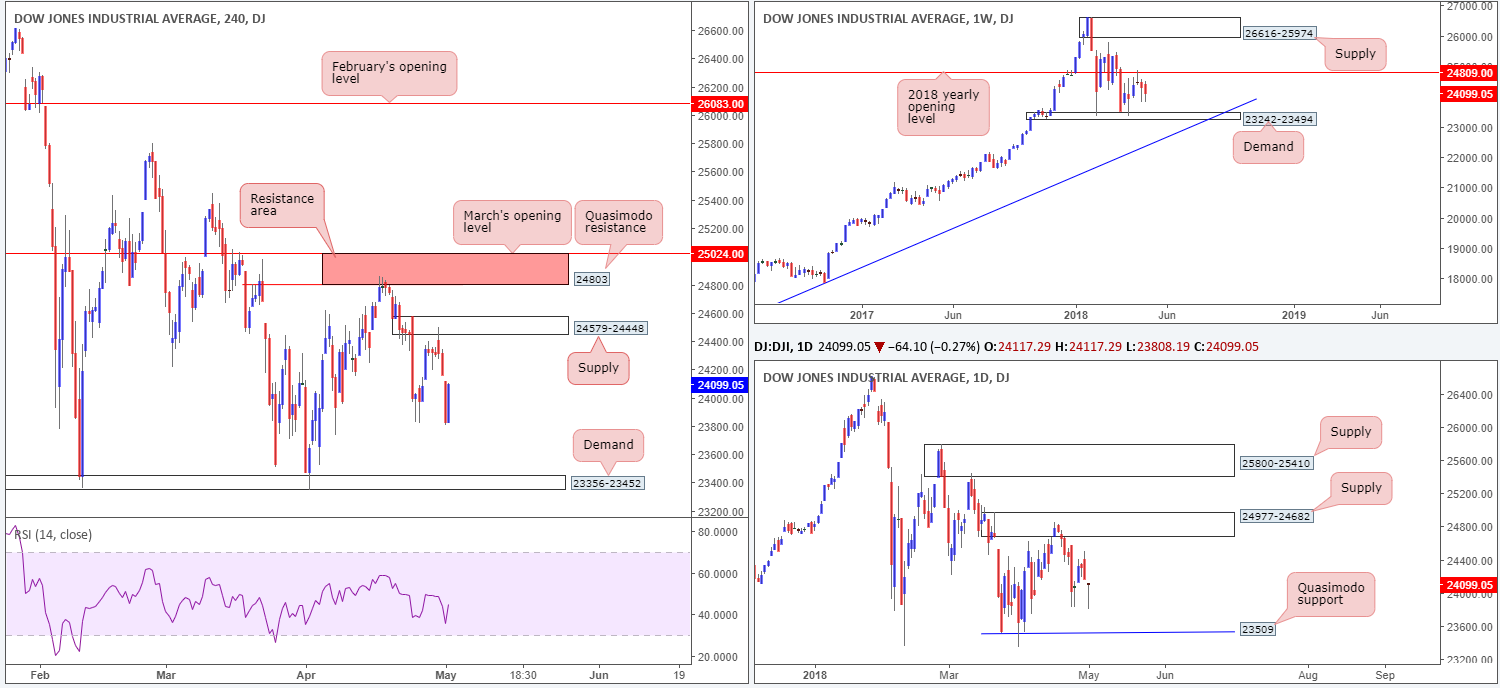
Although earnings are stellar the stock market indexes are not breaking out to the upside. H4 supply at 24579-24448 held beautifully on Monday and tested last Wednesday’s low of 23823 during Tuesday’s movement. So far, the lows have managed to hold prices higher, consequently producing a nice-looking daily bullish pin-bar formation as a result. Overall, though, daily structure remains capped between a daily supply zone pictured at 24977-24682 and a daily Quasimodo support at 23509. On a similar note, weekly structure is also seen ranging between the 2018 yearly opening level at 24809 and a weekly demand based at 23242-23494.
Potential trading zones:
The H4 supply noted above at 24579-24448 is an area to keep eyeballs on today, as is the H4 resistance area seen directly above it at 25024-24803. Comprised of March’s opening level and a H4 Quasimodo resistance this area is a high-probability reversal zone, since it also houses the 2018 yearly opening level at 24809 and has connections to the current daily supply zone. Also worthy of note is the H4 demand area at 23356-23452, given it is positioned just beneath the aforementioned daily Quasimodo support.
Personally we favor the H4 resistance area at 25024-24803 and the H4 demand at 23356-23452, due to its relationship with higher-timeframe structure.
Data points to consider today: US ADP non-farm employment change; FOMC statement and Federal funds rate decision.
GOLD (XAU/USD SPOT):
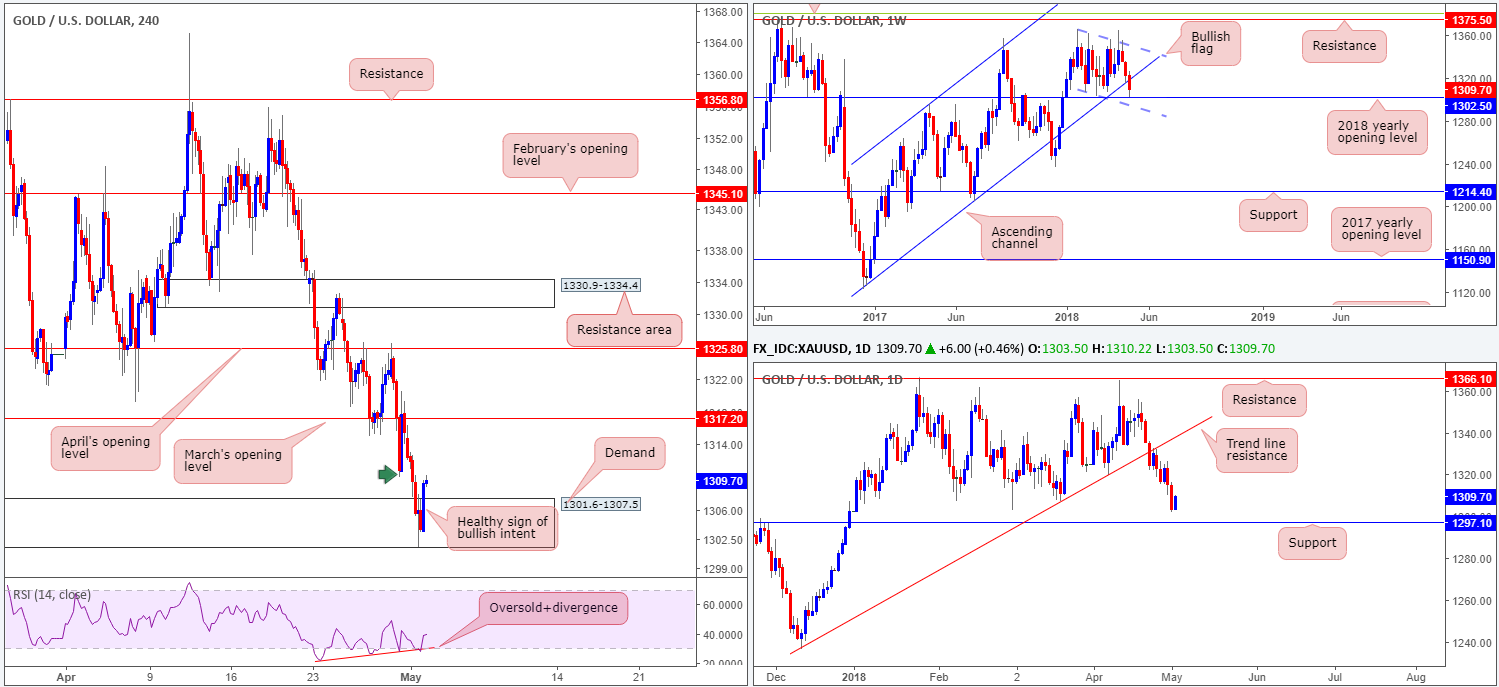
In recent dealings we have seen bullion come into contact with the 2018 yearly opening level plotted on the weekly timeframe at 1302.5, after breaking out of a long-term weekly ascending channel (1122.8). Although this level remains defensive, daily action exhibits room to potentially press to lower levels: daily support notched in at 1297.1.
Bolstered by H4 RSI displaying oversold/divergence readings, H4 demand at 1301.6-1307.5, which boasts an impressive history thus far, has once again held ground. Overhead, we see potential resistance forming from Monday’s swing low 1310.0 marked with a green arrow, followed then by March’s opening level at 1317.2.
Potential trading zones:
The H4 bullish rotation candle printed from within the current H4 demand (which encapsulates the 2018 yearly opening level mentioned above on the weekly timeframe at 1302.5) is, at least in our view, a sign of bullish strength, meaning this could be a good opportunity to buy into this market with stops planted below the aforementioned H4 demand. Our only concern here is that the DXY has yet to connect with monthly supply at 95.13-92.75 (USD downside movement tends to lift gold prices).
Should the above information be sufficient to meet the needs of your trading plan, we recommend trailing price aggressively, reducing risk as soon as possible and looking to take partial profits at 1317.0.
This site has been designed for informational and educational purposes only and does not constitute an offer to sell nor a solicitation of an offer to buy any products which may be referenced upon the site. The services and information provided through this site are for personal, non-commercial, educational use and display. IC Markets does not provide personal trading advice through this site and does not represent that the products or services discussed are suitable for any trader. Traders are advised not to rely on any information contained in the site in the process of making a fully informed decision.
This site may include market analysis. All ideas, opinions, and/or forecasts, expressed or implied herein, information, charts or examples contained in the lessons, are for informational and educational purposes only and should not be construed as a recommendation to invest, trade, and/or speculate in the markets. Any trades, and/or speculations made in light of the ideas, opinions, and/or forecasts, expressed or implied herein, are committed at your own risk, financial or otherwise.
The use of the site is agreement that the site is for informational and educational purposes only and does not constitute advice in any form in the furtherance of any trade or trading decisions.
The accuracy, completeness and timeliness of the information contained on this site cannot be guaranteed. IC Markets does not warranty, guarantee or make any representations, or assume any liability with regard to financial results based on the use of the information in the site.
News, views, opinions, recommendations and other information obtained from sources outside of www.icmarkets.com.au, used in this site are believed to be reliable, but we cannot guarantee their accuracy or completeness. All such information is subject to change at any time without notice. IC Markets assumes no responsibility for the content of any linked site. The fact that such links may exist does not indicate approval or endorsement of any material contained on any linked site.
IC Markets is not liable for any harm caused by the transmission, through accessing the services or information on this site, of a computer virus, or other computer code or programming device that might be used to access, delete, damage, disable, disrupt or otherwise impede in any manner, the operation of the site or of any user’s software, hardware, data or property.


