A note on lower timeframe confirming price action…
Waiting for lower timeframe confirmation is our main tool to confirm strength within higher timeframe zones, and has really been the key to our trading success. It takes a little time to understand the subtle nuances, however, as each trade is never the same, but once you master the rhythm so to speak, you will be saved from countless unnecessary losing trades. The following is a list of what we look for:
- A break/retest of supply or demand dependent on which way you’re trading.
- A trendline break/retest.
- Buying/selling tails/wicks – essentially we look for a cluster of very obvious spikes off of lower timeframe support and resistance levels within the higher timeframe zone.
- Candlestick patterns. We tend to only stick with pin bars and engulfing bars as these have proven to be the most effective.
We search for lower timeframe confirmation between the M15 the H1 timeframes, since most of our higher-timeframe areas begin with the H4. Stops are usually placed 5-10 pips beyond confirming structures.
EUR/USD:
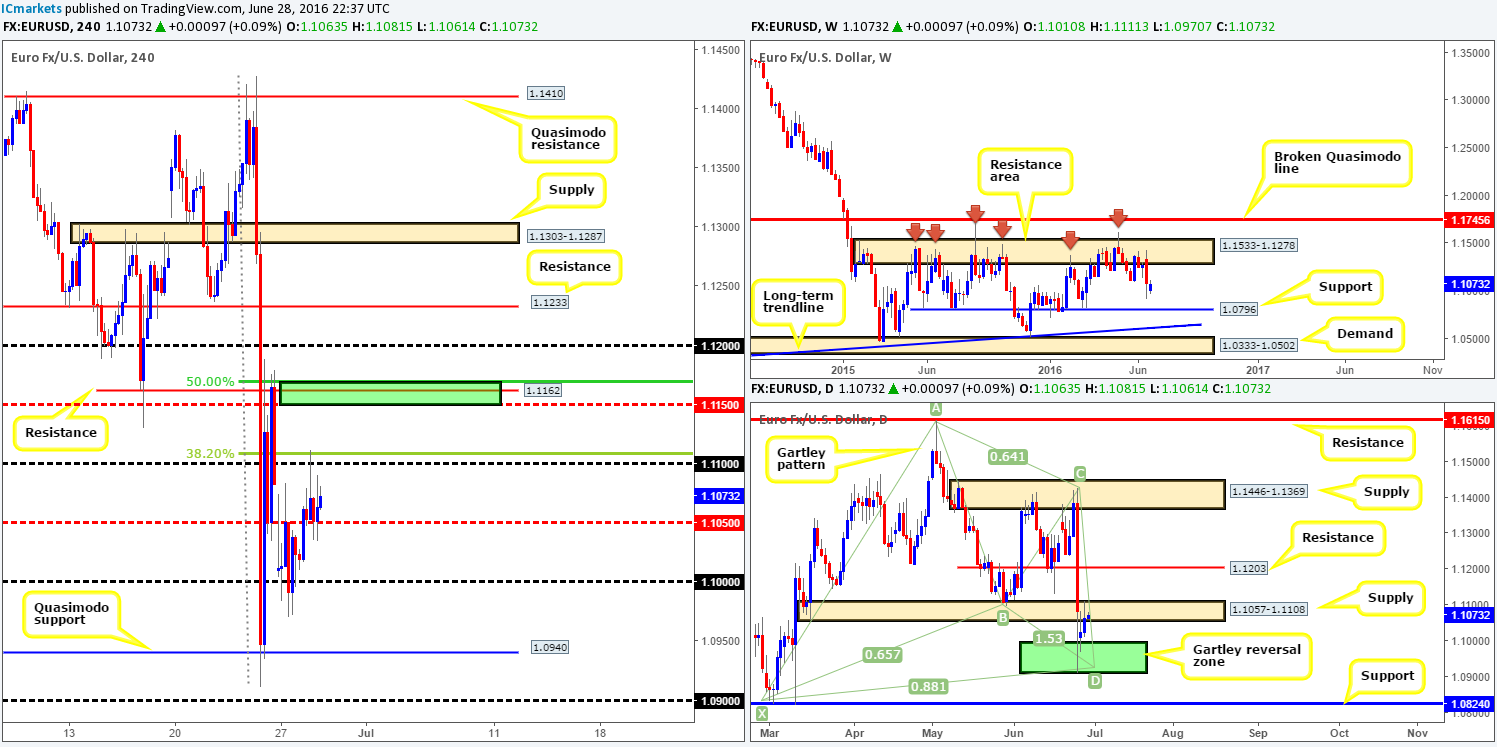
In recent trading, the EUR broke above the H4 mid-way resistance line at 1.1050 and, as you can see, continued to advance up to the 1.11 handle – more specifically, the H4 38.2% Fib resistance at 1.1109. For those who read our previous report you may recall that we labeled this small zone as a potential reversal area. Well done to any of our readers who managed to skim some pips out of the rebound as price dropped over sixty pips from this small zone.
Moving forward, our analysis over on the higher timeframes show weekly action looks as though it’s heading in the direction of a weekly support penciled in at 1.0796 and daily price is now lodged within a daily supply area at 1.1057-1.1108. To our way of seeing things, the current daily supply zone should hold if weekly bears intend to continue pushing this market lower. However, this is the EUR/USD and although this market has been calmer ‘post-Brexit’, uncertainty surrounding this event is still very much a factor in our opinion.
Our suggestions: Here are the levels we feel worthy of attention going into today’s sessions:
- The H4 resistance at 1.1162 (green rectangle) is a line we’ll be keeping an eye on today/this week due to the fact that this is where price managed to bounce during ‘Brexit’. In addition, this area is bolstered together with a H4 Fib resistance at 1.1170 and a H4 mid-way resistance at 1.1150. Do, however, keep your eyes open here as a fakeout through this zone up to daily resistance at 1.1203 (along with the 1.12 handle) is highly possible.
- Although the weekly chart shows price trading from a weekly resistance area at 1.1533-1.1278, we still really like the look of the H4 Quasimodo support line at 1.0940. Not only is this number positioned within the daily Gartley reversal zone at 1.0910/1.0994 (green box), it was also here where price began to reverse following the ‘Brexit’ shock.
Given the possibility of ‘post-Brexit’ volatility, we would not recommend placing pending orders at either of the above said barriers as you’re opening yourself up to the possibility of getting faked out. Waiting for lower timeframe confirmation is, in our opinion, the best path to take. Confirmation for our team is either a break of a supply/demand followed by a subsequent retest, a trendline break/retest or simply a collection of well-defined buying/selling tails/wicks around the higher timeframe level.
Levels to watch/live orders:
- Buys: 1.0940 region [Tentative – confirmation required] (Stop loss: dependent on where one confirms this area).
- Sells: 1.1162 region [Tentative – confirmation required] (Stop loss: dependent on where one confirms this area).
GBP/USD:
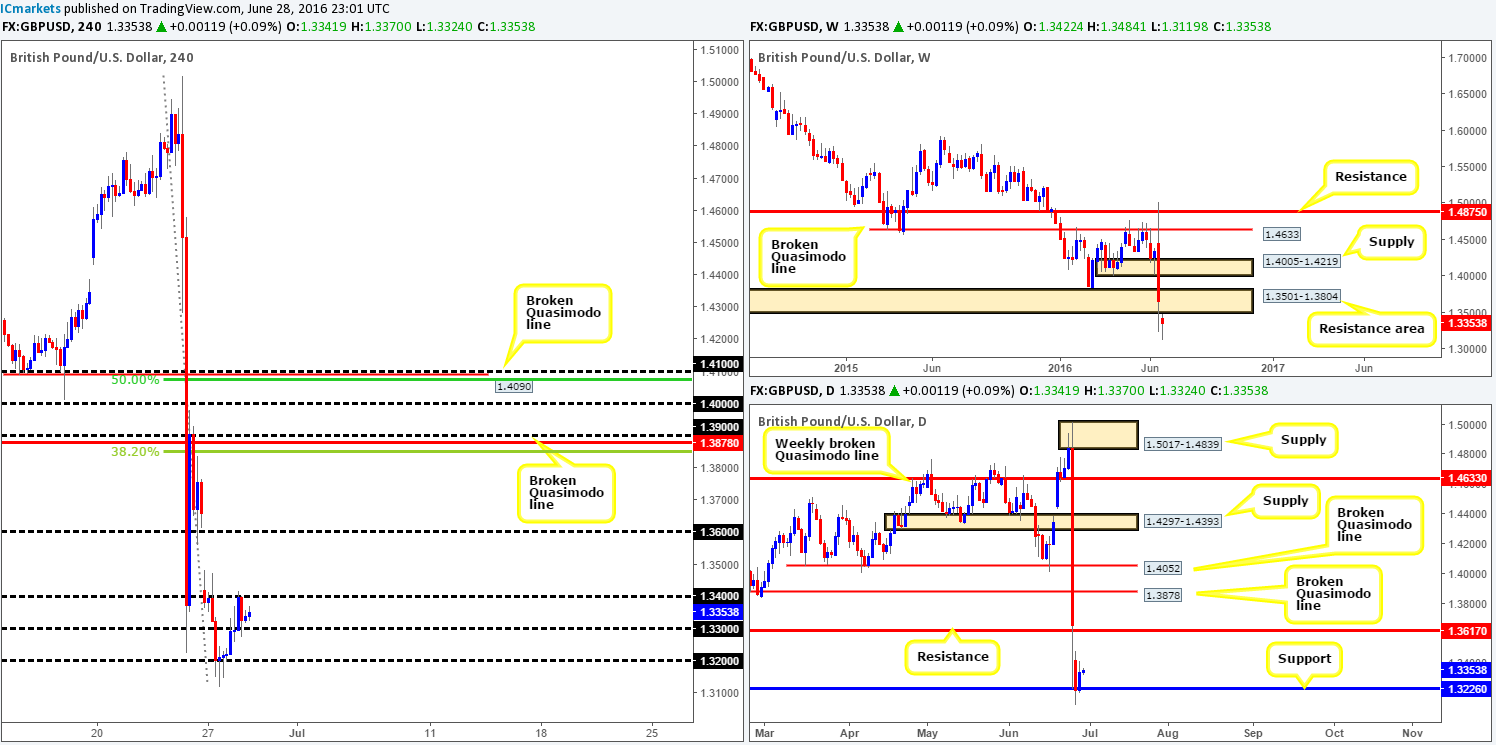
Recent trading shows that the GBP/USD extended its bounce from the 1.32 handle, consequently squeezing out shorts from the 1.33 line and filling offers around 1.34. In the event of a push above 1.34 today, cable could, from a technical standpoint, rally over 200 pips to connect with 1.36 as traders will be looking to fill the large weekend gap. The only grumble we see here is the fact that sterling has just retested the underside of a weekly resistance area at 1.3501-1.3804, which could force this pair lower.
Additionally, one needs to keep in mind that this unit is still very much in the spotlight at the moment and will likely be this way for a considerable time. Therefore, even the smallest comment from government officials could potentially cause immense volatility.
Our suggestions: Granted, a convincing close above the 1.34 mark would be attractive to initiate longs, targeting 1.36, but in view of the current weekly resistance area in play right now and brewing uncertainty, we’re going to avoid this pair for the time being.
Levels to watch/live orders:
- Buys: Flat (Stop loss: N/A).
- Sells: Flat (Stop loss: N/A).
AUD/USD:
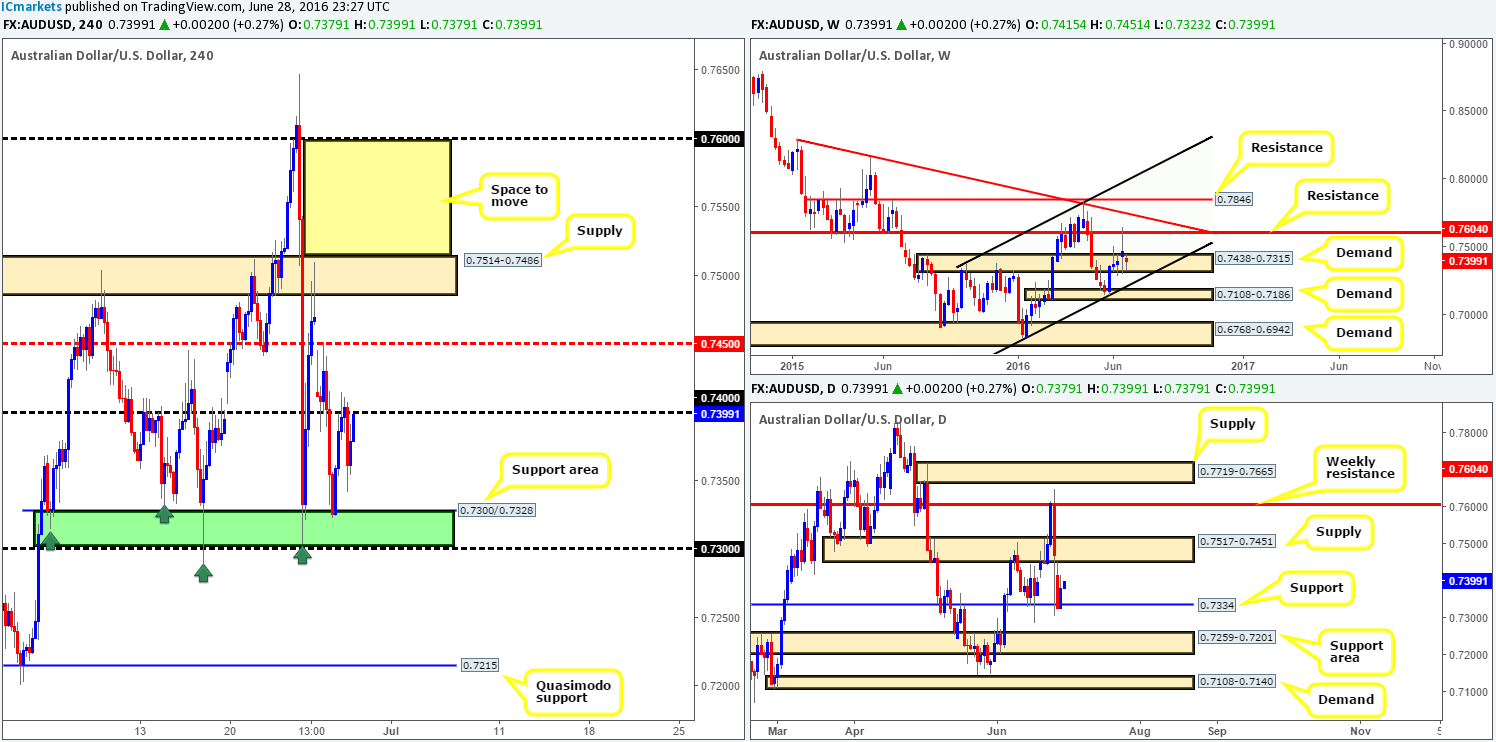
The story so far in the Aussie market shows bullish interest forming from deep within weekly demand at 0.7438-0.7315. A healthy push north from here could place the commodity currency back around the weekly resistance line coming in at 0.7604 (nearby ‘Brexit’ highs 0.7647). In conjunction with the weekly picture, support is being seen on the daily chart from 0.7334. Assuming this market remains bid from here the next upside target to keep a tab on is seen at 0.7517-0.7451 – a daily supply zone.
Despite higher timeframe structure conveying somewhat of a bullish picture, H4 price is now seen kissing the underside of the 0.74 handle, which already held price lower going into yesterday’s London session. Providing that a close above this number is seen followed by a retest as support there is scope for an intraday buy, targeting the H4 mid-way resistance at 0.7450 (the underside of the daily supply area mentioned above at 0.7517-0.7451).
Our suggestions: Watch for price to consume 0.74 and look to trade any retest seen thereafter (lower timeframe confirmation required). In regards to lower timeframe confirmation our team looks for either a break of a supply followed by a subsequent retest, a trendline break/retest or simply a collection of well-defined buying tails around the higher timeframe level.
Levels to watch/live orders:
- Buys: Flat (Stop loss: N/A). Watch for price to consume 0.74 and look to trade any retest seen thereafter (lower timeframe confirmation required).
- Sells: Flat (Stop loss: N/A).
USD/JPY:
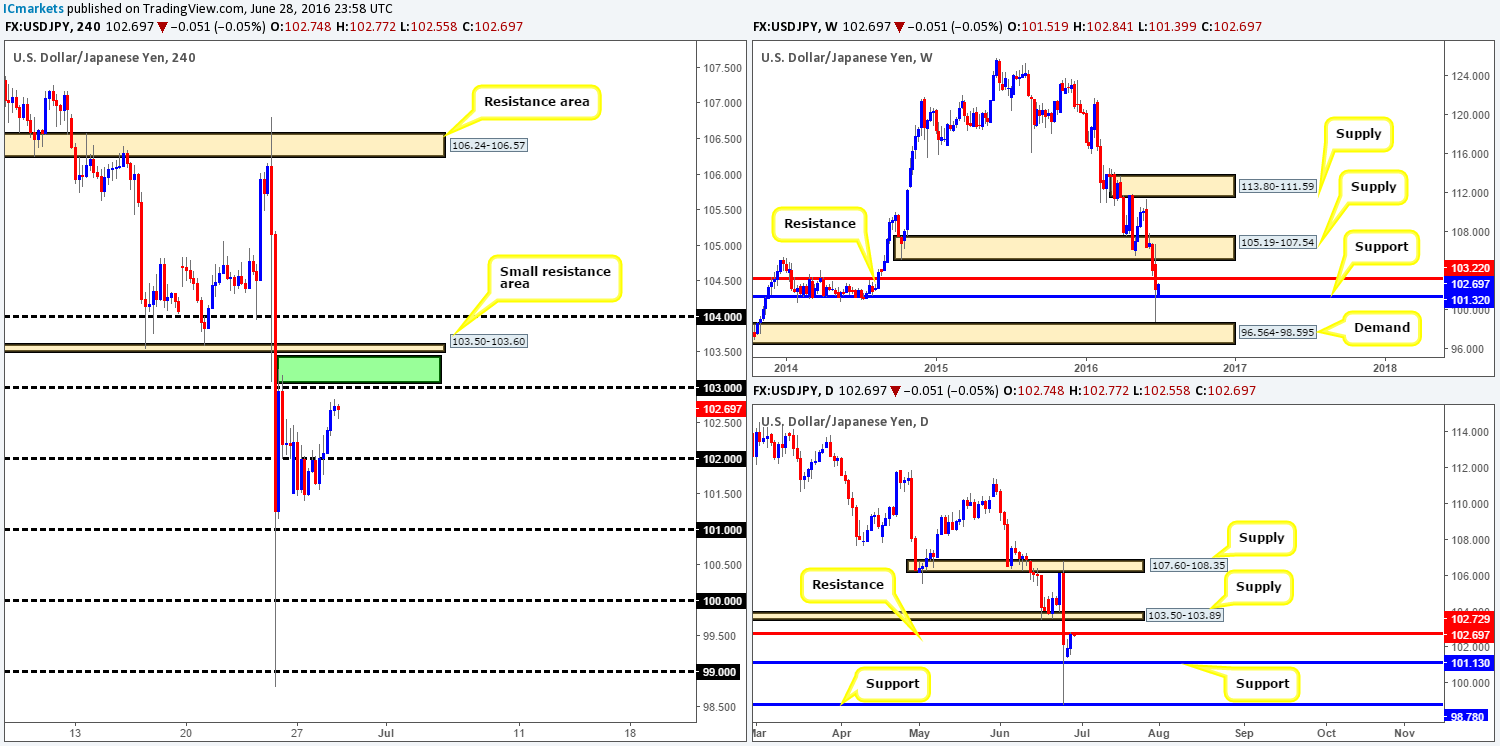
Upside momentum appears to have increased following the bounce seen from weekly support at 101.32. What is more, further buying from current price is possible according to the weekly chart as resistance does not come into view until we reach 103.22. Looking down to the daily chart, however, the pair has already connected with resistance drawn from 102.72. In view of the weekly picture, a break above this line could take place which would, as far as we can see, open the gates for price to challenge daily supply registered at 103.50-103.89 (positioned just above the current weekly resistance line).
Over on the H4 chart, recent buying has placed the market just ahead of the 103 handle. Now, given that this number held price lower during the ‘Brexit’ event, it could provide significant resistance. Therefore, between 103 and the small H4 resistance area at 103.50-103.60 (green box) marks a zone we believe price will turn from, as let’s not forget that this area also houses the aforementioned weekly resistance line.
Our suggestions: Put simply, we’re going to be looking for lower timeframe sell entries between 103/103.50-103.60 today. A suitable entry would be either a break of a demand followed by a subsequent retest, a trendline break/retest or simply a collection of well-defined selling wicks around the higher timeframe area. We would also advice being conservative with your stop by placing it above the H4 supply zone since this will give the trade room to breathe.
Levels to watch/live orders:
- Buys: Flat (Stop loss: N/A).
- Sells: 103/103.50-103.60 [Tentative – confirmation required] (Stop loss: dependent on where one confirms this area).
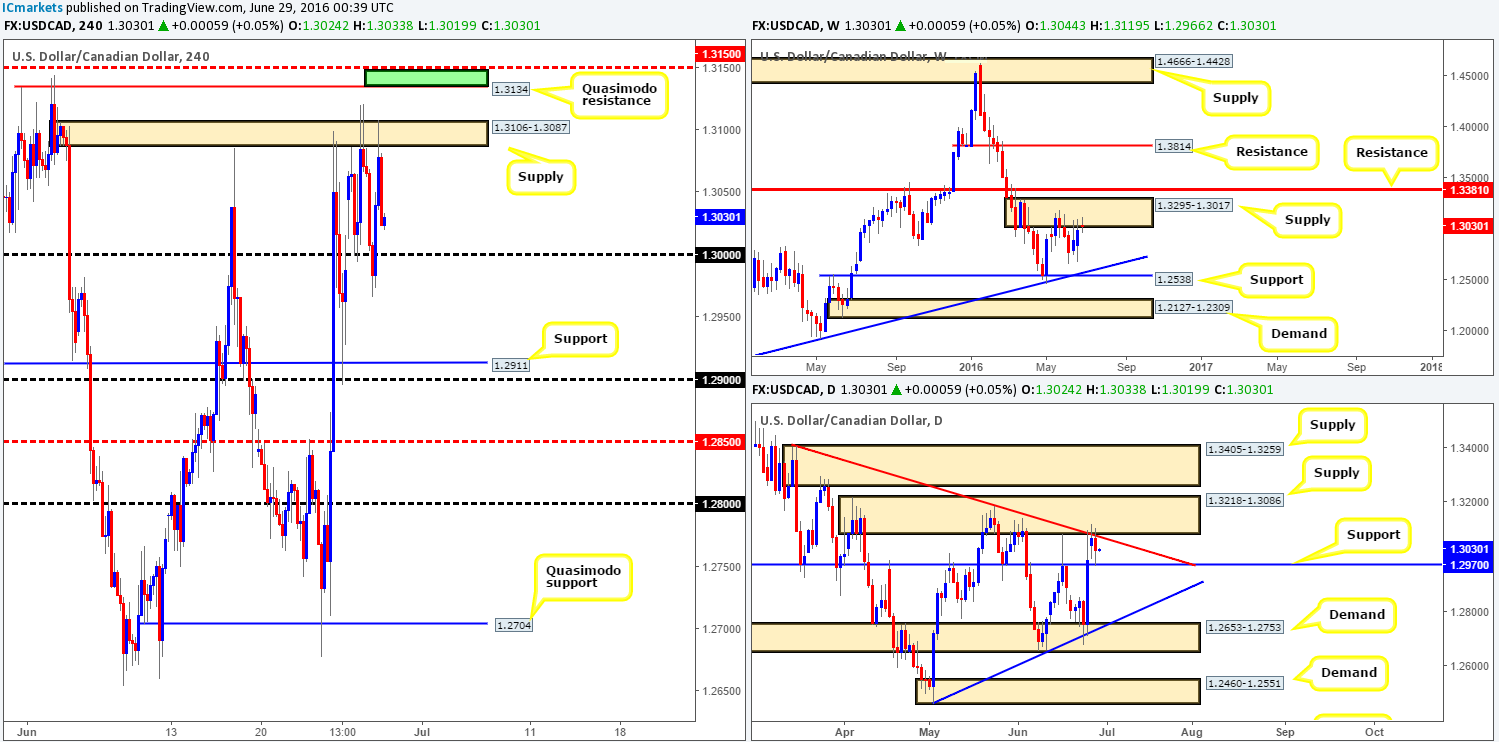
USD/CAD:
Although the H4 supply at 1.3106-1.3087 continues to hold this market lower, it looks as though it’s currently on very shaky ground. Directly above this supply sits a H4 Quasimodo resistance line coming in at 1.3134 that is bolstered by a H4 mid-way resistance level seen at 1.3150 (green zone). Looking just at the H4 chart for the moment, this small area of resistance (1.3150/1.3134) is a likely reversal point since stops (buy orders) above the current H4 supply would provide well-funded traders ample liquidity to sell!
In support of the above, one can see that weekly action is trading from a weekly supply at 1.3295-1.3017, as well as daily price also now touching gloves with a daily supply base drawn from 1.3218-1.3086 (merges with daily trendline resistance taken from the high 1.3405).
Our suggestions: Given the above points, our team has (once again) placed a pending sell order at 1.3133. Aggressive traders may want to place stops a few pips above 1.3150. Conservative traders, which are what we consider ourselves to be, may want to set stops above the high 1.3188 (1.1390). Our immediate take-profit target, should all go plan, is the 1.31 handle. It will be here that we’ll also look to reduce risk to breakeven.
Levels to watch/live orders:
- Buys: Flat (Stop loss: N/A).
- Sells: 1.3133 [Pending order] (Stop loss: 1.3190).
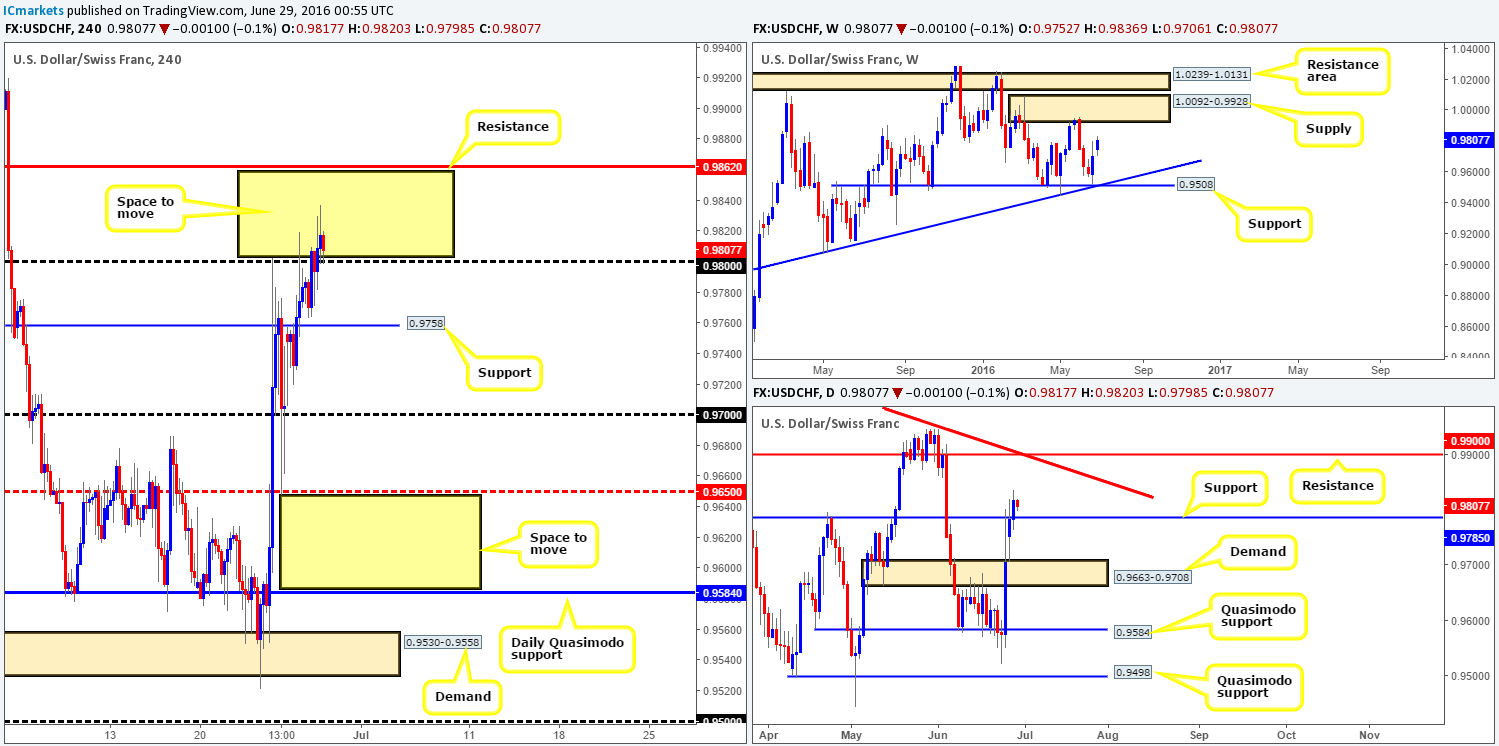
USD/CHF:
The Swissy, as you can see, rallied for a third consecutive day yesterday, reaching highs of 0.9836 by the day’s end. Psychological resistance 0.98 was taken out and has, at the time of writing, just been retested as support. In our previous report (see link below) we mentioned that a close above 0.98 would not only clear offers from this psychological boundary, but it would also take out the daily resistance line coming in at 0.9785. What is more, this would allow traders to then buy in-line with weekly expectations which shows that the path north is clear up to weekly supply drawn from 1.0092-0.9928.
Our suggestions: Given that the above scenario is currently in play, our team is going to be watching the lower timeframe price action for long entries today from 0.98, targeting the H4 resistance mentioned above at 0.9862, followed closely by the 0.99 hurdle (not only a round number but also a clear daily resistance). For those who are unsure of what lower timeframe entry signal to select, please see the top of this report for a list of our entry techniques.
Levels to watch/live orders:
- Buys: 0.98 region [Tentative – confirmation required] (Stop loss: dependent on where one confirms this area).
- Sells: Flat (Stop loss: N/A).
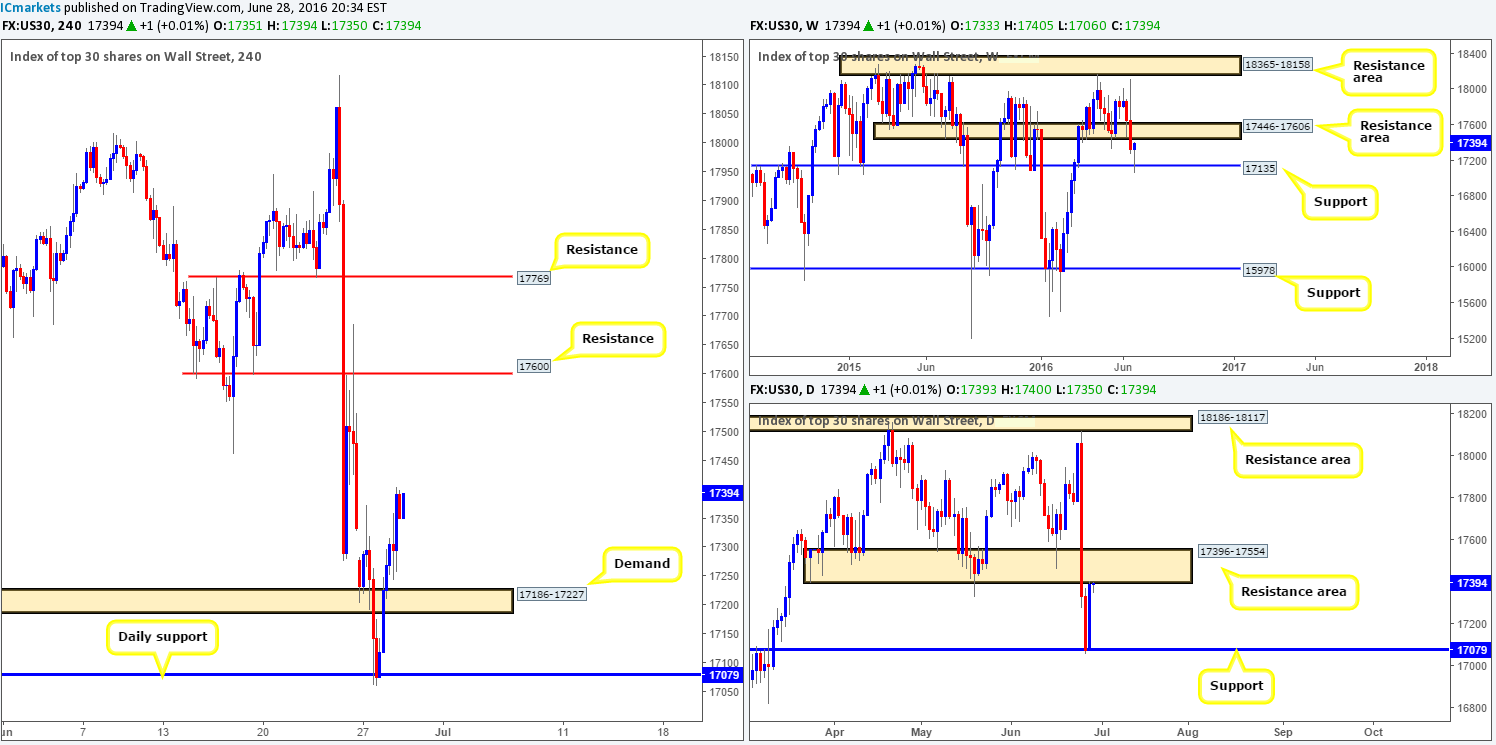
DOW 30:
Throughout the course of yesterday’s sessions US stocks recovered strongly from daily support at 17079, erasing all of Monday’s losses in the process. Apart from taking out H4 supply at 17186-17227 (now acting demand), the DOW also ended the day running into the underside of a daily resistance area drawn from 17396-17554. In that this area converges with a weekly resistance zone seen at 17446-17606, the bulls will likely have their work cut out for them if they intend to push this market higher from here.
Our suggestions: In light of the above points, the only sell line that really takes our fancy on the H4 chart is the resistance level given at 17600. Be that as it may, there’s a lot of ground to cover before this barrier is in full view. Furthermore, do take note that this number is located ABOVE the daily resistance area, but sits WITHIN the extreme upper edge of the weekly resistance zone.
In the event that price strikes the above said H4 resistance line today, we would, dependent on how the lower timeframe action responds (see the top of this report for lower timeframe entry techniques), look to short this market. Stops are usually placed 5-10 pips beyond confirming structures.
Levels to watch/live orders:
- Buys: Flat (Stop loss: N/A).
- Sells: 17600 region [Tentative – confirmation required] (Stop loss: dependent on where one confirms this area).
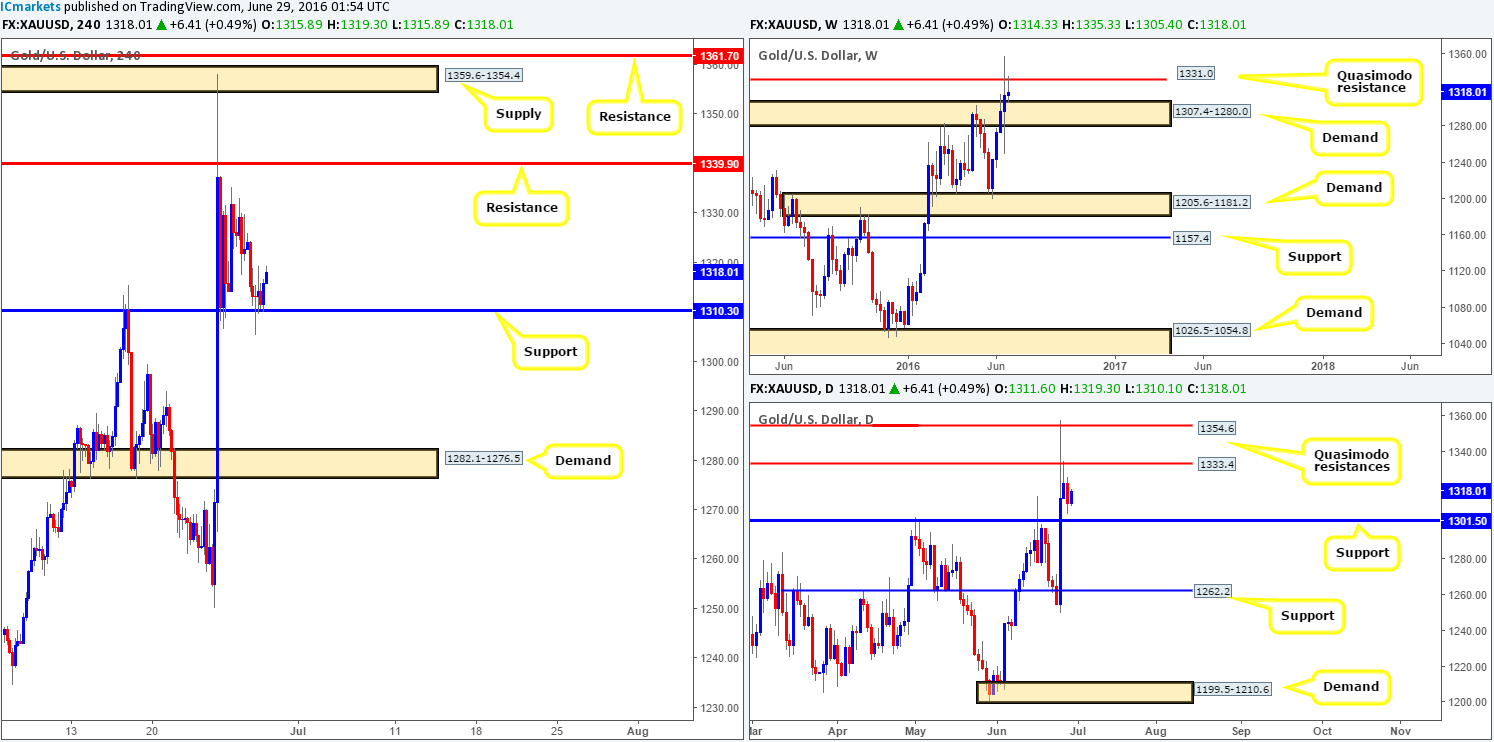
Gold:
Beginning with the weekly chart this morning, gold recently tagged the top-side of weekly demand drawn from 1307.4-1280.0 following a move lower from the weekly Quasimodo resistance at 1331.0, leaving this market with little direction as far as structure is concerned. Despite this, daily candles still show room for the yellow metal to drop lower to a daily support line coming in at 1301.5.
Stepping across to the H4 chart, price began recovering modestly from H4 support at 1310.3 going into yesterday’s London session. In the event that bids remain consistent here, the bounce from this line could force this unit back up to retest H4 resistance at 1339.9 today.
Our suggestions: Seeing as how price has just recently connected with a weekly demand base, one could look to try and find an entry long from the current H4 support region. However, we would highly recommend only doing so with the backing of lower timeframe confirmation , since, as we mentioned above, price could still decline further to shake hands with daily support at 1301.5. For those who agree with us in that lower timeframe confirmation is the better route to take, please see the top of this report for different entry techniques that we use.
Levels to watch/live orders:
- Buys: 1310.3 region [Tentative – confirmation required] (Stop loss: dependent on where one confirms this area).
- Sells: Flat (Stop loss: N/A).


