A note on lower timeframe confirming price action…
Waiting for lower timeframe confirmation is our main tool to confirm strength within higher timeframe zones, and has really been the key to our trading success. It takes a little time to understand the subtle nuances, however, as each trade is never the same, but once you master the rhythm so to speak, you will be saved from countless unnecessary losing trades. The following is a list of what we look for:
- A break/retest of supply or demand dependent on which way you’re trading.
- A trendline break/retest.
- Buying/selling tails/wicks – essentially we look for a cluster of very obvious spikes off of lower timeframe support and resistance levels within the higher timeframe zone.
- Candlestick patterns. We tend to only stick with pin bars and engulfing bars as these have proven to be the most effective.
We search for lower timeframe confirmation between the M15 and H1 timeframes, since most of our higher-timeframe areas begin with the H4. Stops are usually placed 5-10 pips beyond confirming structures.
EUR/USD:
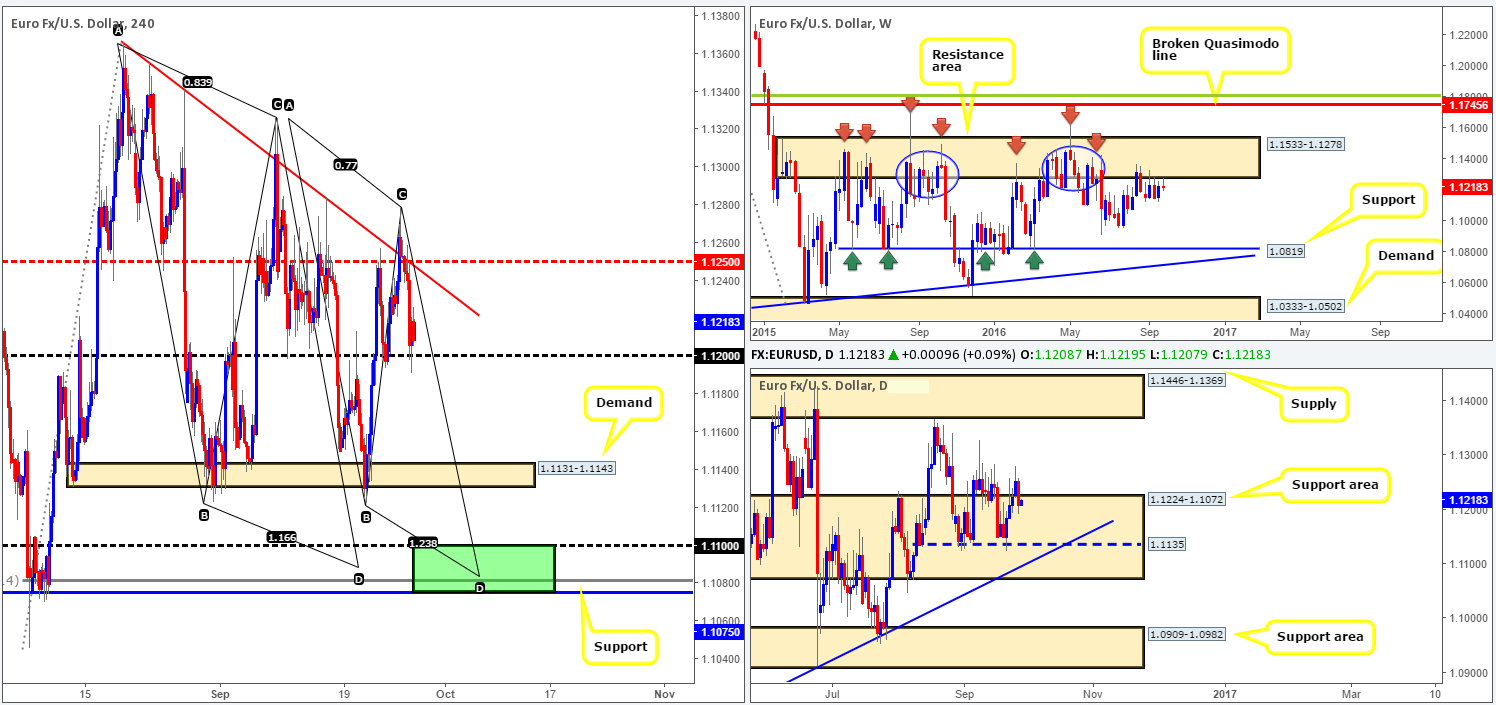
Based on recent H4 price action, we can see that strong sellers stepped in following a retest to the underside of the mid-way resistance 1.1250, bringing price down to the psychological boundary 1.12, which held firm into the day’s close. This latest bout of selling makes sense from a weekly perspective, as the shared currency is trading from the underside of a major resistance area seen at 1.1533-1.1278. Down on the daily chart, however, the pair is still seen flirting with a rather large support area penciled in at 1.1224-1.1072.
Our suggestions: To begin, we would be wary of buying from the 1.12 region today due to what’s been noted on the weekly chart (see above). A close below 1.12 followed up with a retest to the underside of this vicinity, along with a H4 bearish close would be sufficient enough to condone a short in this market we believe, despite prices lurking within a daily support area. Targets for this setup can be seen at 1.1131-1.1143: a H4 demand, followed by the H4 support at 1.1075 and the 1.11 band (green zone). Not only is 1.1075/1.11 a good take-profit area for any shorts in this market, it’s also a fantastic barrier to look for longs. It sits within the depths of the aforementioned daily support area, as well as converging with a daily trendline support taken from the low 1.0516, a deep H4 88.6% Fib support at 1.1081 and also two H4 AB=CD bull pattern completion points (taken from the highs 1.1366/1.1327). Although this H4 buy zone will very likely bounce price, do keep in mind that by entering long from here you’re effectively buying into weekly flow. As a result, waiting for at least a H4 bullish close to form prior to pulling the trigger here may be the better path to take.
On the data front today, nevertheless, we have US core durable goods orders hitting the wire at 12.30pm GMT, and also both the Fed Chair Janet Yellen and ECB’s President Draghi taking the stage between 2-2.30pm GMT.
Levels to watch/live orders:
- Buys: 1.1075/1.11 [H4 bullish close required] (Stop loss: beyond the trigger candle).
- Sells: Watch for a close below the 1.12 handle and look to trade any retest seen thereafter (H4 bearish close required).
GBP/USD:
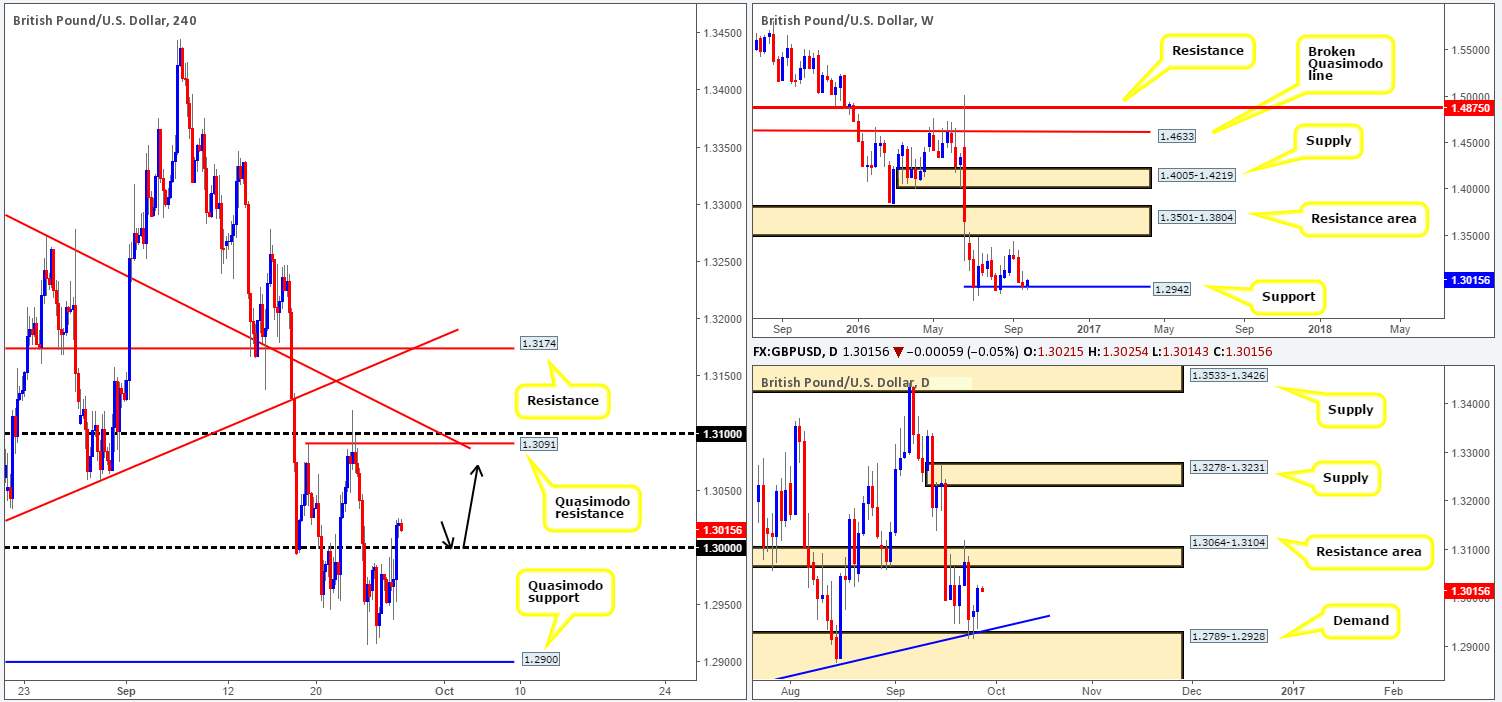
The pound is seen trading with a reasonably strong bias to the upside this morning. From a technical standpoint, weekly support at 1.2942 appears to be holding ground fairly well, as is the daily demand base at 1.2789-1.2928, which happens to connect with a trendline support taken from the low 1.2789. In addition to this recent buying, we can see that the key figure 1.30 was consumed as the markets entered yesterday’s US session. To our way of seeing things, the close above 1.30 has somewhat confirmed buying strength around the above said higher-timeframe structures, and has, according to the H4 chart, likely opened the path north up to a Quasimodo resistance at 1.3091 (merges with the 1.31 handle and a trendline resistance taken from the high 1.3371).
Our suggestions: Despite the predominant trend on this pair pointing in a southerly direction at present, a successful retest of 1.30 as support followed by a H4 bullish close would be enough to consider buying this market, targeting the aforementioned H4 Quasimodo barrier (see black arrows). However, we would not recommend setting and forgetting this trade, simply because prices may turn ahead of our target around the underside of the daily resistance zone seen at 1.3064-1.3104 (the next upside target on the daily timeframe), so remain vigilant guys!
On a side note traders, both the Fed Chair Janet Yellen and ECB’s President Draghi take the stage today between 2-2.30pm GMT, so expect volatile moves during this time.
Levels to watch/live orders:
- Buys: 1.30 region [H4 bullish close required] (Stop loss: beyond the trigger candle).
- Sells: Flat (Stop loss: N/A).
AUD/USD:
Kicking things off this morning with a look at the weekly chart shows us that the Aussie is now trading beyond the trendline resistance taken from the high 0.8295. This – coupled with the recent break of resistance at 0.7604 suggests further buying may be seen. However, it may be worth waiting for the weekly candle to close up shop before presuming that these weekly levels are consumed. This becomes even more apparent as we head down to the daily chart. Notice that the commodity currency is currently hugging the lower edge of a supply area logged in at 0.7719-0.7665, which could potentially halt further buying.
For those who read our previous report on the Aussie, you may recall that our team placed a pending sell order at 0.7697, just below the H4 Quasimodo resistance at 0.7698. Price missed our order by TWO pips yesterday before crashing to lows of 0.7641! Well done to any of our readers who managed jump aboard this one!
Our suggestions: If price should retest the 0.7698 neighborhood today, nonetheless, we would require at least a reasonably sized H4 bearish close to form (showing us that the bears still have interest here) before our team is permitted to short here again.

Levels to watch/live orders:
- Buys: Flat (Stop loss: N/A).
- Sells: 0.7698 region [H4 bearish close required] (Stop loss: beyond the trigger candle).
USD/JPY:
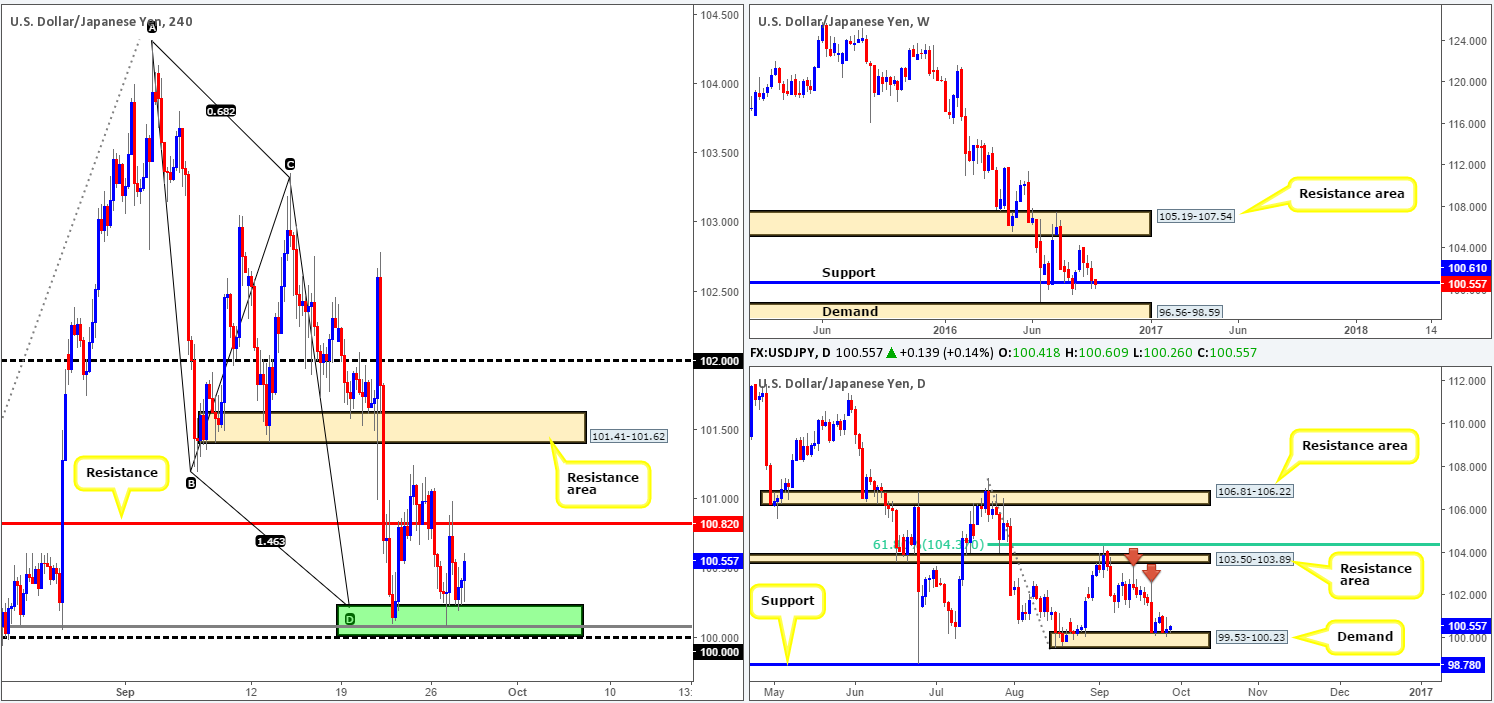
The 100.00/100.21 H4 buy zone (green rectangle) is clearly an area that the market respects at the moment, with prices seen bouncing from here again yesterday and reaching the H4 resistance level at 100.82. And, as you can see, the pair is once again seen testing the top edge of the 100.00/100.21 base for a third time, and looks all set to once again test the above said H4 resistance. Despite this area being bolstered by a daily demand area at 99.53-100.23, we will not be looking to become buyers in this market until we’ve seen a DECISIVE close beyond the aforementioned H4 resistance line.
Our suggestions: Following a close above 100.82, we would be looking to buy any H4 bullish candle formed off the top edge of this level, targeting the H4 resistance area at 101.41-101.62, followed by the 102 handle. However, do remain vigilant between 12.30pm-2pm GMT today as not only do we have US core durable goods on the docket, but we also see that Fed Chair Yellen takes the stand today, which will likely cause a stir in this market!
Levels to watch/live orders:
- Buys: Watch for a decisive close above the H4 resistance 100.82 and look to trade any retest seen thereafter (H4 bullish close required).
- Sells: Flat (Stop loss: N/A).
USD/CAD:
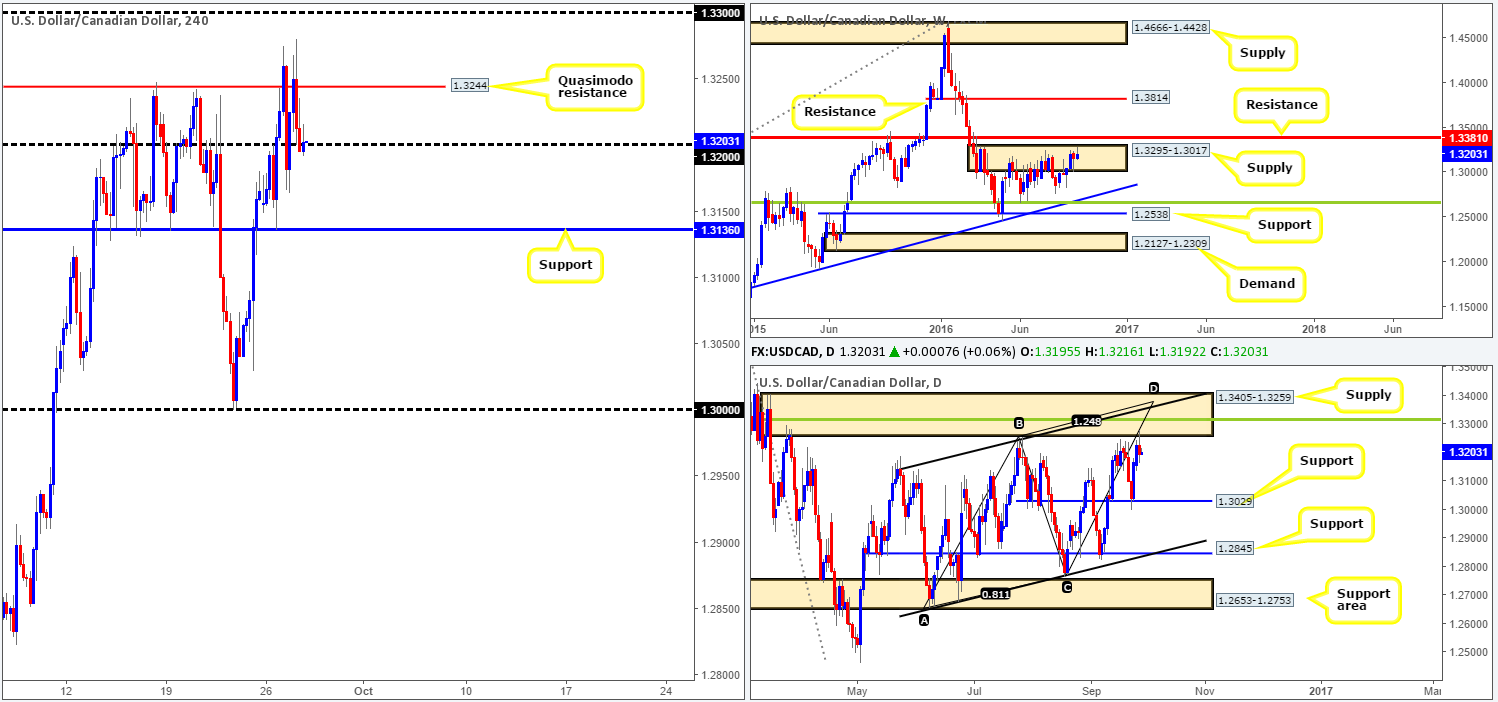
As can be seen from the H4 chart this morning, the buyers failed to sustain gains beyond the Quasimodo resistance level at 1.3244 yesterday, and has, in recent hours, closed back below the 1.32 handle. Given that the close below this number is a relatively important bearish cue and that there is little active demand seen below this number until we reach support at 1.3136, where do we see this market headed today? Well, of course, we are ultimately looking for the bears to defend 1.32 today and push on down to at least the 1.3136 mark. In support of this, over on the weekly chart we can see that sellers are beginning to come into the market from within the upper edge of a supply zone drawn from 1.3295-1.3017. Additionally, we also see that daily action is trading nicely from the underside of a supply barrier coming in at 1.3405-1.3259 at the moment.
Our suggestions: Should 1.32 hold as resistance and we are able to spot a lower timeframe confirming sell signal from here (see the top of this report for lower timeframe entry techniques), we would look to short targeting 1.3136 as a first take-profit zone. In the event that this target is consumed, our next take-profit area is set between the key figure 1.30 and 1.3029: a daily support – the next downside target on the daily timeframe.
In addition to the above, do keep an eye on the news around 2pm GMT today, as the Fed Chair Janet Yellen takes center stage.
Levels to watch/live orders
- Buys: Flat (Stop loss: N/A).
- Sells: 1.32 region [tentative – lower timeframe confirmation required] (Stop loss: dependent on where one confirms this area).
USD/CHF:
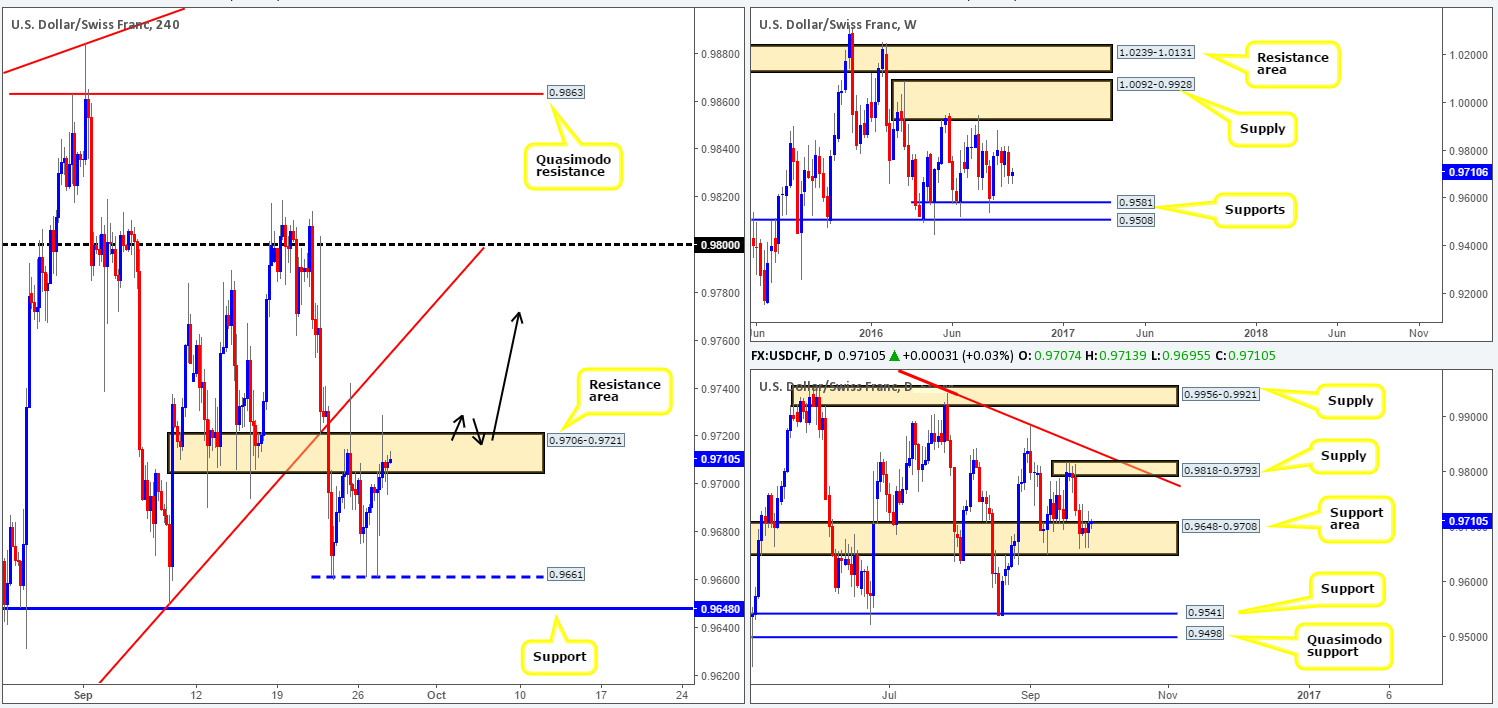
Since Thursday last week, the USD/CHF pair has been relatively lackluster, bouncing between 0.9661 and a H4 resistance area coming in at 0.9706-0.9721. There is not much ’wiggle room’ seen below this range in the event of a breakout, as a H4 support level sits at 0.9648. Above this range, nonetheless, H4 targets can be seen at a trendline resistance taken from the low 0.9537 and the 0.98 handle.
Looking up to the weekly chart, there has been very little change seen on this timeframe for a while now. Since the beginning of May, the pair has been consolidating between a supply zone painted at 1.0092-0.9928 and a support band drawn from 0.9581. Down on the daily chart, however, price is currently positioned within a support area carved from 0.9648-0.9708. Should buyers fail to continue defending this zone, the next barrier of interest beyond this area can be seen at 0.9541: a support level. Meanwhile, a break to the upside from the current base could see prices challenge supply coming in at 0.9818-0.9793.
Our suggestions: Ultimately, the only setup that really grabs our attention this morning is a break above and retest to the top edge of the current H4 range (see black arrows). To be on the safe side here guys, we recommend waiting for at least a H4 bullish close prior to pulling the trigger here, since let’s not forget that weekly action could still stretch down to tag support at 0.9581.
In addition to the above, do keep an eye on the news around 2pm GMT today, as the Fed Chair Janet Yellen takes center stage.
Levels to watch/live orders:
- Buys: Watch for a decisive close above the H4 resistance area at 0.9706-0.9721 and look to trade any retest seen thereafter (H4 bullish close required).
- Sells: Flat (Stop loss: N/A).
DOW 30:
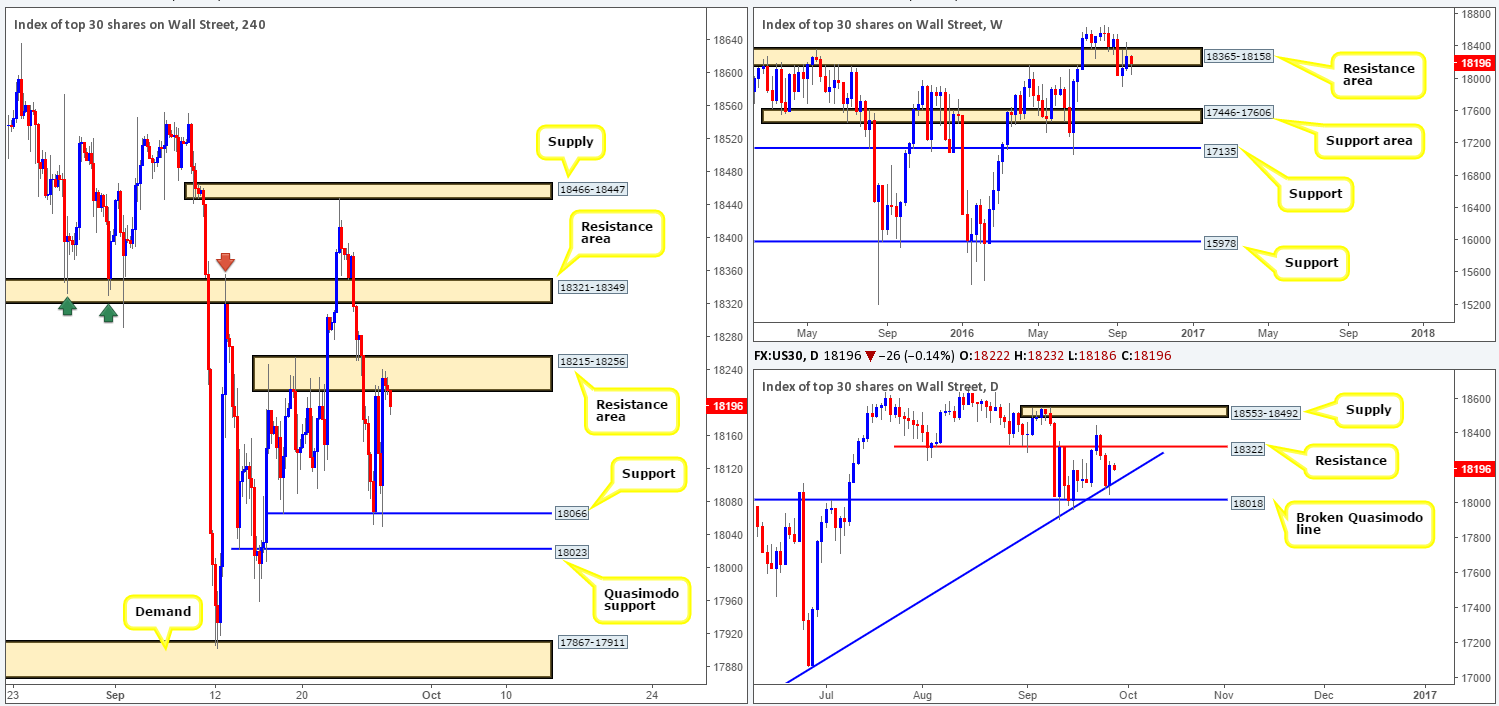
The current situation on the H4 chart shows that the DOW has entered into a phase of consolidation between a resistance area at 18215-18256 and a support level at 18066. Beyond either side of this range we see little room for maneuver. To the upside sits a resistance area coming in at 18321-18349, while to the downside there’s a nearby Quasimodo support band seen at 18023.
The daily chart, on the other hand, advocates further buying in this market following its recent rebound from a trendline support extended from the low 15501. The next area to watch from here can be seen at 18322: a resistance level. Meanwhile, weekly flow remains lodged within a resistance area seen at 18365-18158. This, of course, leaves traders in a precarious position: buy into the above said weekly resistance area or sell into the aforementioned daily trendline support?
Our suggestions: In that the top edge of the current H4 consolidation is not bolstered by a daily resistance level, we’re going to pass on looking for sells around this zone, despite it being housed within the weekly resistance area discussed above. The more prominent area, at least as far as we can see, is the H4 resistance zone planted above at 18321-18349. Not only does this barrier house the daily resistance level at 18322 but it also sits within the top edge of the current weekly resistance area! Therefore, should prices break out from the current H4 range and attack this region today, as well as print a reasonably sized H4 bearish candle close, our team would look to short this market, with stops placed above the trigger candle.
Levels to watch/live orders:
- Buys: Flat (Stop loss: N/A).
- Sells: 18321-18349 [H4 bearish close required] (Stop loss: beyond the trigger candle).
GOLD:
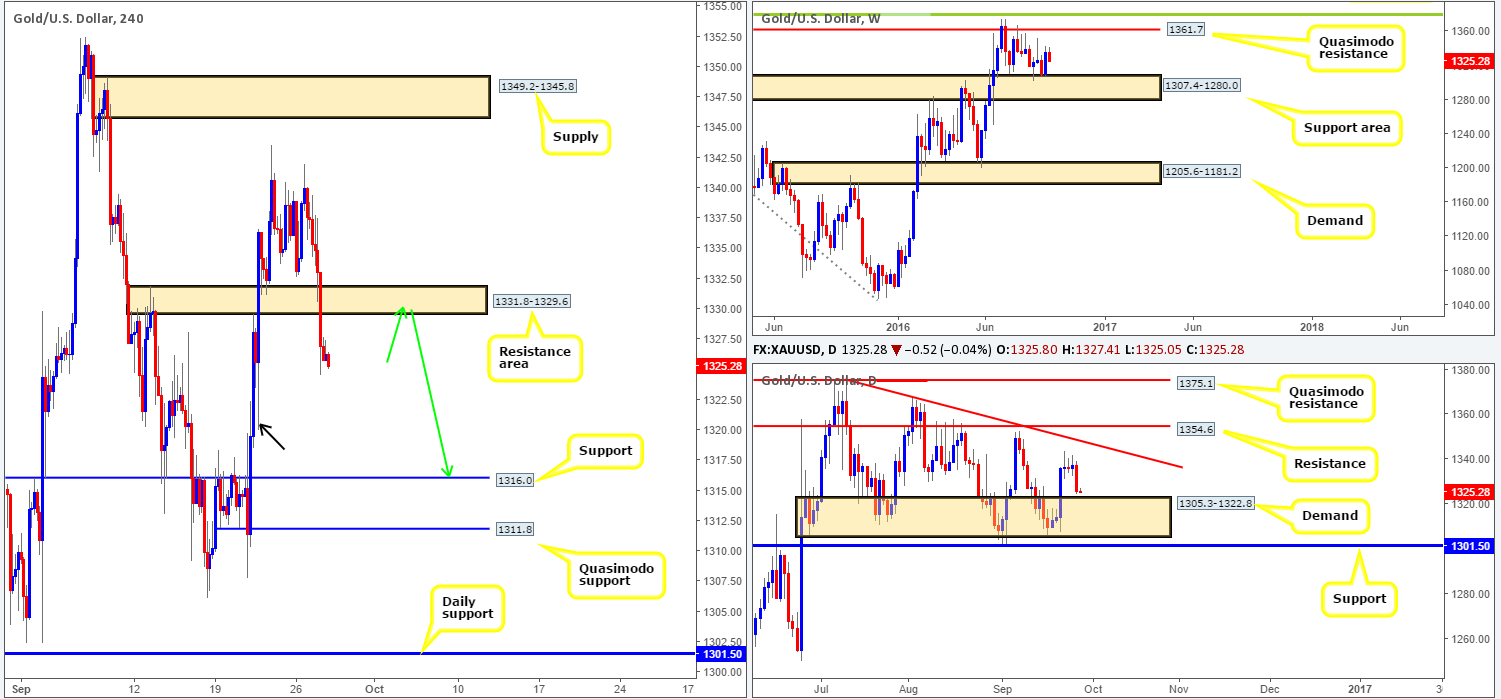
The gold market heavily sold off against the US dollar yesterday, resulting in price action breaking through a H4 support area at 1331.8-1329.6 (now an acting resistance area). The space seen beneath this zone is quite significant on the H4 chart, with very little active demand seen until we reach the support penciled in at 1316.0. The other key thing to note here is the demand consumption tail seen marked with a black arrow at 1320.0, which has potentially cleared the runway south down to the aforementioned support level.
However, shorting from the underside of the recently broken H4 support area (see green arrows) is not straightforward. Although it is still a possible trade, one would need to take into account how close price is lurking to the top edge of a daily demand area seen at 1305.3-1322.8. Therefore, if price tags the topside of this base before pulling back to retest the aforementioned H4 resistance area, our team would pass on selling this market. The risk is just too high given how well price has responded to this daily area in the past. If, however, we see a retest of the H4 resistance base, prior to tagging the topside of the daily demand, we would look to short from here should a reasonably sized H4 bearish candle close be seen.
Levels to watch/live orders:
- Buys: Flat (Stop loss: N/A).
- Sells: 1331.8-1329.6 [H4 bearish close required] (Stop loss: beyond the trigger candle).


