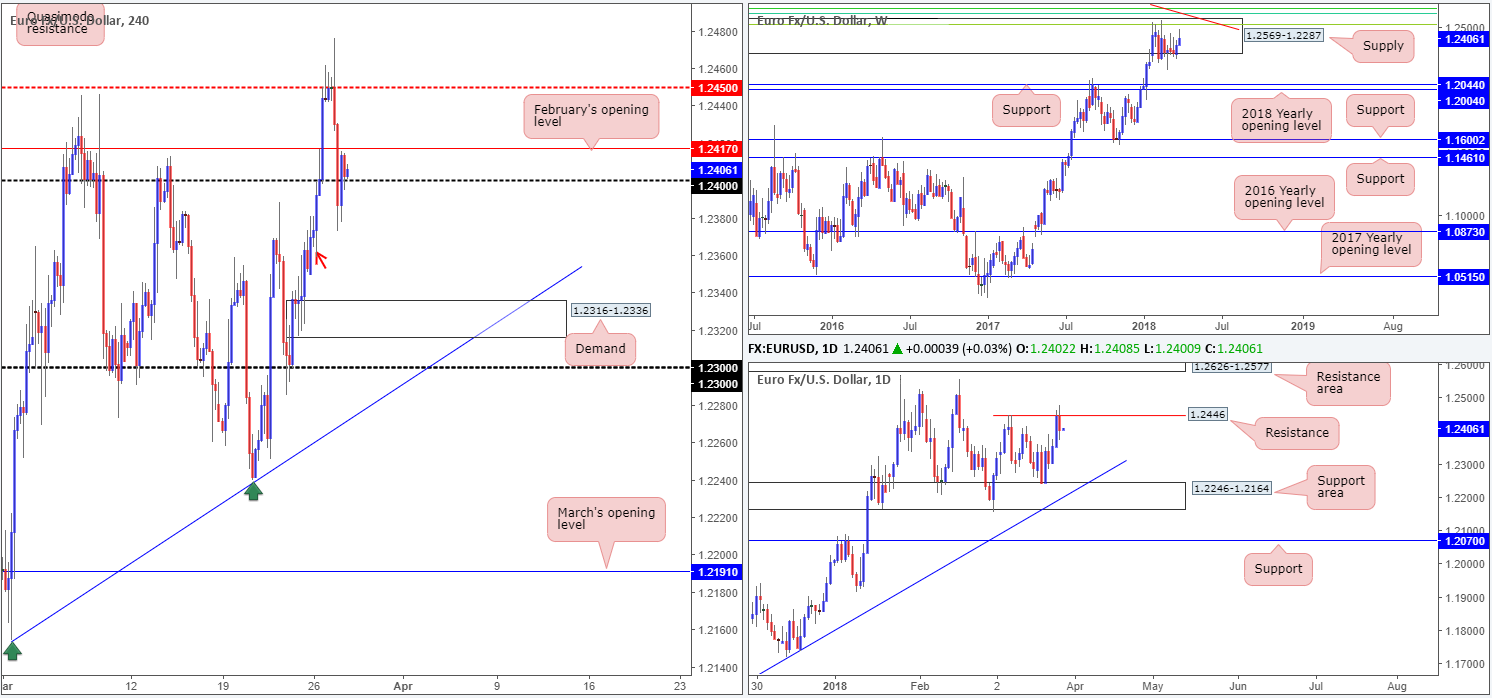
EUR/USD:
Unable to sustain gains beyond the H4 mid-level resistance at 1.2450 on Tuesday, the shared currency fell sharply on the back of less-than-stellar EUR M3 money supply y/y and a dovish dose of ECB chatter. The move forced price though bids at February’s opening level drawn from 1.2417 and the 1.24 handle. Support, as you can see, though, came in from 1.2387 and pushed the piece back above 1.24, strengthening on lower-than-expected US CB consumer confidence.
Since late January, the major has been consolidating within the walls of a weekly supply zone at 1.2569-1.2287. Downside targets from this angle remain at 1.2044: a weekly support, followed closely by the 2018 yearly opening level at 1.2004. A little lower on the curve, nevertheless, we can see that daily price chalked up a reasonably strong rejection candle off of a daily resistance level (08/03 high) at 1.2446 amid yesterday’s movement. Assuming that the sellers reman in the driving seat here, a move back down to the daily support area at 1.2246-1.2164 could be on the cards.
Potential trading zones:
Owing to much of the higher-timeframe action being based from weekly and daily resistances, the euro may retake 1.24 today. Beneath this line, there’s not a whole stopping the unit from reaching the H4 demand area coming in at 1.2316-1.2336. Our reasoning goes by the H4 tail marked with an arrow at 1.2359. This is, what we believe to be, a demand consumption tail.
Watch for a decisive H4 close beneath 1.24, followed up with a successful retest, for potential shorting opportunities.
Data points to consider today: US final GDP Q/Q; FOMC member Bostic speech.
Areas worthy of attention:
Supports: 1.24; 1.2316-1.2336; 1.2246-1.2164; 1.2044; 1.2004.
Resistances: 1.2569-1.2287; 1.2446; 1.2450; 1.2417.
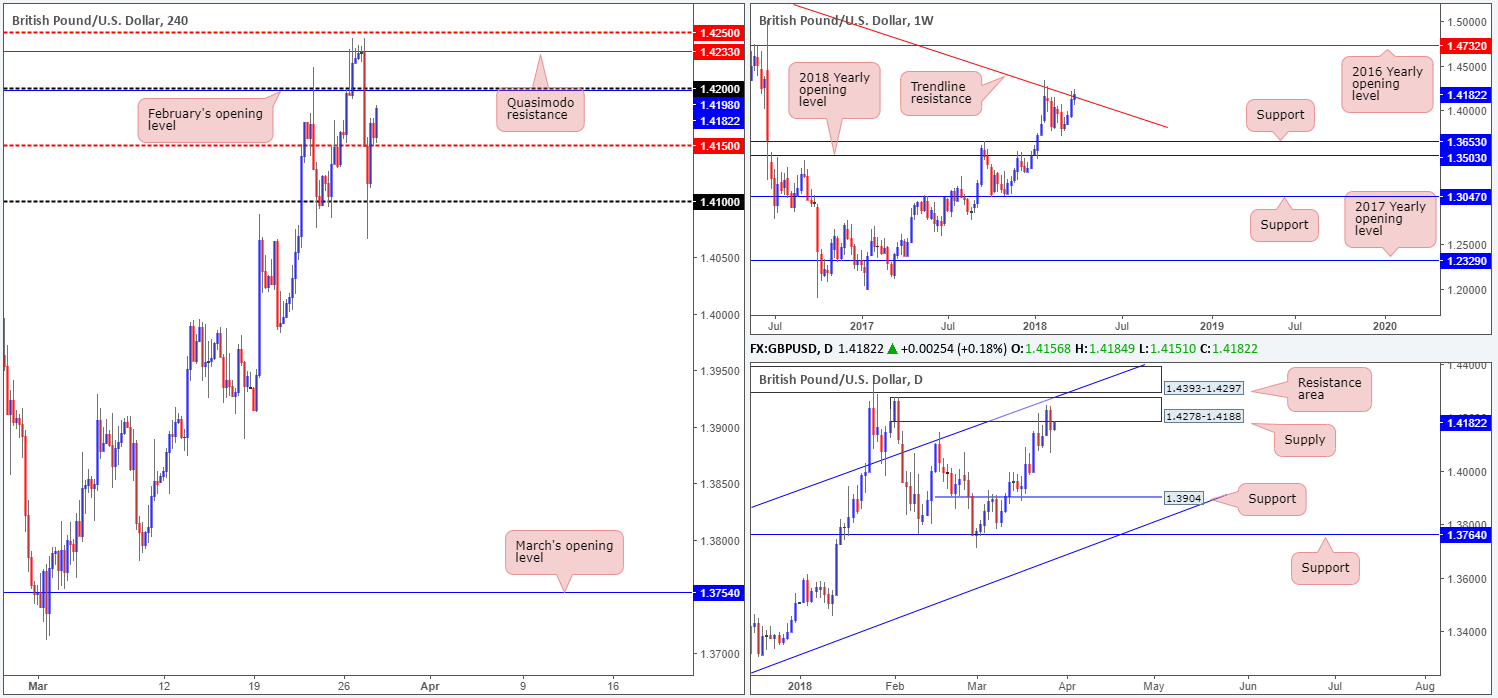
GBP/USD:
Sterling continued to take its cue from the USD on Tuesday, selling off heavily from a H4 Quasimodo resistance at 1.4233 and shattering multiple H4 tech supports. Downside momentum eased after piercing through 1.41, however, bottoming around 1.4066 which led to price reclaiming the H4 mid-level resistance at 1.4150 going into the closing bell.
Over on the bigger picture, daily price nudged lower from a daily supply zone at 1.4278-1.4188. Also worthy of note here is the daily resistance area sited just above it at 1.4393-1.4297 and intersecting daily channel resistance (etched from the high 1.2903). On the other side of the field, weekly movement can be seen interacting with a long-term weekly trendline resistance (taken from the high 1.5930).
Potential trading zones:
With H4 price on track to retest 1.42, which happens to fuse nicely with February’s opening level at 1.4198, a sell from here could be an option. We say this simply because both levels reside within the aforementioned daily supply zone, which itself interconnects with the above noted weekly trendline resistance.
Initial downside targets fall in at 1.4150 and 1.41.
Data points to consider today: US final GDP Q/Q; FOMC member Bostic speech.
Areas worthy of attention:
Supports: 1.41; 1.4150.
Resistances: weekly trendline resistance; 1.4278-1.4188; 1.4393-1.4297; daily channel resistance; 1.4233; 1.42; 1.4198.
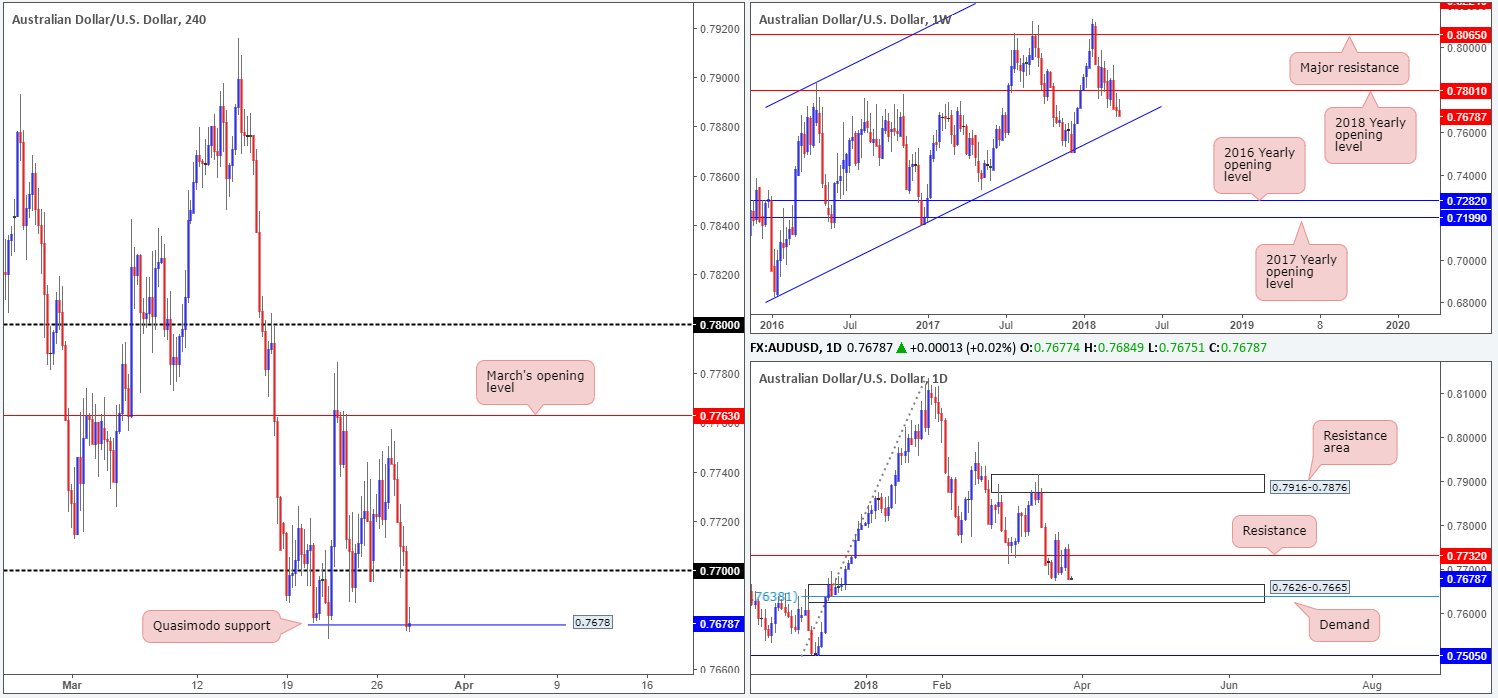
AUD/USD:
The Australian dollar was among the worst performers on Tuesday, largely taking its cues from a bid USD.
Leaving March’s opening level seen on the H4 timeframe at 0.7763 unchallenged, the pair went on to conquer the 0.77 handle and concluded trade shaking hands with a H4 Quasimodo support coming in at 0.7678. Beyond this barrier, we have the H4 mid-level support at 0.7650 in sight (not seen on the screen).
It’s doubtful that the current H4 Quasimodo will hold ground today. We say this because both weekly and daily price show room to press lower. Weekly action has a long-term weekly channel support (extended from the low 0.6827) on its radar, whereas daily movement is seen hovering just north off a daily demand area at 0.7626-0.7665.
Potential trading zones:
The team has noted the 78.6% daily Fib support at 0.7638 (seen within the current daily demand) and 0.7650 H4 mid-way point as a potential buy zone. What we really sets this area apart, nevertheless, is the fact that the weekly channel support mentioned above can be seen intersecting with this zone!
This could prove to be a reasonably big move given that we’re utilizing higher-timeframe areas. Therefore, the initial upside target falls in at a daily resistance drawn from 0.7732.
Data points to consider today: US final GDP Q/Q; FOMC member Bostic speech.
Areas worthy of attention:
Supports: 0.7678; 0.7650; 0.7626-0.7665; 0.7638; weekly channel support.
Resistances: 0.77; 0.7732; 0.7763.
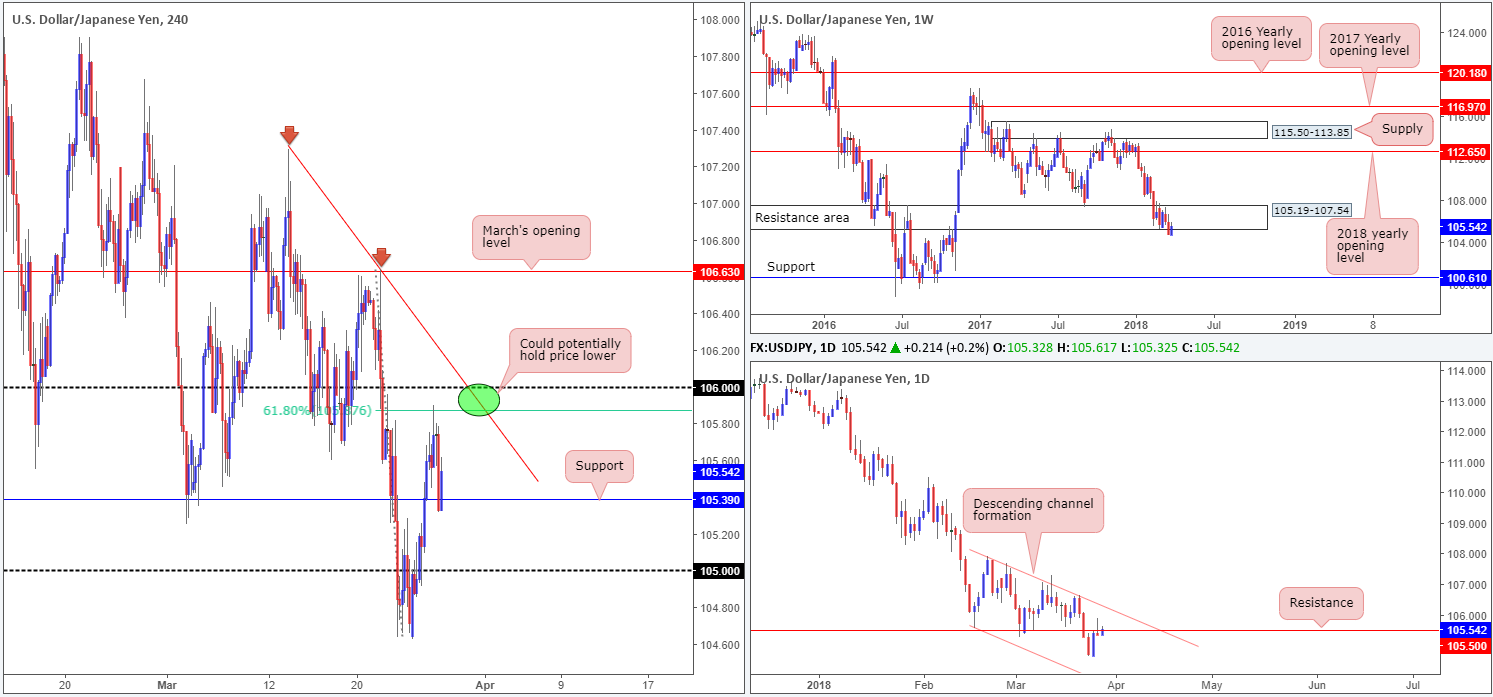
USD/JPY:
So far this week, we have seen weekly price rotate from lows of 104.62 and retest 105.19-107.54 as resistance. Should sellers defend this zone, there’s plenty of room for them to stretch their legs. The next support target on this scale can be seen at 100.61. On the daily timeframe, resistance at 105.50 recently elbowed its way into the spotlight and confirmed its presence with a nice-looking bearish selling wick printed during yesterday’s session. Further selling from this point could drag the unit as far south as a daily Quasimodo support plotted at 103.61 (not seen on the screen).
Across on the H4 timeframe, intraday price topped just south of the 106 handle at a 61.8% H4 Fib resistance drawn from 105.87 in recent trade, and retested H4 support marked at 105.39. A breach of this level has the 105 handle to target.
Potential trading zones:
Having seen higher-timeframe action reflect bearish intentions, buying from the current H4 support is not something we would label a high-probability move. The H4 area circled in green, however, could be an area worthy of consideration for a possible short, targeting 105.39, 105 and then quite possibly the higher-timeframe supports noted above (comprised of a H4 trendline resistance taken from the high 107.29, the aforementioned 61.8% H4 Fib support and 106 handle).
Data points to consider today: US final GDP Q/Q; FOMC member Bostic speech.
Areas worthy of attention:
Supports: 105; 105.39; 100.61; 103.61.
Resistances: 105.50; 105.19-107.54; 106; 105.87; H4 trendline resistance.
USD/CAD:
Since Friday, the H4 candles have been carving out a range between the 1.29 handle and March’s opening level at 1.2835. Traders may have also noticed the H4 descending channel in play from 1.2948/1.2846. Overhead, we have a H4 resistance area at 1.2946-1.2964, whereas, a little lower on the curve, the 1.28 handle is seen.
Turning our attention over to the daily timeframe, daily demand at 1.2803-1.2845 remains in motion. Providing that daily bulls defend the current demand base, a run up to nearby daily resistance at 1.3001 could take place. Further selling, on the other hand, has the daily support level at 1.2627 to target. Weekly price, however, continues to hold its bearish stance after rejecting the weekly resistance area at 1.3006-1.3115.
Potential trading zones:
Medium term, this market is somewhat restricted given weekly and daily structure (highlighted in bold).
Short term shows price respecting 1.29/H4 channel resistance. In fact, this would have been a reasonably nice-looking shorting opportunity given how well both structures fuse together.
Other than looking to fade March’s opening level mentioned above at 1.2835 (positioned within the current daily demand), we do not see much more to hang our hat on right now.
Data points to consider today: US final GDP Q/Q; FOMC member Bostic speech; Crude oil inventories.
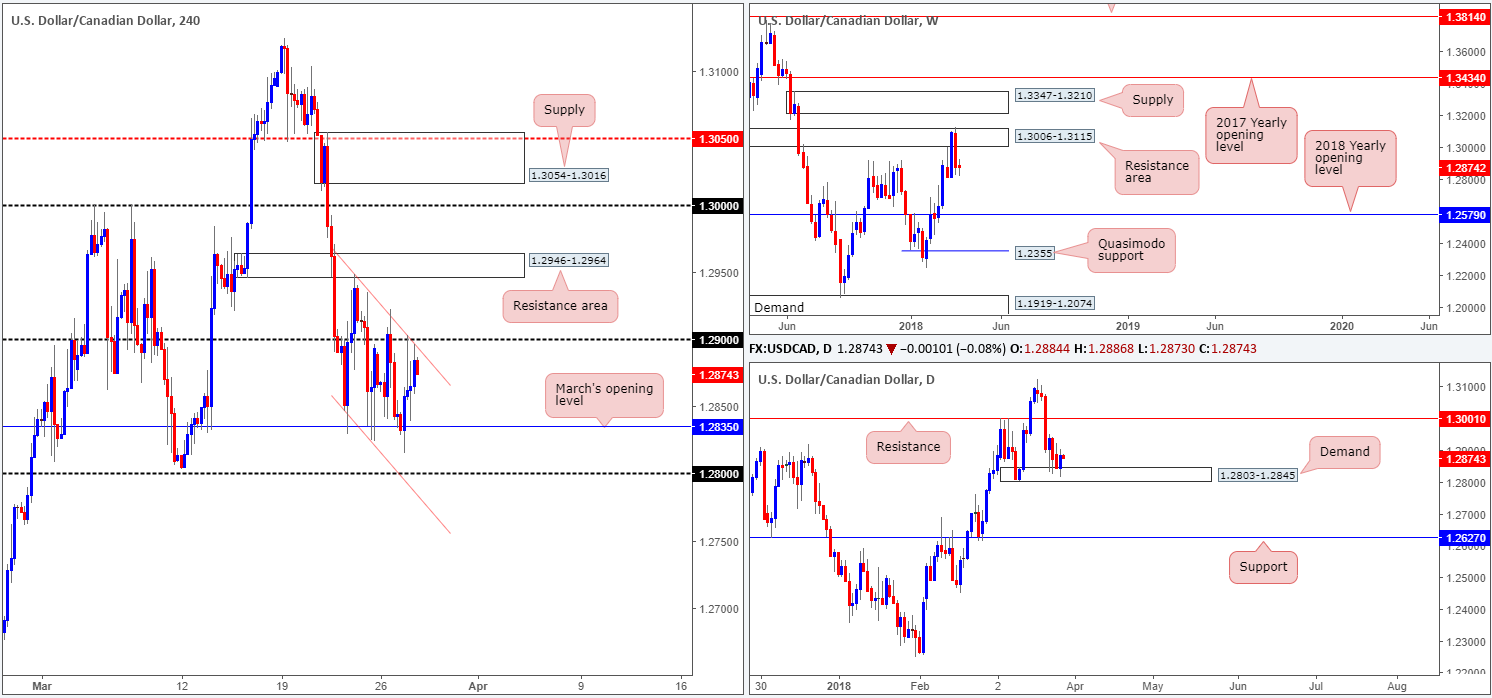
Areas worthy of attention:
Supports: 1.2835; 1.28; 1.2803-1.2845.
Resistances: 1.29; 1.2946-1.2964; 1.3006-1.3115.
USD/CHF:
Bolstered by a stronger greenback on Tuesday, the USD/CHF gravitated north following a text-book fakeout of March’s opening level seen on the H4 timeframe at 0.9444, which also happens to be a daily support level. The pair touched gloves with the 0.95 handle going into the early hours of US trade, whereby price aggressively turned lower and reclaimed a large portion of intraday gains.
Potential trading zones:
With the current daily support level in play, and weekly players trading within the walls of a weekly resistance area at 0.9443-0.9515, where does one go from here? Selling right now may not be the best move given how close we are positioned to 0.9444 right now. Likewise, buying is also a challenge knowing that we would effectively be buying into a pod of potential weekly sellers! As you can see, medium-term structure in this market is somewhat restricted at this time, and therefore we feel it best to remain on the sidelines for the time being.
Data points to consider today: US final GDP Q/Q; FOMC member Bostic speech; CHF Credit Suisse economic expectations.
Areas worthy of attention:
Supports: 0.9444.
Resistances: 0.95; 0.9443-0.9515.
DOW 30:
US equities initially built on Monday’s recovery amid opening trade on Tuesday. News reports that the US and China were willing to renegotiate tariffs eased fears. Despite this, upside momentum failed to hold ground as the H4 candles greeted a 61.8% Fib resistance level at 24426. Market participants appear worried over the likelihood of any possible retaliatory measures from other trading partners.
Yesterday’s downside move has positioned H4 price within striking distance of a small H4 demand base coming in at 23356-23452. On the daily timeframe, recent movement formed a nice-looking daily bearish engulfing candle that could send the index down as far south as the 161.8% daily Fib ext. point at 23256, which happens to be positioned within the walls of a weekly demand area at 23242-23494.
Potential trading zones:
In light of recent trade, we are expecting a follow-through move to the downside. Buying opportunities exist from the small H4 demand base mentioned above at 23356-23452. To be on the safe side, though, we would strongly recommend placing stops beyond the weekly demand area noted above at 23242-23494.
Data points to consider today: US final GDP Q/Q; FOMC member Bostic speech.

Areas worthy of attention:
Supports: 23242-23494; 23256; 23356-23452.
Resistances: 24426.
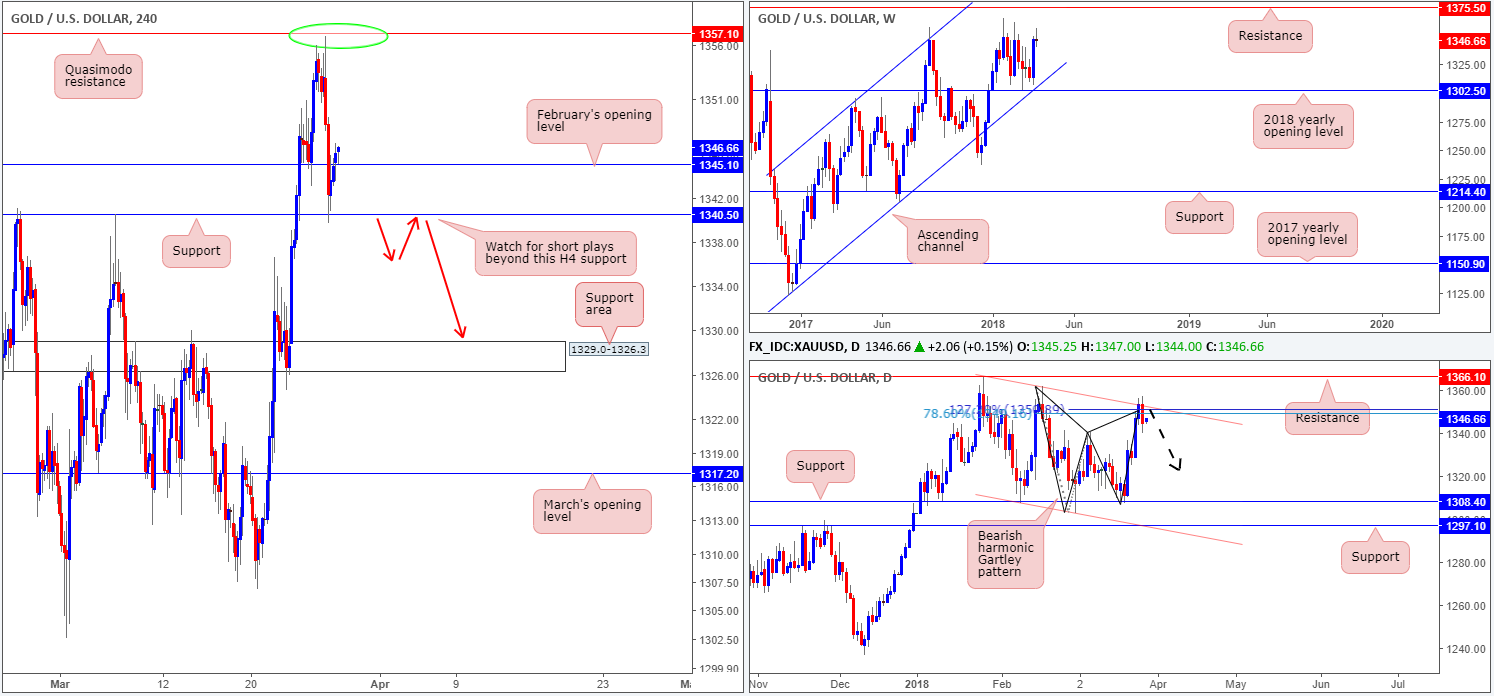
GOLD:
For those who read Tuesday’s report you may recall that the team highlighted a possible shorting opportunity from a H4 Quasimodo resistance at 1357.1. As you can see, H4 price fell sharply just south of this level as we entered London trade, breaching February’s opening level at 1345.1 and testing H4 support at 1340.5.
Although a recovery attempt is currently in play, with the H4 candles climbing back above Feb’s open level, we feel further downside could be on the cards. This is largely because of the nice-looking daily bearish harmonic Gartley pattern that terminates (78.6% Fib retracement) around 1349.6, which is closely positioned to a daily channel resistance extended from the high 1366.0.
Potential trading zones:
As things stand on the daily timeframe right now, buying this market is likely a chancy play. The team has noted to keep an eyeball on the H4 support level marked at 1340.5. A break of this base (followed up with a retest for shorts) could open up the gates for a challenge of a H4 support area at 1329.0-1326.3, potentially followed by March’s opening level at 1317.2.
Areas worthy of attention:
Supports: 1345.1; 1340.5; 1329.0-1326.3; 1317.2.
Resistances: 1349.6; daily channel resistance; 1357.1.
This site has been designed for informational and educational purposes only and does not constitute an offer to sell nor a solicitation of an offer to buy any products which may be referenced upon the site. The services and information provided through this site are for personal, non-commercial, educational use and display. IC Markets does not provide personal trading advice through this site and does not represent that the products or services discussed are suitable for any trader. Traders are advised not to rely on any information contained in the site in the process of making a fully informed decision.
This site may include market analysis. All ideas, opinions, and/or forecasts, expressed or implied herein, information, charts or examples contained in the lessons, are for informational and educational purposes only and should not be construed as a recommendation to invest, trade, and/or speculate in the markets. Any trades, and/or speculations made in light of the ideas, opinions, and/or forecasts, expressed or implied herein, are committed at your own risk, financial or otherwise.
The use of the site is agreement that the site is for informational and educational purposes only and does not constitute advice in any form in the furtherance of any trade or trading decisions.
The accuracy, completeness and timeliness of the information contained on this site cannot be guaranteed. IC Markets does not warranty, guarantee or make any representations, or assume any liability with regard to financial results based on the use of the information in the site.
News, views, opinions, recommendations and other information obtained from sources outside of www.icmarkets.com.au, used in this site are believed to be reliable, but we cannot guarantee their accuracy or completeness. All such information is subject to change at any time without notice. IC Markets assumes no responsibility for the content of any linked site. The fact that such links may exist does not indicate approval or endorsement of any material contained on any linked site.
IC Markets is not liable for any harm caused by the transmission, through accessing the services or information on this site, of a computer virus, or other computer code or programming device that might be used to access, delete, damage, disable, disrupt or otherwise impede in any manner, the operation of the site or of any user’s software, hardware, data or property.


